Whole-Genome Characteristics and Polymorphic Analysis of Vietnamese Rice Landraces as a Comprehensive Information Resource for Marker-Assisted Selection
Abstract
Next generation sequencing technologies have provided numerous opportunities for application in the study of whole plant genomes. In this study, we present the sequencing and bioinformatic analyses of five typical rice landraces including three indica and two japonica with potential blast resistance. A total of 688.4 million 100 bp paired-end reads have yielded approximately 30-fold coverage to compare with the Nipponbare reference genome. Among them, a small number of reads were mapped to both chromosomes and organellar genomes. Over two million and eight hundred thousand single nucleotide polymorphisms (SNPs) and insertions and deletions (InDels) in indica and japonica lines have been determined, which potentially have significant impacts on multiple transcripts of genes. SNP deserts, contiguous SNP-low regions, were found on chromosomes 1, 4, and 5 of all genomes of rice examined. Based on the distribution of SNPs per 100 kilobase pairs, the phylogenetic relationships among the landraces have been constructed. This is the first step towards revealing several salient features of rice genomes in Vietnam and providing significant information resources to further marker-assisted selection (MAS) in rice breeding programs.
1. Introduction
Whole-genome sequencing (WGS) has revealed genetic information and genome structure and facilitated the identification of gene function of different plant species including some major crops such as rice, wheat, tomato, and soybean [1–5]. Next generation sequencing (NGS) methods are rapid and cost-effective, providing many promising applications for plant genomics and affording further insight into massive genomic variations [6, 7]. Combining NGS with bioinformatics is a powerful approach to detect DNA polymorphisms for quantitative trait loci (QTLs) analyses, marker-assisted selection, genome-wide association studies (GWAS), and linkage disequilibrium analysis in plants [8–11]. Moreover, DNA polymorphisms have been widely applied as DNA markers in genetic crop research [12].
Rice (Oryza sativa L.) is a staple crop and provides daily food for over half of the world’s population. It contains two major groups, indica and japonica, which diverged more than one million years ago [13]. The recent sequencing of one representative from each group facilitated the study of the genomic structure of rice. In 2002, the first draft sequence of the indica genome was established by shotgun sequencing and homologous genes were predicted by comparison with the Arabidopsis thaliana genome by Yu et al. [14]. Subsequently, the complete genome sequence of japonica was generated in 2005 [15] and then updated using NGS and optical mapping in 2013 [1]. This genome version has been widely utilized as the reference rice genome for DNA polymorphism findings reported in some previous studies [16, 17].
Asian rice is one of the major worldwide cereal crops. Among Asian countries, Vietnam is one of the world’s leading rice exporters, accounting for 16% of the world trade volume of rice [18]. To the best of our knowledge, the lack of whole-genome sequencing has raised concerns in relation to the characteristics of Vietnamese rice landraces; therefore, the objective of the current work was to perform genome analysis of five rice landraces, three indica and two japonica, collected in different ecological areas of Vietnam, by applying Illumina’s paired-end sequencing. The generated reads were then mapped to the Nipponbare reference sequence to analyze the genomic features and discover and annotate candidate single nucleotide polymorphisms (SNPs) and insertions and deletions (InDels). The results presented may help to unravel the genetic basis of our rice genomes and polymorphic resources for molecular marker identification in the future.
2. Materials and Methods
2.1. Plant Materials and Whole-Genome Sequencing
The five Vietnamese rice landraces were collected from different ecological areas in Vietnam: Ha Giang (104°58′51′′E, 22o49′00′′N) and Lang Son (106°45′40′′E, 21°51′14′′N) in the northeast, Bac Ninh (106°04′24′′E, 21°11′15′′N) in the Red River Delta, Nghe An (104°58′38′′E, 19°10′35′′N) in the North Central Coast, and Can Tho (105°47′03′′E, 10°01′57′′N) in the Mekong River Delta. For convenience, the genomes were labeled (Table 1, Table S1 in the Supplementary Material available online at https://doi.org/10.1155/2017/9272363) as indicated in the list of Vietnamese native rice landraces according to the report of Trung and Ham [19]. Total DNA of each landrace was extracted from young leaf tissue using Qiagen DNeasy kit (Qiagen, Germany). The library preparation and sequencing of the rice genomes were carried out using Illumina HiSeq 2000 by applying Illumina pipeline 1.9 at the Genome Analysis Centre (TGAC), UK. The obtained FASTQ files were further assessed by FastQC software and deposited in the NCBI sequence read archive (SRA) with accession numbers SRP064171 (indica 12: SRR2529343, indica 13: SRR2543299, indica 15: SRR2543338, japonica 11: SRR2543336, and japonica 14: SRR2543337).
| Abbreviation | Name of rice landraces (name in Vietnamese) |
Subspecies | Origin |
|---|---|---|---|
| indica 12 | Chiem nho Bac Ninh 2 | indica | Bac Ninh province |
| indica 13 | Nep lun | indica | Ha Giang province |
| indica 15 | OM6377 | indica | Can Tho province |
| japonica 11 | Bletelo | japonica | Lang Son province |
| japonica 14 | Khau mac buoc | japonica | Nghe An province |
2.2. Mapping and Identification of SNPs and InDels
The paired-end reads were first aligned with the nuclear reference genome (O. sativa L. cv. Nipponbare, MSU release 7.0, GenBank accession PRJDB1747) and the organellar genomes (chloroplast genome, GenBank accession NC_001320.1; mitochondria genome, GenBank accession BA00029.3) using the alignment software BWA (version 0.6.2) with default parameters. The mapping quality was assessed by Qualimap (version 2.1) and BEDtools. The duplicated sequences were marked and removed by Picard tools (version 1.79). SNPs and InDels were then called and qualified by SAMtools (version 1.1) and VarScan (version 2.3.7) with the following parameters: mapping quality of 20, depth of coverage of 10, average of base quality of 30, and variant frequency of 0.1 with SNPs and 0.3 with InDels. The distribution of SNPs and InDels per 100 kb along the chromosome was used to determine SNP-poor regions (<1 SNP/1 kb) (Figure S1). Pearson correlation coefficients of SNP density among the landraces were calculated using R. The common reads mapped to both chromosomes and organelles were removed from BAM files using SAMtools (version 1.1) and BWA (version 0.6.2).
2.3. Annotation of SNPs and InDels
The SNPs and InDels were annotated using SnpEff (version 3.6) with the GFF file of the reference genome containing positional information of rice genomic regions, exons, 5′UTR, 3′UTR, and CDS. To identify outlier genes, the cutoff values of nonsynonymous SNPs were identified by using the five-number summary of box-and-whisker plot.
3. Results
3.1. Mapping of Whole-Genome Sequencing Reads
The whole genomes of three Vietnamese indica and two japonica rice landraces were resequenced and produced 688.4 million 100 bp paired-end reads in total. Among them, 621.8 million reads (90.32%) were successfully aligned to the Nipponbare nuclear reference genome. The alignment rates of each landrace were relatively high, ranging from 86.33% to 93.87%, yielding 30x–40x coverage in depth (Table 2) (Table S2a–e for chromosome coverage in detail).
| Landraces | indica 12 | indica 13 | indica 15 | japonica 11 | japonica 14 |
|---|---|---|---|---|---|
| Total readsa | 129,251,696 | 112,867,645 | 151,576,754 | 133,602,832 | 161,141,384 |
| # mapped readsb | 112,667,155 | 101,814,936 | 130,851,417 | 125,253,671 | 151,261,159 |
| Mapped reads (%) | 87.17% | 90.21% | 86.33% | 93.75% | 93.87% |
| # unmapped readsc | 16,584,541 | 11,052,709 | 20,725,337 | 8,349,161 | 9,880,225 |
| Unmapped reads (%) | 12.83% | 9.79% | 13.67% | 6.25% | 6.13% |
| Mean mapping qualityd | 42.21 | 44.59 | 42.03 | 47.81 | 48.14 |
| Coveragee | 91.30% | 89.18% | 92.56% | 95.50% | 96.49% |
| Depthf | 29.94 | 27.09 | 34.74 | 33.46 | 40.41 |
- aThe raw reads in the FASTQ files. bThe number of reads mapped to 12 chromosomes in the nucleus. cThe number of unmapped reads to both nuclear and organellar genomes. dThe error probability of read mapping scaled by Phred quality. eThe breadth of coverage across the nuclear genome. fThe sequencing depth of reads.
The genome coverage ranged from 89.18% to 96.49% of the reference (Table 2 and Tables S2a–S2e). The organelle genomes (mitochondrial and chloroplast) had coverage of 94% −100% (Tables S3a and S3b). There was a portion of reads (0.17%~0.26%) that could be aligned to both nuclear DNA genome and organelle genomes, mitochondrial and chloroplast (Tables S4a–S4e).
3.2. Detection and Distribution of SNPs and InDels
By using SAMtools and VarScan software, the qualified SNPs and InDels were called. The distributions of SNPs and InDels by chromosomes of each landrace are shown in Figures 1 and 2.


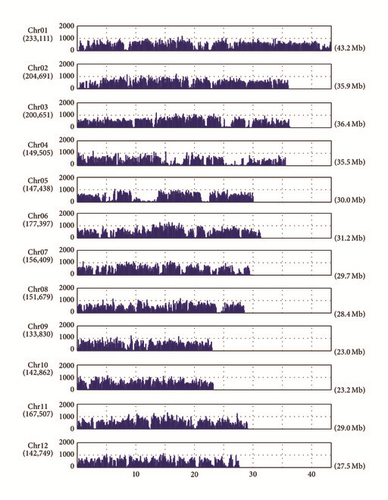
For the indica lines, the numbers of SNPs and InDels were approximately two million and three hundred thousand, respectively (Tables S5a–S5c). Accordingly, for the japonica lines, the numbers of SNPs and InDels were approximately seven hundred thousand and one hundred thousand, respectively (Tables S5d and S5e). For the indica lines, chromosomes 1 and 9 had the highest and lowest variation rates in terms of both SNP and InDel, respectively. However, there was an exception in indica 12, and the lowest InDel rate was on chromosome 10 instead of chromosome 9 (Tables S5a–S5c). For the japonica lines, the highest SNP rate was on chromosome 8, while the lowest SNP rate was on chromosomes 2 (japonica 11) and 3 (japonica 14). The highest and lowest InDel rates were on chromosomes 1 and 5, respectively, for both (Tables S5d and S5e).
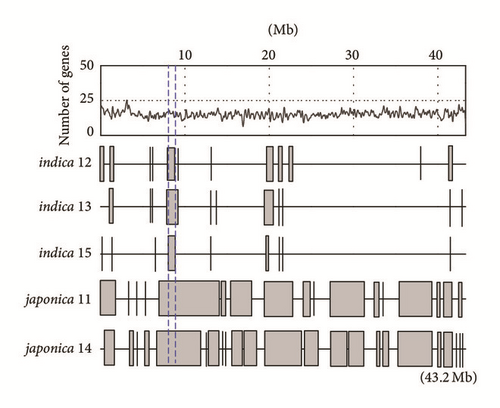
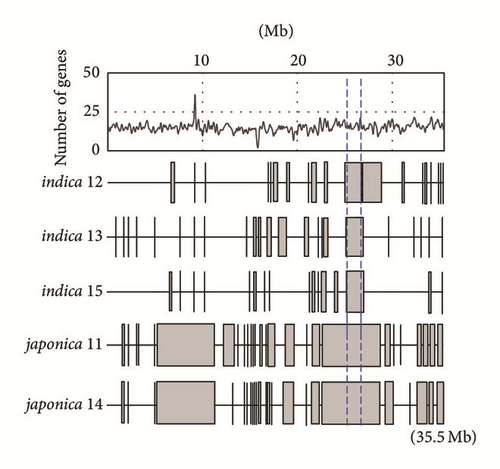
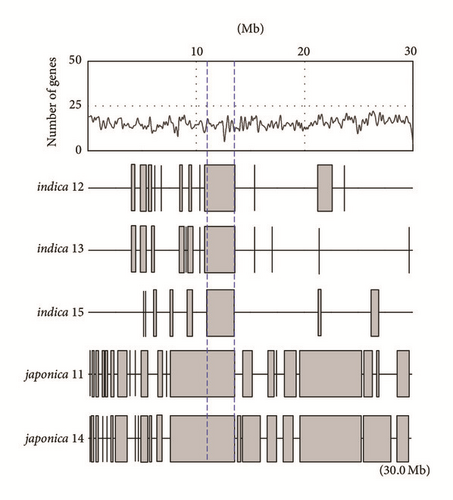
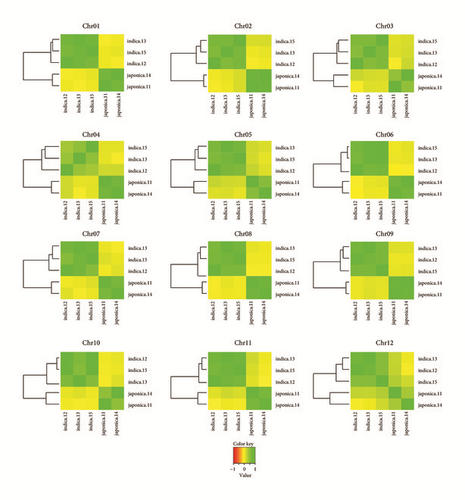
The distribution of DNA polymorphisms has been examined on each 100 kb nonoverlapping window to obtain average densities of SNP and InDels of chromosomes. The average densities of SNPs and InDels of indica landraces were about 2.5 times that of japonica landraces (Tables S5a–S5e). The average densities of deletions tended to be higher than those of insertions on all chromosomes (Tables S5a–S5e). Moreover, SNP deserts where the SNP densities were below 1 SNP/kb have been identified with differing sizes (100 kb to 6.7 Mb, average of 300 kb) and chromosomal locations. Of all landraces, there were three SNP deserts of larger sizes (2.6 MB, 0.8 MB, and 0.7 Mb) on chromosomes 5, 4, and 1, respectively (Figure 3). Moreover, within all five lines, there is a small SNP desert of 0.1 Mb located from position 12.4 to 12.5 Mb on chromosome 11 in which there are no genes found. We have used the SNP densities per 100 kb interval for reconstructing the relationships among the rice landraces. By calculating the Pearson correlation coefficient, the relationship between the rice lines was observed because the patterns grouped the rice landraces into two major subspecies, confirming the classification of landraces based on the chloroplast DNA presence/absence of a deletion in the Pst-12 fragment [19]. In detail, the landraces in the same subspecies had a positive correlation close to one, whereas there was no linear relationship between indica and japonica lines with the coefficients around zero (Figure 4).
3.3. Annotation of SNPs and InDels
SNPs and InDels were annotated against the GFF file of the Nipponbare reference genome using SnpEff. SNPs mostly occurred in the intergenic regions (approximately 68.0% for indica, 66.0% for japonica), respectively (Figure 5, Table 3). For SNPs within genic regions (approximately 32.0% for indica, 34.0% for japonica), SNPs occurred in introns and regulatory sequences (44.9% to 47.8% for indica, about 43.0% for japonica) and UTR regions (approximately 13.75% for indica and 12% for japonica).
| indica 12 | indica 13 | indica 15 | japonica 11 | japonica 14 | ||||||
|---|---|---|---|---|---|---|---|---|---|---|
| Intergenic | 1,374,419 | 68.45 | 1,329,647 | 69.46 | 1,527,754 | 68.16 | 488,888 | 66.10 | 454,811 | 65.83 |
| Genic | 633,408 | 31.55 | 584,505 | 30.54 | 713,664 | 31.84 | 250,766 | 33.90 | 236,104 | 34.17 |
| Intron & regulatory sequences | 288,375 | 45.53 | 279,350 | 47.79 | 320,956 | 44.97 | 109,191 | 43.54 | 101,187 | 42.86 |
| UTRs | 85,749 | 13.54 | 82,611 | 14.13 | 96,948 | 13.58 | 29,587 | 11.80 | 28,138 | 11.92 |
| CDS | 259,284 | 40.93 | 222,544 | 38.07 | 295,760 | 41.44 | 111,988 | 44.66 | 106,779 | 45.23 |
| Nonsynonymous | 151,998 | 58.62 | 131,754 | 59.20 | 172,767 | 58.41 | 66,645 | 59.51 | 63,962 | 59.90 |
| Synonymous | 107,286 | 41.38 | 90,790 | 40.80 | 122,993 | 41.59 | 45,343 | 40.49 | 42,817 | 40.10 |
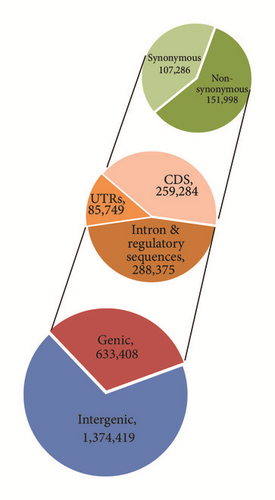
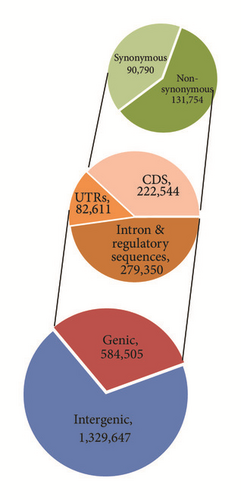
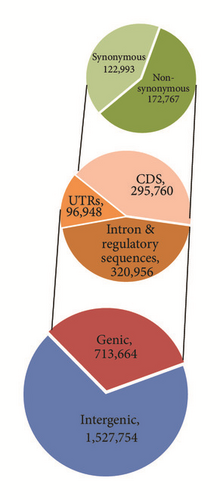
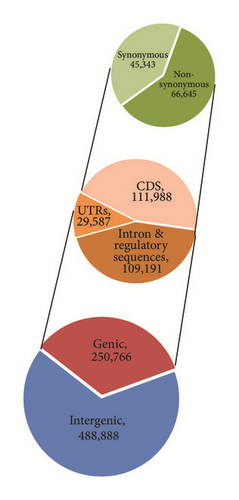
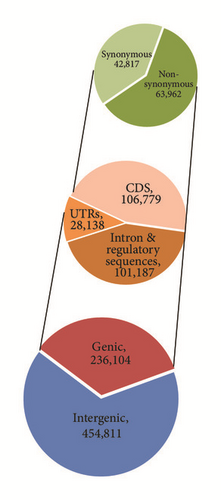
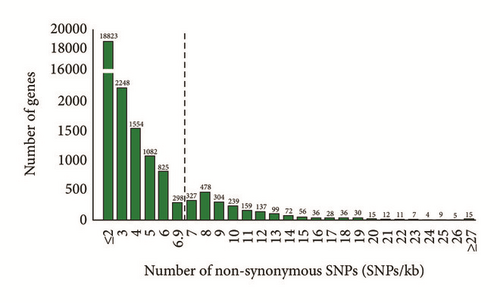
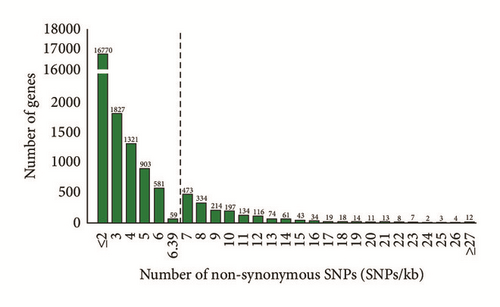
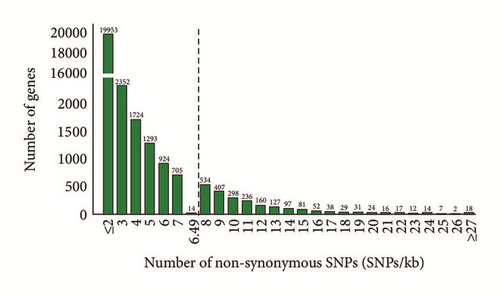
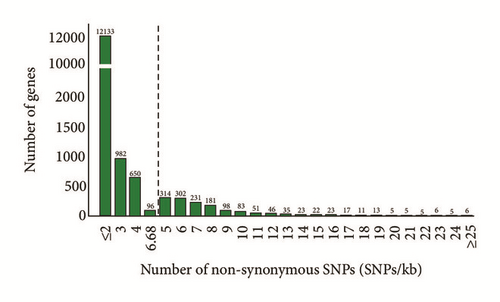
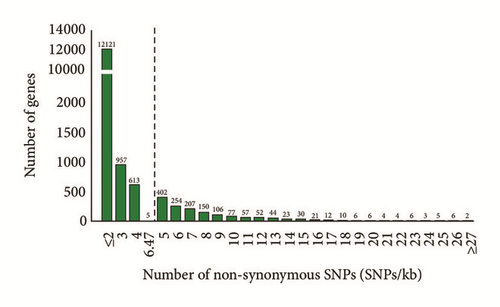
Among CDS regions, the split between nonsynonymous and synonymous SNPs was 58.75%, 41.25% for indica, and 59.7%, 40.3% for japonica (Figure 5, Table 3). Similarly, of the InDels, more than 73.0% were detected in intergenic regions. Most of the InDels within genic regions were within InDels or regulatory sequences (more than 62.0%), with 9.33% to 11.95% within coding sequences (Figure S2). The length of insertions ranged from one to 27 bp while the length of deletions detected was up to 41 bp. The majority of InDels were mononucleotide (≈55.5%) and dinucleotide (≈16.65%). In order to provide more insights into the effects of nonsynonymous SNPs on the genes, the distribution and skewness were calculated to identify outlier genes, which possess very high numbers of nonsynonymous SNPs as shown in Figure 6. According to the Nipponbare reference genome, nearly half of the 149 outlier genes were retrotransposon proteins (Table S6).
We have also observed that the number of transitional SNPs (A/G and C/T) was much higher than that of transversions (A/C, A/T, C/G, and G/T) for all of the five landraces with the ratios (Ts/Tv) ranging from 2.19 (japonica 14) to 2.37 (indica 12). Within transitions, the frequency of C/T was slightly higher than those of A/T and much larger than transversion SNPs (Table 4).
| Landraces | indica 12 | indica 13 | indica 15 | japonica 11 | japonica 14 |
|---|---|---|---|---|---|
| Transitions | |||||
| A/G | 705,908 | 671,815 | 787,002 | 255,473 | 236,847 |
| C/T | 707,496 | 672,959 | 787,976 | 255,542 | 237,620 |
| Transversions | |||||
| A/C | 155,310 | 149,265 | 174,014 | 59,111 | 55,410 |
| A/T | 182,882 | 176,243 | 205,343 | 70,949 | 68,165 |
| G/C | 101,541 | 95,523 | 113,736 | 39,460 | 37,120 |
| G/T | 154,639 | 148,304 | 173,286 | 59,011 | 55,639 |
| Ts/Tv | 2.378 | 2.362 | 2.364 | 2.236 | 2.193 |
4. Discussion
In this study, we have sequenced five Vietnamese rice genomes consisting of three indica and two japonica landraces. The sequence datasets were aligned to the Nipponbare reference genome to identify genetic variations. The genetic variation annotation and analysis provided novel insights into the specific Vietnamese rice landraces which should be a good resource for further molecular breeding in rice. We have analyzed the sequence datasets of two major groups of rice landraces, indica and japonica, through five elite landraces in Vietnam. This provides significant information as to the genetic diversity of the two types of rice lines in the domestication process. The results have further contributed additional evidence for the transfer of DNA regions in the organelle into the nucleus in the rice genome. Our study has also strengthened the classification of the relationship among the landraces. The detection of DNA polymorphisms can be used to identify novel genes that differentiated between our landraces and will serve as a reference for studies relating to specialty characteristics of Vietnamese rice landraces. These polymorphisms are also available for use in marker-assisted selection in rice breeding programs.
The whole genomes of five rice landraces have yielded high-quality reads, from 112 to 161 million reads per line. Most of the reads (≥86.33%) were successfully mapped to the Nipponbare reference genome with the breadth of coverage of more than 89.18%, proving that the selected rice genomes are similar to the reference. Interestingly, we found a small number of reads aligned with both chromosomes and organelle genomes including chloroplast and mitochondria. This phenomenon is known as “organellar insertion” in the nuclear genome, which has been previously reported by the International Rice Genome Sequencing Project [20]. The reads mapped to the mitochondria concentrated on chromosome 12 (1.0%), and the reads mapped to the chloroplast located on chromosome 10 (0.8%). Therefore, using NGS, these data are consistent with some previous reports and also reconfirmed that chromosomes 10 and 12 have had more insertions than the others [20].
The sequencing depth of approximately 30x has been sufficient for detecting DNA polymorphisms. Our results of variant calling of indica lines (1,914,152 to 2,241,418 SNPs, 268,400 to 303,039 InDels) are in agreement with the previous study reporting that the 93-11 indica possesses about 1.7 million SNPs and 480 thousand InDels [21]. However, the numbers of SNPs and InDels (about 714 thousand SNPs and 102 thousand InDels) of japonica lines were about five and three times those of Omachi line (132,462 SNPs and 35,766 InDels) but were similar to those of Moroberekan (827,448 SNPs and 159,597 InDels), a tropical japonica cultivar [12, 22]. The distinct difference between tropical and temperate japonica landraces has been reported by Arai-Kichise et al. [22]. Further validation is underway to obtain SNP markers for rice breeding selection.
SNP deserts, genome regions of SNP rate less than 1 SNP/kb, were identified in all 5 Vietnamese landraces with sizes varying from 100 kb to 6.7 MB. The japonica SNP deserts are longer than those of indica. Mostly, SNP deserts have been previously found on chromosome 5 [23, 24]; however, we have identified two additional SNP deserts within all five Vietnamese landraces with the size of 0.7 Mb on chromosome 1 and 0.8 Mb on chromosome 4. Cheng et al. [25] have reported that SNP deserts were in the vicinity of the centromere on chromosome 5 but far from the centromere on chromosomes 1 and 4. Therefore, the current results have supported the hypothesis that SNP-low regions have not been correlated with low recombination [26]. The common SNP deserts might include highly conserved regions among the five Vietnamese rice landraces. They could result from selective sweeps reducing the variants during human selection and rice domestication [27]. These SNP deserts are able to raise fascinating questions for future studies as to whether the persistence of chromosomal regions is random or special for the individual landrace.
The SNP distribution correlation analysis of the five landraces has demonstrated the distinct divergence between indica and japonica and disclosed the phylogenetic relationships among the landraces (Figure 4); thus, it is possible to be exploited for the verification of landrace classifications. The relationship among the rice landraces in the correlation of chromosomes could be utilized for the genetic linkage disequilibrium studies.
Additionally, the phenomenon “transition bias,” which means the ratios of transitions (Ts) and transversions (Tv) larger than 1 : 2, occurred among the five landraces. The transitional SNPs are more tolerated than transversional ones during mutation and natural selection because they are more likely synonymous in coding protein, resulting in conserving the protein structure [28]. Within transitions, a number of both A/G and C/T changes have been rather similar. Among transversions, the A/T transversions have been shown to be higher than others which was also reported in the genomes of citrus and rice [17, 28, 29].
In summary, by sequencing and aligning five Vietnamese rice genomes with the reference genome, Nipponbare, our results have disclosed interesting genetic information such as SNP and InDel distributions and effects and SNP deserts. Three “SNP desert” regions, which might result from selective sweeps in the domestication of rice landraces, were also observed in the different chromosomes. Furthermore, the SNP distribution analysis has revealed the phylogeny of indica and japonica with distinct classification. Further SNP validations need to be examined to identify accurate SNP markers for molecular breeding.
Competing Interests
The authors declare that they have no competing interests.
Authors’ Contributions
Hien Trinh and Khoa Truong Nguyen contributed equally to this work. Mario Caccamo, Cuong Nguyen, and Khuat Huu Trung contributed to the conception and design of the study. Sarah Ayling, Khoa Truong Nguyen, and Hien Trinh carried out the quality control of sequencing data and data analysis. Tran Dang Xuan, La Hoang Anh, Can Thu Huong, Nguyen Thuy Diep, Lam Van Nguyen, and Huy Quang Pham conceived the study and designed and performed the data analysis. Tran Dang Khanh, Hien Trinh, and Cuong Nguyen drafted and revised the manuscript. All authors contributed to the editing of the final version of the manuscript.
Acknowledgments
The authors would like to thank Hung Nguyen from MU Informatics Institute, University of Missouri, Columbia, MO 65211, USA, for his help in developing the homemade Python script to split 100 kb window sizes across the chromosomes. This work was supported by the Ministry of Science and Technology (MOST), Vietnam, and the Genome Analysis Centre (TGAC), Biotechnology and Biological Sciences Research Council (BBSRC), through a collaboration program between Vietnam and the UK. The authors are grateful to colleagues in this program that have made significant contributions to the collection, analysis, or interpretation of samples and results.


