Characterization of an Atmospheric-Pressure Argon Plasma Generated by 915 MHz Microwaves Using Optical Emission Spectroscopy
Abstract
The paper presents the investigations of an atmospheric-pressure argon plasma generated at 915 MHz microwaves using the optical emission spectroscopy (OES). The 915 MHz microwave plasma was inducted and sustained in a waveguide-supplied coaxial-line-based nozzleless microwave plasma source. The aim of presented investigations was to estimate parameters of the generated plasma, that is, excitation temperature of electrons Texc, temperature of plasma gas Tg, and concentration of electrons ne. Assuming that excited levels of argon atoms are in local thermodynamic equilibrium, Boltzmann method allowed in determining the Texc temperature in the range of 8100–11000 K. The temperature of plasma gas Tg was estimated by comparing the simulated spectra of the OH radical to the measured one in LIFBASE program. The obtained Tg temperature ranged in 1200–2800 K. Using a method based on Stark broadening of the Hβ line, the concentration of electrons ne was determined in the range from 1.4 × 10¹⁵ to 1.7 × 1015 cm−3, depending on the power absorbed by the microwave plasma.
1. Introduction
The atmospheric-pressure microwave plasma sources (MPSs) found many different physical and technical applications such as decomposition of gaseous pollutants [1–4], deposition thin layers in nanosensors [5, 6], medicine for bacteria inactivation [7], and production of hydrogen via conversion of hydrocarbons or other hydrogen carriers [8–12].
Since in process of the gas treatment by the plasma, the temperature of plasma gas and concentration of electrons play an important role; therefore, the knowledge of these basic parameters is crucial for understanding the chemical kinetics and its optimization.
In this work, an optical emission spectroscopy (OES) [13–17] method has been used for diagnosing the microwave argon plasma. The plasma was induced by microwaves at a frequency of 915 MHz in waveguide-supplied coaxial-line-based nozzleless MPS [1]. The presented device allows the generation of so-called cold plasma which is classified as a partial local thermodynamic equilibrium (PLTE) plasma [13, 14, 18–20].
2. Experiment
In Figure 1(a), a photo of the MPS is shown, whereas a draft of an experimental setup is presented in Figure 1(b). The MPS is supplied via a standard waveguide WR 975 and ended by a movable plunger which allows for an effective transfer of the microwave power from the electric field to the plasma.
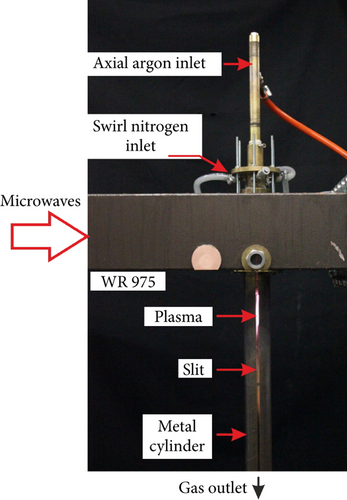
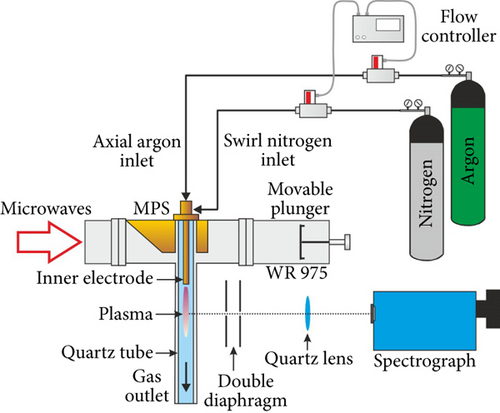
Inside the used MPS, a quartz tube is placed. In the tube, two gas flows are formed. The first one is the axial flow (processed gas), and the second one is the swirl flow (cooling gas). In the axial flow, the processed gas is introduced into the quartz tube through the inner electrode. In the swirl flow, the cooling gas is delivered into the MPS by four inlets located tangentially to the quartz tube wall [1]. This resulted in a vortex (swirl) flow inside the quartz tube. In this type of the MPS, plasma in a form of flame occurs inside the quartz tube at the tip of the inner electrode. The additional swirl flow stabilized the discharge in the center of the quartz tube and protects the quartz wall from overheating [1]. Below the MPS waveguide, the quartz tube is surrounded by a metal cylinder with a vertical slit for the observation of the generated discharge.
Symmetrical double convex quartz lens (50 mm in diameter, focal length 75 mm) was used to focus light emitted by the microwave plasma. Additionally to collimate the emitted light, two diaphragms with pinholes of 1 mm in diameter were placed. In these investigations, the spectrum of the microwave plasma was measured by McPherson model 209 spectrometer, equipped with double-pass scanning monochromator. The used spectrograph is equipped with sensitivity-calibrated iCCD camera and diffraction grating 1200 grooves/mm.
Using Hg I lines λ = 365.02 nm, 435.84 nm, and 546.07 nm emitted from low-pressure calibration Hg-Ne lamp, the instrumental line broadening ΔλI has been determined. The obtained values of ΔλI was about 0.07 nm.
3. Results
During the experiment, the nitrogen was used as a cooling gas with constant flow rate of 50 NL/min. The investigations were performed with argon as processed gas with flow rate equal to 50 NL/min. The power absorbed by the microwave plasma PA was calculated as a difference between power incident PI and power reflected PR in the MPS [1]. The PI and PR were directly measured using a directional coupler. In these investigations, the power PA was changed from 2 to 4 kW.
The spectra were recorded 15 mm below the tip of the inner electrode. In our measurements, we focused on the range of emission spectra from 300–600 nm. An example of the recorded spectra is shown in Figure 2. To detect emission spectral lines of the H or the OH radicals, a small addition of H2O vapour (H2O—0.1 kg/h, H2O vapour temperature was equal to 400°C) was added to the process gas flow.
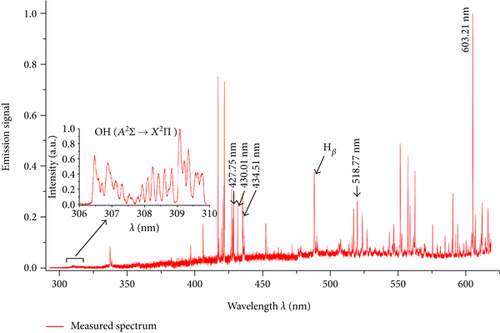
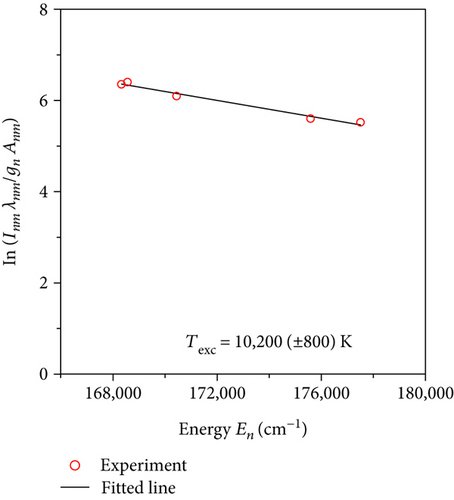
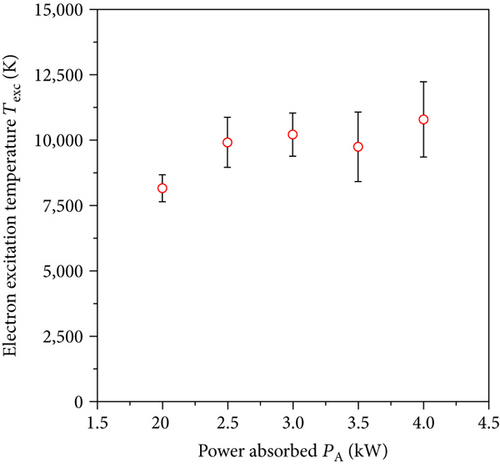
In performed investigations, we assumed that microwave plasma at atmospheric pressure is generally in partial local thermodynamic equilibrium [13, 14, 18–20]. This assumption allowed us to use the Boltzmann plot method to determine the Texc [14, 15]. Five transition lines of argon (see Figure 2) were selected to determine the Texc. Selected argon lines with the parameters for the Boltzmann plot method were presented in Table 1. An example of Boltzmann plot is shown in Figure 3. Conformity of a straight line with experimental points indicates balance in the excited states of argon atoms. The obtained Texc was in the range of 8100–11000 K, as shown in Figure 4. The estimated Texc temperature increased with increasing the absorbed microwave power PA.
| l.p. | λnm (nm) | Transition | Anm (107 s−1) | gn | En (cm−1) |
|---|---|---|---|---|---|
| 1 | 427.75 | 5p → 4s | 0.0797 | 3 | 117,151 |
| 2 | 430.01 | 0.0377 | 5 | 116,999 | |
| 3 | 434.51 | 0.0297 | 5 | 118,407 | |
| 4 | 518.77 | 5d → 4p | 0.1380 | 5 | 123,372 |
| 5 | 603.21 | 0.1400 | 9 | 122,036 |
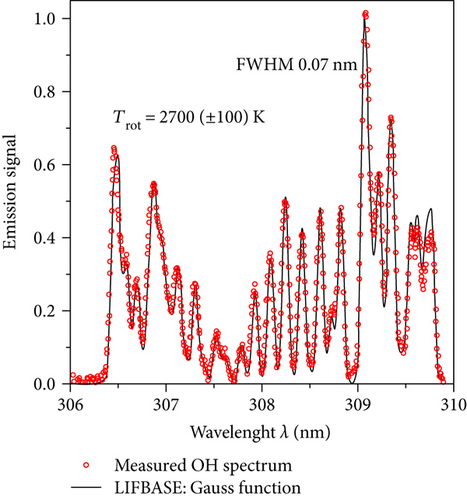
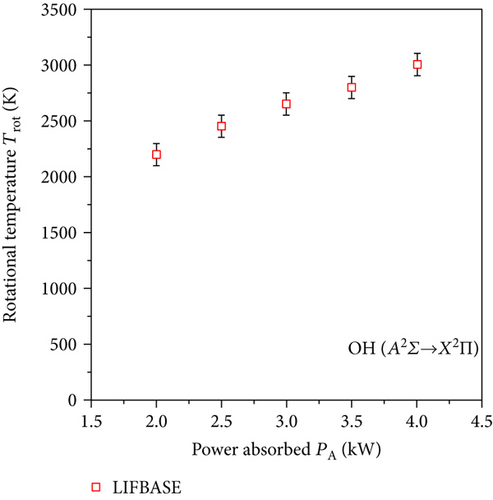
It is widely accepted that in the microwave discharges, the rotational temperature of the OH radical Trot corresponds to the translational temperature of heavy particles in the plasma (temperature of plasma gas Tg) [16, 17]. To obtain the molecule rotational temperature, the OH band A2Σ+ → X2Π was used. This band is very sensitive against the changes of the rotational temperature [16]. After measuring the OH spectrum, we simulated this band in the LIFBASE program [21]. This program allows calculating the emitted spectrum of plasma radiation of various gases at individually given rotational and vibrational temperatures. In this program, the simulated OH band was fitted to the experimental one (Figure 5). A good agreement has been found. Spectrum simulations were performed for Gaussian line shapes with a FWHM value equal to 0.07 nm. The obtained gas temperature Tg ranged from 1200 to 2800 K (Figure 6).
By using the method based on Stark broadening of the hydrogen Hβ line, the concentrations of electrons ne in the plasma were determined [13–15, 17]. The introduction of water vapour caused the emergence of emission lines of hydrogen Hβ, Hδ, and Hγ. In our work, we focus only on the Hβ (486.13 nm) line. The Hδ and Hγ lines were hardly noticeable or partially overlapped by the argon lines. Therefore, these two lines were not used to determine the concentration of electrons ne.
The shape of the recorded Hβ line is affected by several different mechanisms of broadening (instrumental ΔλI, Van der Waals ΔλW, Stark ΔλS, resonance ΔλR, Doppler ΔλD, and natural ΔλN) which result to a Voigt profile [13–15]. In order to obtain the FWHM of Hβ line in investigations to the measured profile, the Voigt function was fitted. The fitting was performed using the Origin software [22].
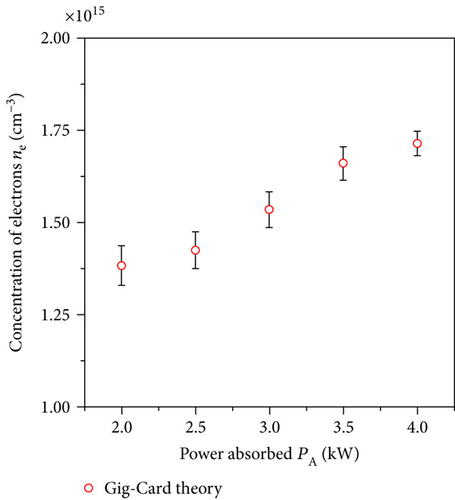
Taking into account the estimated values of ΔλI, ΔλD, and ΔλW and obtained value FWHM of Hβ line, the Stark broadening ΔλS was calculated [15, 23]. In the experiment, we observed a linear relationship between the estimated value of Stark broadening ΔλS of Hβ line and the absorbed microwave power PA by the plasma. In calculation of the ne, a Gig-Card theory [24] was used. The measured concentration of electrons ne ranged from 1.4 × 10¹⁵ to 1.7 × 1015 cm−3 (Figure 7). The values of the electron concentration indicate that the balance between electrons and heavy particles as a result of collisions cannot be achieved. Thus, the plasma cannot be described by a single temperature.
Adopting a classical ideal gas model and using the measured concentration of electrons, we estimated that the ionization degree in plasma was about ~10−4. This indicates that ionization degree is too low to thermalize the electron energy distribution function. Therefore, there may be a lack of balance between the basic state and the excited states of argon atoms in plasma. This cause that the measured temperatures could be overestimated. In measurements, we record the radiation from the excited states, which are the result of collisions, while the basic states remain neutral.
4. Conclusions
The investigations of an atmospheric-pressure argon plasma generated at 915 MHz microwaves using optical emission spectroscopy (OES) are presented in this work. These investigations yielded the excitation temperature of electrons Texc, the gas temperature Tg, and the concentration of electrons ne in the generated argon plasma. In the tested range of the absorbed microwave power PA by the plasma, we observed an increase in the excitation temperature Texc, the gas temperature Tg, and the concentration of electrons ne. These results indicate that appropriate selection of the gases and the operating parameters of the MPS (central and the additional flow rate, absorbed microwave power) enables in obtaining the plasma with desired parameters. It should also be mentioned that the investigated MPS works very stable with various processing gases (argon, nitrogen, air, and carbon dioxide) at high flow rates and absorbed microwave power by the plasma can be changed in a wide range. Thus, the above properties make the presented MPS an attractive tool for different gas processing at high flow rates.
Conflicts of Interest
The authors declare that they have no conflicts of interest.
Acknowledgments
The authors are grateful to the National Science Centre (Program no. 2013/11/N/ST8/00802) and the Foundation for Polish Science (FNP Program START no. 53.2017) for the financial support of this work.


