Ion Diffusion Behavior between Fracturing Water and Shale and Its Potential Influence on Production
Abstract
Water imbibition, conductivity measurements, and ion identification were performed to investigate ion diffusion behavior between slick water and shale for large-scale hydraulic fracturing. The results indicated that there was strong ion exchange between water and shale. The ion concentration in water increases with fracture complexity and is dependent on the salinity of fracturing fluids. This implies that fracturing effects could be forecast from flow-back fluid ion concentrations after large-scale slick water fracturing. Higher levels of ion diffusion imply the presence of larger fracturing areas and higher level of fracture density for a similar reservoir. The mechanism of ion diffusion and the corresponding effects on IOR (increased oil recovery) based on a field example are discussed.
1. Introduction
The increasing demand for energy has prompted a need to find economical ways of developing unconventional resources, such as shale gas, globally. Shale oil and gas reservoirs are of relatively low permeability and porosity, and most hydrocarbons are stored in their tight matrixes [1, 2]. Large-scale hydraulic fracturing serves as an effective means of exploiting shale formation. In view of the performance of shale hydraulic fracturing methods, a large amount of fracturing fluid (generally more than 30%) is retained in shale formations after flow back [3]. The interaction between water and shale plays an important role in large-scale hydraulic fracturing [4–6]. Water has an enormous influence on the mechanical behaviors [7], effective flow channels [8], flow-back methods [9], and gas production patterns [10] of unconventional reservoirs. Fracturing fluids imbibition process and way in which slick water enters formations have received considerable attention [11, 12]. High capillary forces are recognized as a major force because there are abundance nanopores and always ultralow initial water saturation in shale [13, 14]. Series experiments have been conducted to investigate related physical processes [15–18]. Fractal theory has been used in interaction studies and gas proving that ultracomplex microstructures render interactions between fracturing fluids and shale matrixes much more complex than those of conventional reservoirs [19, 20].
The chemical action between slick water and shale has recently attracted attentions. Osmotic pressure is recognized as an important driving force for water imbibition and shale oil production [21]. The abundant content of clay minerals serves as foundation for clay-chemical effects. Recently, a model considering osmotic effects has shown that chemical actions play a key role in interactions between slick water and shale [22]. Typically, salinity control is one important way to enhance oil recovery based on the oilfield chemistry [23, 24]. However, the impacts of fracturing fluid salinity on IOR (increasing oil recovery) have not received enough attention. Ion exchange between slick water and shale must be investigated to understand the chemical processes involved.
In this study, we conducted water imbibition, conductivity measurement, and ion identification experiments to examine patterns of the ion exchange between slick water and shale. Slick water is here defined as the main fracturing fluid for shale oil and gas development [25, 26], and the main component is water, the percentage of which always exceeds 98%. The aim of this study was to determine ion diffusion performance between shale and slick water in Longmaxi Shale in China. The effects of fractures in rock, slick water with different salinity, and different clay content are considered. Related mechanisms and potential applications are discussed based on actual field studies conducted in a shale gas field of southern China.
2. Experiment
2.1. Sample Description and Preparation
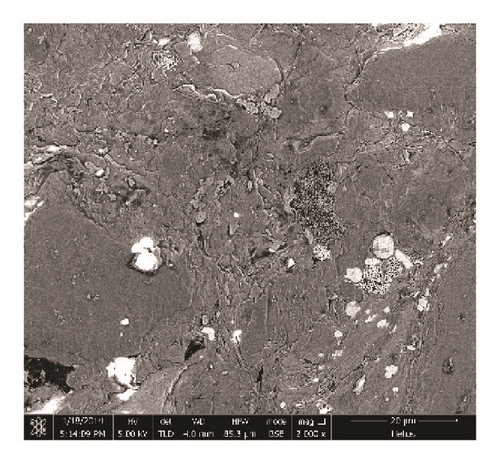
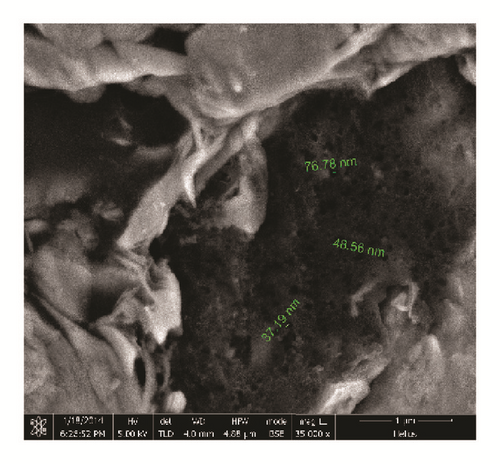
Shale samples in this study are from the Longmaxi Shale Formation of Lower Silurian in the Sichuan Basin of China. The samples were cut from one large outcrop, the size of which is approximately 80 cm × 80 cm × 80 cm. The shale sample is composed of a relatively high proportion of quartz. Clay mineral type and content were tested by X-ray diffraction (XRD) using an Empyrean diffractometer provided by a third test company. Corresponding results are shown in Table 1. Backscattered electron images were obtained for the thin slices of the shale samples using NanoLab 650 (FEI, USA), a highly accurate Scanning Electron Microscope (SEM) stationed at China University of Petroleum, Beijing. According to XRD results, quartz and clay minerals are the most abundant minerals in the shale samples as confirmed by Figure 1. The main clay minerals found are illite and chlorite. A small amount of smectite is found in interlayers, denoting the presence of few swelling clay minerals.
| Sample | Shale |
|---|---|
| Calcite | 6 |
| Quartz | 44 |
| Dolomite | 3 |
| Pyrite | 3 |
| Feldspar | 2 |
| Illite | 23 |
| Chlorite | 12 |
| Illite/smectite | 7 |
The porosity of the shale samples ranges from 6% to 8%. Porosity was measured using a helium porosimeter developed by Core lab. The permeability of the shale samples ranges from 4 × 10⁻⁴ mD to 7 × 10⁻⁴ mD as measured from an ultralow permeability measurement instrument (YRD-CP200 type). The permeability was measured as pulse-decay permeability with a confining pressure 8 MPa and pore pressure 5 MPa. The rocks exhibit a bimodal pore-size distribution of both micropores and nanopores that vary in size from 30 μm to 60 μm and from 1.7 nm to 20 nm, respectively [27].
Figure 1 shows shale backscattered electron images. The main components are quartz and clay. The image shows well-developed pores in organic matter, a major characteristic of Longmaxi Shale. Direct measurements of pore sizes within the organic matter show pore sizes of the nanoscale.
2.2. Experimental Procedures
The experiment equipment mainly includes a conductivity meter, burette, and balance. Water electrical conductivity was measured based on a multifunctional conductivity measurement produced by METTLER-TOLEDO (Type: SevenExcellence S700). The electrode used is a normal solution conductivity electrode with a precision of 0.1 mS/cm–2000 mS/cm (±0.5%) and a suitable temperature of −30°C to 130°C. The chemical agent used included silver nitrate solution, K2CrO4 indicator, hydrochloric acid, phenolphthalein, methyl orange, EDTA standard solution, NaOH standard solution, calconcarboxylic acid, and ammonium hydroxide.
- (1)
Measure the sample weight and place the sample into different liquids.
- (2)
Measure the conductivity of the liquid with time.
- (3)
Use the titrimetric method to measure the ion content.
- (4)
Measure the final sample weight after water imbibition.
To investigate the interaction between water and shale, we used three different schemes to investigate different factors influencing ion diffusion such as contact area, liquid salinity, and fracture density. The samples described blow were collected from one outcrop of the Longmaxi formation, the properties of which are discussed in Section 2.1.
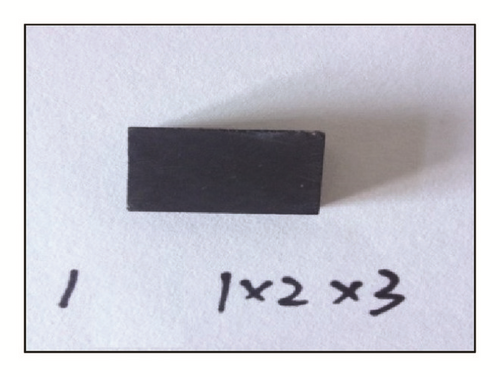
Case 1. Samples of the same size (1 cm × 2 cm × 3 cm) are placed in distilled water, in low salinity water and in high salinity water. We conduct a test following the measure steps listed above.
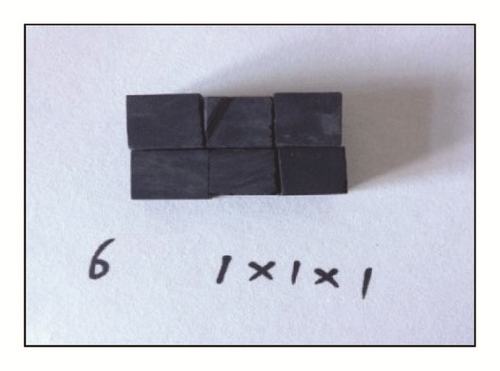
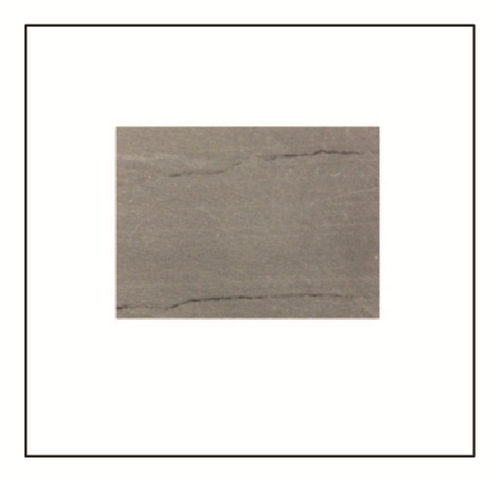
Case 2. We obtain samples from one large sample. The curved samples are of two sizes: 1 cm × 1 cm × 1 cm and 1 cm × 2 cm × 3 cm. Rock volumes are the same between 6 samples of the former size and 1 sample of the latter size. However, the six small samples include three fractures (Figure 2). In a similar fashion, 12 small samples, 18 small samples, and the corresponding same-sized large sample are, respectively, tested on as well.
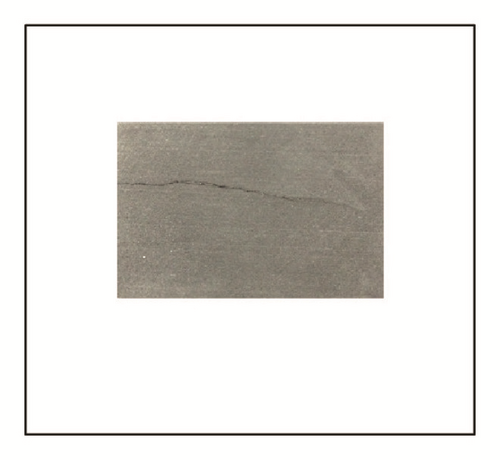
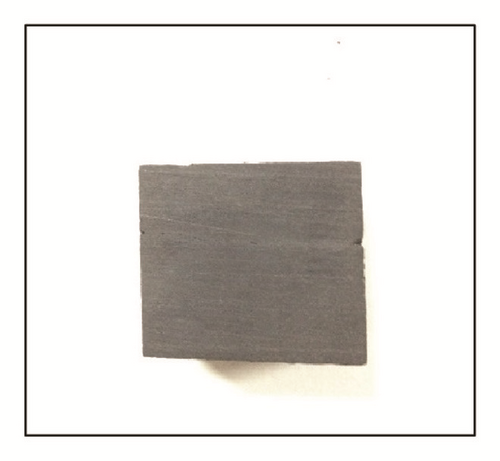
Case 3. We obtain three samples from one large sample. The first includes two pronounced fractures. The second has one smaller fracture and its sample volume is the same as that of the former. The third has one fracture as well and differs from the second in that its volume is slightly smaller than the second (Figure 3).
3. Results
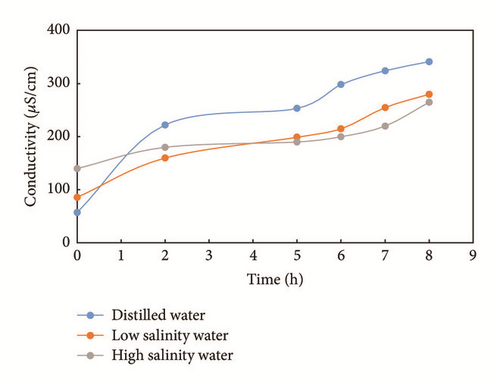
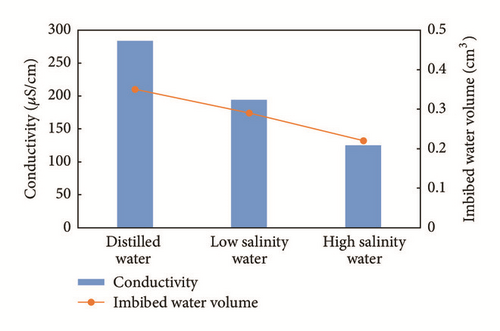
The conductivity change found for similar shale samples in the different solutions is shown in Figure 4. The conductivity increased with time as we placed the samples into the liquids. The conductivity of distilled water and of low salinity slick water increased significantly. However, the conductivity of high salinity slick water increased only slightly. Conductivity changes for distilled water, low salinity water, and high salinity water are 284 μS/cm, 194 μS/cm, and 125 μS/cm after 8 hours, respectively.
The final conductivity changes and imbibed water volume observed are shown in Figure 5. The imbibed water volumes for distilled water, low salinity water, and high salinity water are 0.35 cm3, 0.29 cm3, and 0.22 cm3 after 8 hours, respectively. We can see that ions have a considerable effect on water imbibition patterns, as the shale samples are separated by one larger sample. Clearly, the imbibed water volume is proportional to the conductivity change, proving the existence of chemical action between water and shale. Stronger osmotic effects between the sample and water were achieved under higher levels of salinity difference. Osmotic effects increasing the water intake capacities of shale and ion concentrations serve as evidence of this process.
Conductivity changes for the different samples are shown in Figure 6. First, the conductivity of the same sample(s) increased significantly early on and rates declined with time. Second, the conductivity curve of the three samples shows that the larger sample exhibits a higher level of conductivity for one specific time. Third, the conductivity of the samples simulating fracturing is much greater than that of the whole sample, though the whole volume is the same, indicating that the fracturing considerably influences the interaction between fracturing fluids and shale. For example, the conductivity of 6 samples (1 cm × 1 cm × 1 cm) is greater than that of one sample (1 cm × 2 cm × 3 cm). Additionally, conductivity levels increased with sample values.
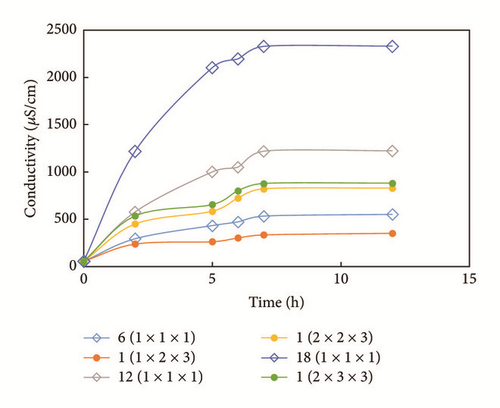
Figure 7 shows ion content levels for the different conditions. The main ions shown here are Cl− and total cations. Cl− is set as an evaluation object because it is easy to test in the field. We find that ion content levels increase with the number of samples involved and such changes corresponded to changes in conductivity. Cl− content levels are recorded as 201.45 mg/L, 403.2 mg/L, and 723.15 mg/L for 6 samples, 12 samples, and 18 samples, respectively. Total cation contents levels are recorded as 133.45 mg/L, 250.45 mg/L, and 514.03 mg/L, respectively.
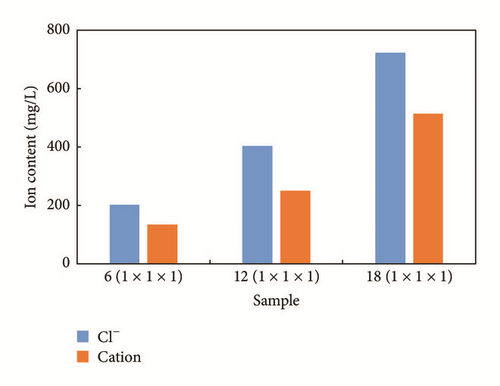
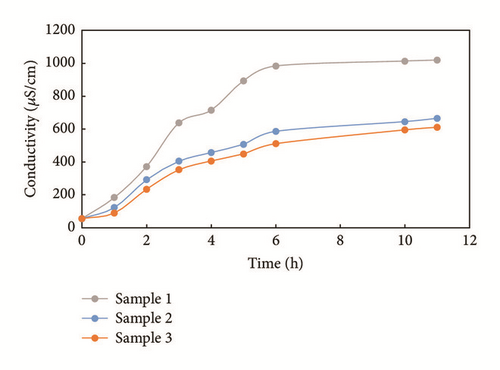
Figure 8 shows the change in conductivity for three samples cut from one large sample. The trend of conductivity change observed is the same as that observed for the other samples. The one with more fractures is more conductive than the other two, showing that natural fractures play a significant role in water imbibition. Here, sample 2 and sample 3 present minor differences. The conductivity levels of the three samples are recorded as 1,020 μS/cm, 666 μS/cm, and 612 μS/cm after 11 hours for example 1, example 2, and example 3, respectively.
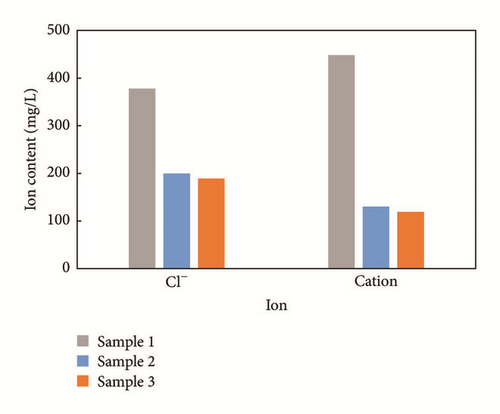
Corresponding ion concentrations shown in Figure 9 exhibit the same conductivity trends. Cl− concentrations are recorded as 378.2 mg/L, 199.73 mg/L, and 188.91 mg/L for sample 1, sample 2, and sample 3, respectively. Ion concentrations of sample 1 are much higher than those of sample 2 and sample 3. It is evident that the difference between sample 2 and sample 3 is minor as well, as these samples are similar in terms of fracture complexity and volume.
4. Discussion
Conductivity is defined as the physical quantity representing the ability to conduct electricity from an electrolyte. In most cases, the conductivity value reflects TDS (total dissolved solids) in a solution. Conductivity is traditionally used to measure ion concentrations in industrial solutions. Thus, ion exchange is the main mechanism that operates in the interaction between the slickwater and formation rock. Changes in conductivity in fluids serve as an indication of ion concentration change.
In large-scale hydraulic fracturing formations, ions from formations are derived from two main sources: ions captured by clay minerals and ions in formation water. When fluids come into contact with a formation after hydraulic fracturing, ion exchange occurs between fluids and the formation. The driving force of ion exchange is mainly concentration diffusion resulting from concentration differences between formation fluids and fracturing fluids and from ion exchange controlled by clay minerals. The second driving force is dependent on ion exchange properties of clay minerals. Clay minerals adsorb some cations and anions and these ions remain exchangeable. Generally, exchangeable cation includes Ca2+, Mg2+, H+, K+, (NH4)+, and Na+ and exchangeable anions include (SO4)2−, Cl−, and (NO3)−.
According to our experiments and to ion diffusion theory, ion diffusion between slick water and shale formations is characterized as follows.
(1) Salinity differences between formations and slick water serve as the main driving force for ion diffusion.
The samples we used in the experiments were drawn from the Longmaxi formation in southern China. The formation is composed of typical marine deposit shale. The surrounding deposit environment affords the formation of high salinity relative to the continental shale. The salinity of fracturing fluids is typically lower than that of a formation to decrease liquid friction and to thus improve the penetrability and volume fracturing. Water in the formation is highly saline and clay minerals adsorb more ion. This salinity difference serves as the driving force to ion diffusion. Figure 3 shows that as the difference in salinity levels increases, ion diffusion processes become more pronounced. Furthermore, ion diffusion is always accompanied by water adsorption, whereby higher salinity differences lead to higher amounts of water volume imbibed for Case 1.
(2) The higher cation exchange capacity (CEC) of shale serves as a key driving force for fracturing fluids imbibition and ion exchange.
Shale formations typically include more clay minerals than regular sandstone reservoirs. Clay content levels of Longmaxi Shale in the oriented shale gas field amount to approximately 40%. The CEC value increases with increases in clay content and especially as smectite and ion exchange potential levels increase. Water is imbibed into the interlayers of clay minerals, accelerating ion diffusion.
(3) Contact areas and fracture complexity are critical factors that influence the ion diffusion in a specific environment.
Salinity and clay content and time patterns are stable in a specific reservoir. When slick water is pumped into a reservoir, the interaction between slick water and formations is mainly controlled by the contact area, which is supported by Figures 5 and 6. Large-scale slick water fracturing generates higher levels of volume fractures. Higher levels of fracture density adds the contact areas between water and rock (Figures 5 and 7). In turn, ion diffusion is more pronounced at contact areas and fracture complexity levels in turn increase. During and after fracturing, ion diffusion occurs through interactions between fracturing fluids and formation rock and this effect is reflected at the ion concentrations in flow-back fluids.
According to our previous study, ion concentrations in flow-back fluids are central to evaluating fracturing complexities after hydraulic fracturing. We use two shale gas wells in China as a case to explain the relationship between ion concentration and productivity after hydraulic fracturing. Platform-H is a development platform in southern China. The development formation is Longmaxi Shale. The depth of high-quality shale of the platform is around 3530 m and the thickness of the formation is between 50.6 m and 53.7 m. Reservoir pressure gradient is about 1.96, which indicates a high level of reservoir pressure. The total organic content (TOC) of the formation is 4.90%~6.28% according to well log interpretations. Gas content levels in the shale, as tested by geochemistry logging, range from 5.59~7.43 m3/t. Porosity is approximately 7.34%. There are two horizontal wells in this platform, and we refer to them as H-1 and H-2. The horizontal section of H-1 is 1,450 m, where the ratio of high-quality shale is 98.28%. Staged slick water fracturing is performed in the H-1 well, its stage number is 22, and its cluster number is 64. Volumes of fracturing fluid and proppants used amount to 41,340 m3 and 1,660 m3, respectively. The horizontal section of the H-2 well is 1,415 m, where the ratio of high-quality shale is 100%. Staged slick water fracturing is performed in the H-2 well. Its stage number is 22 and its cluster number is 65. Volumes of fracturing fluid and proppants used amount to 38,510 m3 and 1,739 m3, respectively. The above data show that the same drilling and fracturing techniques are applied to these two wells in the same platform. Fracturing methods and scales used are the same for the two wells. Figures 10 and 11 show the daily production levels and Cl− content of flow-back fluids.
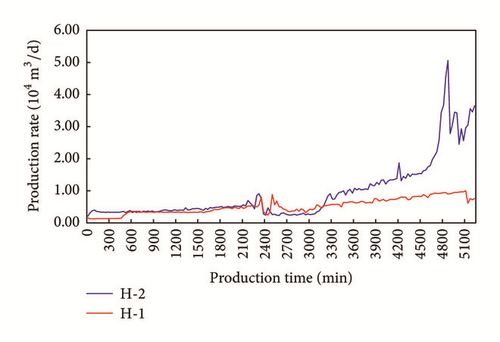
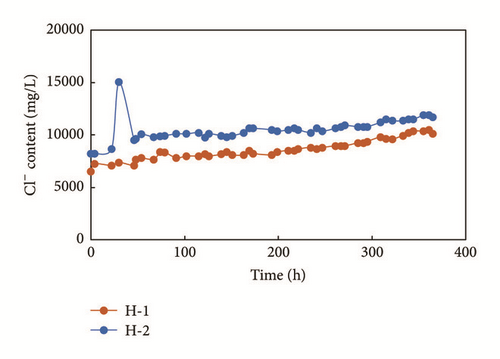
Figure 10 shows that the production rates of the two wells become more similar early on at approximately 0.5 × 10⁴ m3/d. The production rate of H-2 is much larger than that of H-1 after 50 hours. The production rate of H-2 is approximately three times that of H-1, showing that the two wells have significantly different hydraulic fracturing effect. Figure 11 shows the Cl− content of flow-back fluid after fracturing retrieved through field ion concentration detection, which is used after fracturing and which is easy to apply. The results show that Cl− content levels for the wells vary. The Cl− content of H-2 is approximately 20% greater than that of H-1. As the salinity of the formation and salinity of corresponding fracturing fluids are the same for the two wells, the Cl− content level found corresponds to the contact area between fracturing fluids and the formation, showing that the fracture system induced by hydraulic fracturing in H-2 may be more complex than that induced in H-1. This field sample and our experiments show that the ion concentrations serve as an important auxiliary tool for evaluating the hydraulic fracturing effects.
5. Conclusion
Conductivity is a reflection of ion concentration change, which can be used to investigate interactions between fluids and rock. Ion concentrations in flow-back fluids are critical for evaluating fracturing complexity levels after hydraulic fracturing. Ion exchange between water and shale is controlled by water salinity, contact areas, and fracture density. Our field study shows that ion concentrations serve as an auxiliary tool method for estimating fracture complexity after hydraulic fracturing for shale gas wells in marine shale formations. The high salinity of marine shale brings about significant levels of ion exchange between formations and fracturing fluid. Ion concentrations can be used to determine the contact area between fracturing fluids and formations. Fracture systems are more complex when ion concentrations of flow-back rates are higher under similar conditions.
Conflicts of Interest
The authors declare no conflicts of interest.
Authors’ Contributions
Each author made a contribution to the present paper. Yinghao Shen and Hongkui Ge developed the research questions. Zhaopeng Zhu collected the field data. Zhihui Yang conducted the experiments.
Acknowledgments
This work was supported by the National Natural Science Foundation of China (Grants 51604287 and 51490652) and Science Foundation of China University of Petroleum-Beijing at Karamay (no. RCYJ2016B-01-001).


