Effects of Radix Astragali and Its Split Components on Gene Expression Profiles Related to Water Metabolism in Rats with the Dampness Stagnancy due to Spleen Deficiency Syndrome
Abstract
Radix Astragali (RA) with slight sweet and warm property is a significant “qi tonifying” herb; it is indicated for the syndrome of dampness stagnancy due to spleen deficiency (DSSD). The purpose of this research was to explore effects of RA and its split components on gene expression profiles related to water metabolism in rats with the DSSD syndrome for identifying components representing property and flavor of RA. The results indicated that RA and its split components, especially polysaccharides component, significantly increased the body weight and the urine volume and decreased the water load index of model rats. Our data also indicated differentially expressed genes (DEGs) related to water metabolism involved secretion, ion transport, water homeostasis, regulation of body fluid levels, and water channel activity; the expression of AQP1, AQP3, AQP4, AQP5, AQP6, and AQP8 was improved; calcium, cAMP, MAPK, PPAR, AMPK, and PI3K-Akt signaling pathway may be related to water metabolism. In general, results indicate that RA and its split components could promote water metabolism in rats with the DSSD syndrome via regulating the expression of AQPs, which reflected sweet-warm properties of RA. Effects of the polysaccharides component are better than others.
1. Introduction
In traditional Chinese medicine (TCM), Chinese herbal medicines have four properties and five flavors, and various properties and flavors of herbs exert different effects. The action of a herbal medicine is always not one but many [1]. The property and flavor theory is a guideline for using the herbal medicines. The property of a Chinese medicinal herb affects material and energy metabolism. In addition, the material basis of the property and flavor of a herbal medicine can be split [2]. So far, however, there has been little scientific connotation of this theory based on the research, and we could not clearly explain its mechanism of property and flavor with modern medical theory. In this study, we tried to explore split components representing property and flavor of RA through studying effects of RA and its split components on gene expression profiles related to water metabolism in rats with the DSSD syndrome based on the property and flavor theory.
RA with slightly sweet flavor and warm property, known as Huang Qi in China, is one of the important “qi tonifying” or adaptogenic herbs. It possesses tonic, diuretic, and hepatoprotective properties and has been shown to exhibit immunomodulating, antioxidant, and antihyperglycemic effects [3–5]. The main components of RA include flavonoids, saponins, polysaccharides, amino acids, and some trance elements [4]. The China Pharmacopoeia recorded that RA affects the spleen and lung meridians and has the function of tonifying spleen qi [6]. It is indicated for symptoms of spleen qi deficiency such as fatigue, diarrhea, anemia, and loss of appetite [5].
Spleen governs dampness in the TCM theory. Spleen is the hub of water metabolism [7]. Water and cereal essence were digested, absorbed, and transported with the action of spleen qi. TCM holds the truth that the fat food, overfatigue, excessive thinking, and innate weakness of the body for a long time are the main causes of spleen qi deficiency. It has been confirmed that spleen qi deficiency will result in stagnancy of water and dampness [8, 9]. This is the pathogenesis of the DSSD syndrome. The clinical manifestations of DSSD include poor appetite, a bitter taste in the mouth, thick and slimy tongue, abdominal fullness, a feeling of discomfort, dizziness, weak or fatigued limbs, and frequently edema. Therefore, tonifying spleen qi and promoting diuresis are the main method for treating the DSSD syndrome. The DSSD syndrome is very common. Many chronic diseases such as obesity, ulcerative colitis, diabetes, and tumors may be accompanied with the DSSD syndrome, which will make disease recurrent and persistent [10–12]. However, there is no notion about the DSSD syndrome in modern medicine and there are no good treatments.
The effects of Chinese medicinal herbs on the syndrome involve multiple channels and targets because they contain complicated ingredients. The gene chip technology has a characteristic of high throughput, which can be used to analyze the complexity of herbs [13–16]. Therefore, in this study, we extracted the components of RA and observed effects of single components on water metabolism in rats with the DSSD syndrome to explore the mechanism and identify the bioactive components representing sweet-warm properties of RA using pharmacological experiment and gene chip technology.
2. Materials and Methods
2.1. Materials
RA (number 130107), the dried root of Astragalus membranaceus (Fisch.) Bge. var. mongholicus (Bge.) Hsiao, was purchased from Gansu province of China. Rat Gene Expression Microarray (8 × 60K, design ID: 028279), Gene Expression Hybridization Kit, the Quick Amp Labeling Kit, One-Color, Gene Chip Hybridization Oven, and Microarray Scanner were provided by Agilent Technologies Co., Ltd. (Shanghai, China); mirVana™ RNA Isolation Kit and 7500 Fast Dx Real-Time PCR Instrument were obtained from Applied Biosystems (Foster City, CA, USA); RNeasy Mini Kit was obtained from Qiagen Co., Ltd. (Hilden, Germany).
2.2. Animal
Fifty-six specific-pathogen-free (SPF), 4-week-old Wistar rats (half male and half female), weighing 150 ± 10 g, were purchased from Beijing Vital River Laboratory Animal Technology Co. Ltd. (Beijing, China). The animal certification number was SCXK (Jing) 2012-0001.
2.3. Animal Model
Rats were acclimated for 3 days in our animal facility and then randomly divided into 7 groups, a normal control group, a model group, a water decoction group, a flavonoids group, a saponins group, a polysaccharides group, and a residual aqueous solution group, with 8 rats in each group. Model rats with DSSD were induced according to the relevant reference [17]. Rats of the model group and the drug group were fed a special high-fat and low-protein diet improved from the AIN-76A purified rat diet and subjected to exhaustive swimming with tail load (10% of the body weight) every afternoon for 6 weeks. Rats were considered to be exhausted when their nose tip was submerged in water for 10 s. Rats of the normal control group were fed AIN-76A purified rat diet and distilled water.
2.4. Preparation of RA and Its Split Components
2.4.1. Extracts of RA and Its Split Components
RA was decocted and concentrated to 0.54 g (crude drug)/mL. RA was treated through water boiling and precipitation with ethanol. The precipitate was polysaccharides. The supernatant was extracted by ethyl acetate and n-butyl alcohol. Flavonoids and saponins were obtained, respectively. Flavonoids contained calycosin glycosides, 4.88 mg·g−1, ononin, 3.80 mg·g−1, calycosin, 7.78 mg·g−1, and formononetin, 4.79 mg·g−1. Saponins contained astragaloside, 4.40 mg·g−1, astragalus saponin I, 0.28 mg·g−1, astragalus saponin II, 1.42 mg·g−1, and astragalus saponin III, 1.31 mg·g−1. Polysaccharides component was 402.2 mg·g−1 crude polysaccharides.
2.4.2. Verification of Overlap among RA Split Components
The identification of overlap among RA split components was processed through similarity evaluation system for chromatographic fingerprint of TCM (Version 2012) with flavonoids as the control sample and principal component analysis using high-performance liquid chromatography-diode array detection (HPLC-DAD) data.
2.5. Experimental Protocol
After establishment of model rats, RA and its split components were administrated to rats. The dosage was determined from the product of highest daily dose (60 g/70 kg) of the Chinese Pharmacopoeia (2010 edition) and the equivalent dose coefficient. RA water decoction was given 5.40 g·kg−1·d−1. The dosage of the split components was the same as the content in the 5.40 g crude RA, such as the flavonoids component, 0.07 g·kg−1·d−1, the saponins component, 0.27 g·kg−1·d−1, the polysaccharides component, 1.41 g·kg−1·d−1, and the residual aqueous solution, 1.32 g·kg−1·d−1. The normal control group and the model group were given equal amounts of normal saline. Drugs were administered by gavage once a day for 14 days, 1 mL/100 g. After the last administration, rats were decapitated with their duodenum tissues separated at 4°C and put into liquefied nitrogen for storage.
2.6. Measurement of the Body Weight
After the last administration, the body weight of rats in each group was measured by electronic balance.
2.7. Measurement of the Water Load Index and the Urine Volume
The body weight of rats was detected after fasting for 12 hours, as a control value. Then rats were intraperitoneally injected with normal saline in the volume equal to 10% of the body weight. After that, rats were put into the metabolic cage, and the body weight was measured after 0, 1, 2, 4, and 6 hours. During this time, food and water were banned. Urine in 6 hours was collected. Ratio of the body weight loss (%) = (the body weight after water load − body weight before water load)/body weight before water load × 100. Water load chart between ratio of the body weight loss and time was drawn using origin 9.0; water load index was area under the curve of 6-hour water load.
2.8. Statistical Analysis
SPSS 21.0 was used for statistical analysis. The values for the body weight, water load index, and urine volume were all presented as the mean ± standard deviation (±SD). Differences between groups were tested by one-way ANOVA followed by LSD method to test for difference between the mean values of all groups. P < 0.05 was considered statistically significant. The area under the curve of 6-hour water load was calculated using Origin 9.0.
2.9. Gene Chip Analysis
Total RNA was extracted using mirVana RNA Isolation Kit and purified with RNeasy Mini Kit according to the manufacturers’ instructions. Quality and concentration of RNA were checked by ND-2000 spectrophotometer. Equal amount of purified RNA from three different samples was mixed. Samples were hybridized separately into seven Agilent Rat Gene Expression Microarrays. 200 ng total RNA was used to synthesize double-stranded cDNA and then to produce biotin-tagged cRNA using the Quick Amp Labeling Kit, One-Color. The cRNA was purified by the RNeasy Mini Kit. The labeled cRNA samples were fragmented for 30 min at 60°C in the dark. The fragmented cRNA was hybridized to Agilent 8 × 60K Rat Gene Expression Microarray. Hybridization was performed using the Agilent Gene Expression Hybridization Kit at 65°C with rotation for 17 hours on an Agilent Gene Chip Hybridization Oven. The gene chips were washed followed by scanning with an Agilent Microarray Scanner. The images were converted into gene expression data by Agilent Feature Extraction software (version 10.7.1.1).
2.10. Functional and Pathway Enrichment Analysis of DEGs
Raw data obtained from gene chip test were imported into Agilent GeneSpring software (version 12.5) and normalized using quantile algorithm. The normalized values were compared between the model group and the normal control group and between treatment groups and the model group. The DEGs were screened using criterion of more than or less than 2-fold change. DAVID (https://david.ncifcrf.gov/) is an online program that provides a set of high-throughput gene functional annotation to understand the biological meaning behind plenty of genes [18]. To gain insight into the potential functional consequences and pathway changes induced by RA and its split components, GO and KEGG pathway enrichment analysis of DEGs were performed using DAVID database. The significant enrichment was defined as P < 0.05.
2.11. Quantitative Real-Time PCR Analysis
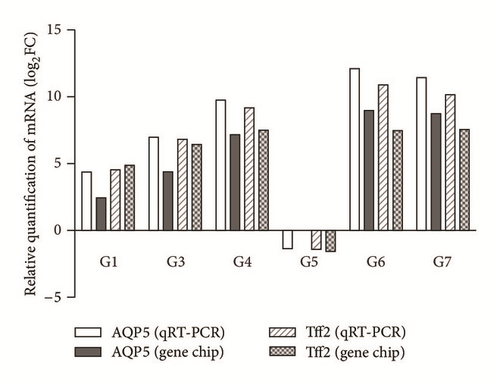
Two-step quantitative real-time PCR (qRT-PCR) was performed to confirm gene chip results according to Applied Biosystems’ guidelines. Two candidate genes were chosen for qRT-PCR according to the expression ratio in each group. The primers of candidate genes were designed using Primer Premier 5.0 software. Sequences of oligonucleotide primer pairs for selected genes were shown in Table 1. Amplification conditions were 95°C for 30 s, followed by 40 cycles of 95°C for 3 s, 60°C for 30 s, and 60°C for 30 s. Melting curve analysis was performed at the end of each PCR reaction to confirm if a single PCR product was detected. The housekeeping gene, glyceraldehyde-3-phosphate dehydrogenase (GAPDH), was used to normalize quantification of the mRNA targets. All the reactions were performed in triplicate. The 2−ΔΔCt method was used to calculate the relative gene expression levels.
| GenBank accession number | Gene symbol | Forward primer (5′-3′) | Reverse primer (5′-3′) |
|---|---|---|---|
| NM_012779 | AQP5 | CACACCAGAAAGGGACGACA | TCCGTGAGCCATCTATCCCT |
| NM_053844 | Tff2 | GATCTTCGAAGTGCCCTGGT | ACCCCAGAGATCGACACAGT |
| NM_017008 | GAPDH | CAGGGCTGCCTTCTCTTGTG | TGGTGATGGGTTTCCCGTTG |
3. Results
3.1. Identification of Overlap among RA Split Components
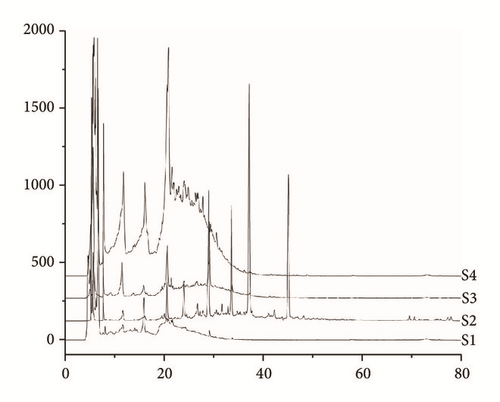
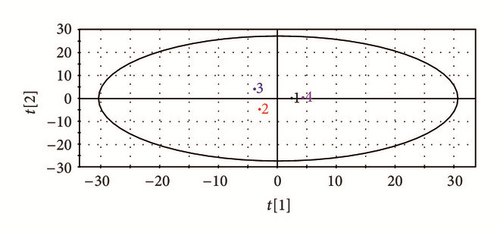
Four main components, polysaccharides, flavonoids, saponins, and residual aqueous solution constituents, were extracted from RA. The results of fingerprint showed that overlap among the four components was very low, which totally meets the requirement for experimental standard (Figure 1(a)). HPLC-DAD data was imported into SIMCA-P to process multivariate statistical analysis. Two-dimensional distribution of four split components is shown in Figure 1(b), which also indicated that the overlap was very low.
3.2. Comparisons of the Body Weight
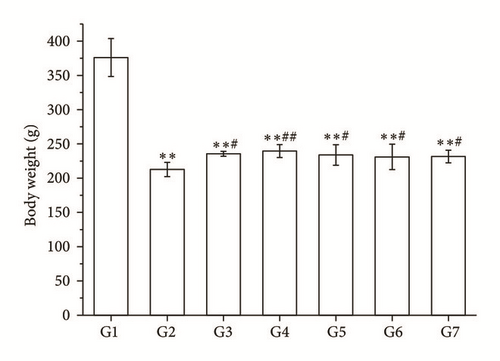
Compared with the model group, the body weights of rats in the RA decoction group and split components groups were higher than that in the model group (P < 0.05 and P < 0.01, Figure 2(a)).
| Group | Term | Description | Count | P value |
|---|---|---|---|---|
| G2 versus G1 | GO:0046903 | Secretion | 55 | 5.54E − 04 |
| GO:0006811 | Ion transport | 65 | 1.62E − 03 | |
| GO:0019725 | Cellular homeostasis | 41 | 7.85E − 03 | |
| GO:0050878 | Regulation of body fluid levels | 20 | 1.92E − 02 | |
| G3 versus G2 | GO:0046903 | Secretion | 40 | 5.93E − 05 |
| GO:0019725 | Cellular homeostasis | 29 | 2.62E − 03 | |
| GO:0006811 | Ion transport | 38 | 1.92E − 02 | |
| GO:0050878 | Regulation of body fluid levels | 13 | 3.64E − 02 | |
| G4 versus G2 | GO:0046903 | Secretion | 72 | 1.83E − 07 |
| GO:0006811 | Ion transport | 85 | 5.64E − 07 | |
| GO:0051046 | Regulation of secretion | 54 | 8.29E − 07 | |
| GO:0048878 | Chemical homeostasis | 66 | 1.35E − 05 | |
| GO:0050878 | Regulation of body fluid levels | 30 | 2.36E − 05 | |
| GO:0030104 | Water homeostasis | 8 | 2.94E − 03 | |
| GO:0042044 | Fluid transport | 5 | 1.47E − 02 | |
| GO:0015250 | Water channel activity | 4 | 1.02E − 02 | |
| G5 versus G2 | GO:0006811 | Ion transport | 82 | 2.64E − 05 |
| GO:0009992 | Cellular water homeostasis | 4 | 1.03E − 02 | |
| GO:0042044 | Fluid transport | 5 | 1.75E − 02 | |
| GO:0006833 | Water transport | 4 | 3.40E − 02 | |
| GO:0015250 | Water channel activity | 4 | 1.27E − 02 | |
| G6 versus G2 | GO:0006811 | Ion transport | 208 | 1.53E − 09 |
| GO:0046903 | Secretion | 154 | 3.76E − 06 | |
| GO:0050878 | Regulation of body fluid levels | 59 | 1.33E − 04 | |
| GO:0019725 | Cellular homeostasis | 117 | 2.65E − 04 | |
| GO:0006884 | Cell volume homeostasis | 8 | 1.61E − 02 | |
| GO:0007589 | Body fluid secretion | 19 | 3.35E − 02 | |
| GO:0005216 | Ion channel activity | 48 | 3.78E − 02 | |
| G7 versus G2 | GO:0006811 | Ion transport | 183 | 5.84E − 12 |
| GO:0046903 | Secretion | 139 | 1.00E − 08 | |
| GO:0050878 | Regulation of body fluid levels | 56 | 1.51E − 06 | |
| GO:0019725 | Cellular homeostasis | 104 | 8.78E − 06 | |
| GO:0030104 | Water homeostasis | 13 | 1.09E − 03 | |
| GO:0015267 | Channel activity | 50 | 3.24E − 03 | |
| GO:0050891 | Multicellular organismal water homeostasis | 9 | 1.92E − 02 | |
| GenBank accession number | Gene symbol | FC (G2 versus G1) |
FC (G3 versus G2) |
FC (G4 versus G2) |
FC (G5 versus G2) |
FC (G6 versus G2) |
FC (G7 versus G2) |
|---|---|---|---|---|---|---|---|
| NM_012778 | AQP1 | — | — | 2.08 | — | 4.90 | 4.53 |
| NM_031703 | AQP3 | — | — | — | −2.95 | — | — |
| NM_001142366 | AQP4 | — | — | — | 3.01 | — | — |
| NM_012779 | AQP5 | −5.41 | 21.06 | 144.07 | — | 504.90 | 429.01 |
| NM_022181 | AQP6 | — | — | 2.03 | — | — | — |
| NM_019158 | AQP8 | — | −2.19 | — | −6.14 | −2.07 | −6.30 |
- Note: FC: fold change; —: no changes of gene expression.
| Group | Term | Description | Count | P value | Genes |
|---|---|---|---|---|---|
| G2 versus G1 | KEGG:rno04080 | Neuroactive ligand-receptor interaction | 20 | 2.10E − 03 | GPR83, CCKAR, TAAR7B, CCKBR, OPRL1, LEPR, OXTR, GRM1, CRHR2, ADRB1, NMUR1, GALR3, HTR6, GRM6, UTS2R, TAAR5, LHB, GLP1R, MTNR1A, HTR5B |
| KEGG:rno04020 | Calcium signaling pathway | 12 | 3.16E − 02 | CCKAR, SLC8A2, ADRB1, CCKBR, CALML3, HTR6, SPHK1, CACNA1G, OXTR, CAMK2A, GRM1, HTR5B | |
| G3 versus G2 | KEGG:rno04060 | Cytokine-cytokine receptor interaction | 11 | 1.14E − 02 | VEGFB, IL1R2, CCL20, CXCL13, TNFRSF12A, IL18, CCR2, IL13, CSF3R, IL6R, TNFSF9 |
| G4 versus G2 | KEGG:rno04024 | cAMP signaling pathway | 17 | 8.27E − 04 | ADCY3, VAV3, ADCY2, GRIN1, ATP1A3, CREB5, VAV2, ATP2B2, FOS, ATP2B3, SSTR2, CREB3L4, RAPGEF3, ADCY10, LIPE, GLP1R, AKT2 |
| KEGG:rno04020 | Calcium signaling pathway | 16 | 1.35E − 03 | ADCY3, CCKAR, GNA15, ADCY2, TACR3, CCKBR, GRIN1, SPHK1, BDKRB1, NTSR1, ATP2B2, ATP2B3, PLCD4, CACNA1E, HTR2B, CACNA1A | |
| KEGG:rno04152 | AMPK signaling pathway | 11 | 1.01E − 02 | SLC2A4, LEPR, SCD, PFKFB1, CREB3L4, CREB5, ADIPOQ, IRS1, LIPE, AKT2, PCK1 | |
| KEGG:rno04080 | Neuroactive ligand-receptor interaction | 17 | 3.62E − 02 | CCKAR, TAAR7B, TACR3, CCKBR, GRIK2, LEPR, GRIN1, PRSS1, BDKRB1, NTSR1, SSTR2, GALR1, LOC286960, PRSS3, HTR2B, GLP1R, GABRP | |
| G5 versus G2 | KEGG:rno03320 | PPAR signaling pathway | 10 | 3.80E − 03 | CPT1B, APOA2, ACADM, PPARG, AQP7, GK, FABP2, ADIPOQ, SLC27A2, ACSL6 |
| G6 versus G2 | KEGG:rno04010 | MAPK signaling pathway | 40 | 6.60E − 04 | IL1R2, IL1R1, FGF7, FGFR3, TNF, PDGFB, MAP4K2, CACNB1, FGF13, HSPA1B, CACNB4, TGFB2, KRAS, RAC2, SOS2, FAS, IL1A, HSPA8, AKT2, PRKCA, PTPN5, TAOK3, PTPRR, NR4A1, FGF20, MECOM, STK4, RPS6KA5, PLA2G4A, DUSP2, MAPK12, JUN, MAPK8, CACNA1E, MAPK8IP1, GADD45B, MAP3K14, GADD45A, DUSP8, CD14 |
| KEGG:rno04024 | cAMP signaling pathway | 28 | 1.29E − 02 | PPARA, ADCY4, ADCY8, CNGB1, GRIN3A, SOX9, GLI3, ATP2B1, ATP2B2, ATP2B3, RAC2, CREB3L1, CREB3L4, CAMK2B, RAPGEF3, ADCY10, AKT2, PLD1, VAV3, ROCK2, ADCY9, JUN, ABCC4, GNAS, MAPK8, GHSR, GLP1R, LIPE | |
| KEGG:rno04151 | PI3K-Akt signaling pathway | 41 | 3.65E − 02 | FGF7, PHLPP2, FGFR3, PDGFB, GNG13, KITLG, VTN, FGF13, BCL2L1, IGF1R, LAMB3, KRAS, COMP, ATF6B, TEK, SOS2, CREB3L1, GYS2, CREB3L4, THBS1, PPP2R2B, COL11A1, ANGPT2, AKT2, GHR, PRKCA, SGK1, SGK2, IL7, ITGA2, NR4A1, IL6R, FGF20, VEGFB, LAMA2, LAMA1, VEGFA, GNB5, LAMC2, LAMC1, INS1 | |
| G7 versus G2 | KEGG:rno03320 | PPAR signaling pathway | 13 | 1.11E − 02 | LPL, CYP4A1, CYP4A3, SCD, ADIPOQ, RGD1565355, PCK1, APOA2, CD36, LOC681458, APOC3, CYP4A8, FABP5 |
| KEGG:rno04020 | Calcium signaling pathway | 23 | 1.95E − 02 | ORAI2, GNA15, CCKBR, ADCY8, TACR2, TACR1, SPHK1, BDKRB1, ATP2B2, P2RX7, CHRM5, PLCB3, ATP2B3, CAMK4, ADCY9, ATP2A3, P2RX2, TBXA2R, PLCD4, CHRNA7, HTR2B, PLCB2, CACNA1A | |
| KEGG:rno04152 | AMPK signaling pathway | 17 | 2.65E − 02 | LEPR, SCD, IRS1, ADIPOQ, RGD1565355, PCK1, IGF1R, G6PC, EIF4EBP1, CD36, LOC681458, CREB3L1, GYS2, CREB3L4, PIK3R3, PPP2R2B, LIPE | |
3.3. Comparisons of the Water Load Index and the Urine Volume
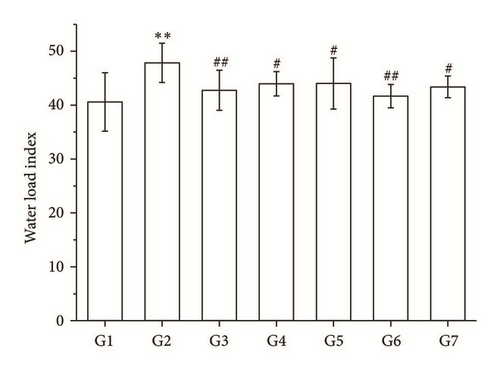
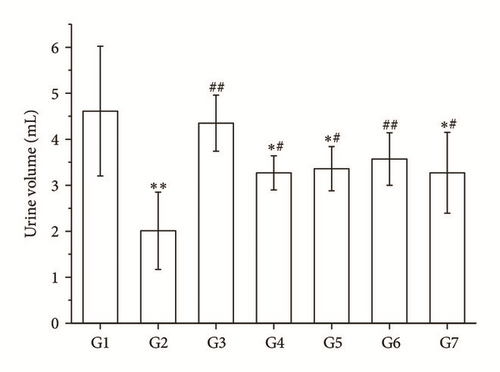
The water load index in RA and its split components groups was decreased, and the urine volume was increased compared with the model group (P < 0.05 and P < 0.01, Figures 2(b) and 2(c)).
3.4. Identification of DEGs
A total of 1275 DEGs were identified from datasets comparing the model group with the normal control group. Compared with the model group, the number of DEGs of the RA decoction group, the flavonoids group, the saponins group, the polysaccharides group, and the residual aqueous solution group was, respectively, 688, 1204, 1361, 3181, and 2419.
3.5. Functional Enrichment Analysis of DEGs and Genes Related to the Water Metabolism
To gain further insight into the function of DEGs, functional and pathway enrichment analysis was performed using DAVID. GO enrichment analysis’ results showed that DEGs related to water metabolism in the model group were significantly enriched in secretion, ion transport, and regulation of body fluid levels (Table 2). Functional terms enriched by DEGs of RA decoction group were mainly involved in secretion, cellular homeostasis, and regulation of body fluid levels. The flavonoids group’s DEGs were enriched in secretion, water homeostasis, and water channel activity, the saponins group’s DEGs were enriched in ion transport, cellular water homeostasis, and water transport, the polysaccharides group’s DEGs were enriched in ion transport, secretion, regulation of body fluid levels, and cellular homeostasis, and the residual aqueous solution group’s DEGs were enriched in ion transport, secretion, and cellular homeostasis (Table 2). Studies reported that aquaporins (AQPs) were the most important molecular targets of the DSSD syndrome [10, 19]. As shown in Table 3, the study identified AQPs from DEGs including AQP1, AQP3, AQP4, AQP5, AQP6, and AQP8.
3.6. KEGG Pathway Enrichment Analysis of DEGs
Table 4 showed significantly enriched pathways of DEGs through KEGG enriched analysis. DEGs of the model group were enriched in neuroactive ligand-receptor interaction and calcium signaling pathway compared with the normal control group. Compared with the model group, the RA decoction group’s DEGs were enriched in cytokine-cytokine receptor interaction, the flavonoids group’s DEGs were enriched in cAMP and calcium signaling pathway, the saponins group’s DEGs were enriched in PPAR signaling pathway, the polysaccharides group’s DEGs were enriched in MAPK, cAMP, and PI3K-Akt signaling pathway, and the residual aqueous solution group’s DEGs were enriched in PPAR, calcium, and AMPK signaling pathway.
3.7. Results of Quantitative Real-Time PCR
To confirm gene chip results, qRT-PCR was performed on candidate genes and revealed parallel patterns of gene expression. As shown in Figure 3, the relative expression levels of AQP5 and Tff2 mRNA were in accord with the results of gene chip analysis.
4. Discussion
In this study, results showed that RA decoction and its split components increased the body weight of rats with the DSSD syndrome, decreased the water load index, and increased the urine volume in different degree, especially the polysaccharides component. The pharmacodynamic study indicated that RA and its split components could regulate the water metabolism of rats and have sweet-warm property.
The TCM theory emphasizes that spleen qi promotes water transport. The intestine is a main part regulating water absorption and secretion. Water transport across the intestine is important for maintaining body water homeostasis and ensures digestive and absorptive functions [20]. Therefore, the intestine is the main organ for studying the mechanism of DSSD. The importance of aquaporins (AQPs), transmembrane water channel proteins, in the gastrointestinal tract appears to be immediately evident [20]. The function of AQPs in the gastrointestinal gut may be involved in water transfer, secretion of water and fluid, and absorption of water and even small solutes through epithelium [21–23]. Until now, at least 11 AQPs (AQP1–11) have been found to be present in the whole gut [24]. Researches pointed that AQPs in the gastrointestinal tract are the molecular basis of the spleen governing dampness [19]. Studies also showed that the expression of AQPs changed in the gastrointestinal tract of rats with the DSSD syndrome, including AQP1, AQP2, AQP3, and AQP4 [20, 25, 26]. However, these researches were based upon a single gene or protein and have little mechanism study.
In the present study, we screened out DEGs of the duodenum using the gene chip technology and performed functional and KEGG pathway enrichment analysis. Table 3 showed that GO terms related to water metabolism contained secretion, ion transport, regulation of body fluid levels, water homeostasis, and water transport. Results of the GO enrichment analysis indicated that water metabolism in the body with the DSSD syndrome was disordered. The results showed that the expression of AQP1, AQP3, AQP4, AQP5, AQP6, and AQP8 was changed in model rats; RA and its split components could reverse these changes. AQP1 is widely distributed at the capillary endothelium of the mucosa and submucosa, and that indicates a main role of AQP1 in the passage of water between the gastrointestinal mucosa and bloodstream [24, 27, 28]. AQP1 is also located in endothelial cells of central lacteals in the villi of the small intestine [29]. AQP3 is expressed at the basolateral membrane of epithelial cells at villous tip and could mediate permeation of glycerol and some small neutral solutes as well as water; it serves in water reabsorption [30]. AQP4 is present in the basolateral membrane of the crypt cells located at the bottom of the crypt [31]. In addition to AQP5 expression, AQP5 is located at the apical and lateral membranes of Brunner’s gland in the duodenum, where it involves a water secretion mechanism [32–34]. Earlier studies have demonstrated that AQP6 is present along the rat small intestine, in addition to direct involvement in the absorption of water and anions [35]. AQP8 is present in absorptive epithelial cells but it does not play a major role in intestinal transcellular water transfer. In the intestine, water metabolism may involve water and fluid secretion and absorption. Therefore, the results suggested that RA and its split components could change the expression of AQPs mediated water secretion or absorption of the duodenum to improve dampness stagnancy. The split components had the most influence on AQP5 expression, especially the polysaccharides component.
The secretion and absorption of transepithelial fluids are closely related to intestine physiology by maintaining water and electrolyte balance [24, 35]. The balance of intestine fluid movement has been reported to be regulated by complicated factors, including gut hormones, intestinal contents, inflammatory factors, and feed conditions [33]. These regulations may affect alterations of AQPs expression and distribution, which may account for the changes of water transport in the gut [22, 36]. In this study, KEGG pathway analysis indicated that the regulatory mechanism of water transport may be involved in MAPK, PPAR, cAMP, PI3K-Akt, and calcium signaling pathway. KEGG enrichment analysis also showed that DEGs were enriched in cytokine-cytokine receptor interaction in the model group, the saponins group, and the polysaccharides group and neuroactive ligand-receptor interaction in the residual aqueous solution group. Although these pathway enrichment P values were not significant, they had an important meaning in the biological function. It indicated that RA and its split components produced efficacy through multitargets and multipathways. Therefore, we inferred that RA and its split components regulated the level of the cytokine, gastrointestinal hormone, which triggered MAPK, PPAR, cAMP, calcium, and PI3K-Akt signaling pathway and then activated downstream molecules, finally regulating transcription of a series of target genes including AQPs.
In conclusion, RA and its split components could regulate AQPs via multipathway to promote water metabolism of rats with the DSSD syndrome, which indicated the sweet-warm properties of RA. The polysaccharides component had better effects among the split components. Further study was needed for the detail of the regulative mechanism.
Conflicts of Interest
The authors declare that there are no conflicts of interest regarding the publication of this paper.
Acknowledgments
This research was supported by the National Basic Research Program of China (973 Program, 2013CB531803), National Natural Science Foundation of China (81673852 and 81603419), the Shandong Provincial Natural Science Foundation of China (ZR2016HM66), and Key Technological Innovation Project of Key Industries in Shandong Province (2016CYJS08A01-3 and 2016CYJS08A01-4).


