Equalized Energy Consumption in Wireless Body Area Networks for a Prolonged Network Lifetime
Abstract
The phenomenal advances in electronics contributed to a widespread use of distributed sensors in wireless communications. A set of biosensors can be deployed or implanted in the human body to form a Wireless Body Area Network (WBAN), where various WBAN PHY layers are utilized. The WBAN allows the measurement of physiological data, which is forwarded by the gateway to the base station for analysis purposes. The main issue in conceiving a WBAN communication mechanism is to manage the residual energy of sensors. The mobile agent system has been widely applied for surveillance applications in Wireless Sensor Networks (WSNs). It consists in dispatching one or more mobile agents simultaneously to collect data, while following a predetermined optimum itinerary. The continuous use of the optimal itinerary leads to a rapid depletion of sensor nodes batteries, which minimizes the network lifetime. This paper presents a new algorithm to equalize the energy consumption among sensor motes. The algorithm exploits all the available paths towards the destination and classifies them with respect to the end-to-end delay and the overall energy consumption. The proposed algorithm performs better compared to the optimal routing path. It increases the network lifetime to the maximum by postponing routing of data via the most-recently used path, and it also maintains data delivery within the delay interval threshold.
1. Introduction
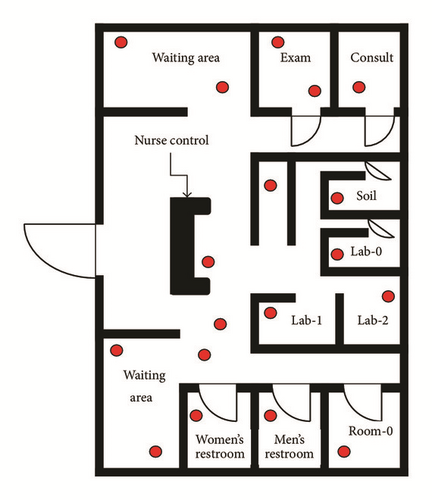
WBANs are considered one of the most recent research topics [1–3]. In fact, the patient can perform activities of daily living while physiological data are continuously monitored by medical centers. A WBAN is composed of several biosensors implanted or deployed on the body to measure medical parameters, such as body temperature, arterial pressure, and EEG Signal [3–8]. Once the aforementioned parameters are collected, they are transmitted to the base station where further analyses are taking place by the specialists. For this reason, the overall architecture of a WBAN is subdivided into three levels: the first level includes local data transmission from biosensors to the Personal Digital Assistant (PDA), which is located within the transmission range of the biosensor (in case the biosensors are linked by a star topology), or it can be retransmitted towards a relay biosensor using a multihops topology with a step of 2. The relay biosensors are characterized by important energy resources and wide communication range. Moreover, they have the ability to maintain the power of transmission very low leading to minimal energy consumption, while the heating effect is kept inferior to a specific threshold defined by SAR [9] for a prolonged period of time. The PDA is usually powered with AA batteries and does not have the problem of limited energy resources. It forwards data towards the final destination through an intermediate level (level 2), which can be either a WIFI, 3G, 4G, WSNs, or a cellular network. The choice of the intermediate network is application-oriented, but it often tends to minimize the overall installation cost. Finally, the third level consists of a set of endpoints, such as the Personal Digital Assistant, linked to a mega database where patients records are stored and analyzed by specialists in the domain. In a spacious area like the hospital, several WBSNs with diverse mobility patterns coexist. They either follow a static pattern such as lying-down and sitting or a dynamic pattern, for instance, walking or running [10]. These WBSNs collaborate with a set of statically deployed relay sensors (Wireless Sensor Networks) to deliver medical data. As can be seen from Figure 1, relay sensors (red dots) are scattered in a way to cover the different spots visited by the patient. The relay sensors are often called source nodes, to which a number of sensor nodes are added to insure sensors connectivity and multihop routing. In this work, we aim to enhance the performance of the WBANs in terms of prolonging the network lifetime. The emphasis is given to the second level composed of relay sensor nodes. Our new optimal routing mechanism consists in utilizing the mobile agent technology coupled with an equalized energy consumption schema. The latter takes into consideration the residual energy of each relay sensor in accordance with data collection method, which is proven to be efficient in terms of minimizing the overall energy consumption and increasing the network lifetime.
2. Related Works
In [11], a modified Stable Election Protocol (SEP), named Prolong-SEP (P-SEP), is presented to prolong the stable period of Fog-supported sensor networks. It consists in maintaining balanced energy consumption as all sensor nodes have the same probability to be selected as a cluster head. The experimental results showed that the proposed algorithm achieves much higher energy saving than the traditional one. In [12], the authors proposed an Energy-Efficient k-Coverage Algorithm (EEKCA), which constructs a network coverage model by utilizing the relative positions of nodes. EEKCA calculates the coverage expectation with a sector and gives the process to fulfill the coverage with the minimum number of sensor nodes. The simulation results showed that the proposed algorithm improves not only the coverage quality of the network but it also prevents the rapid depletion of sensor nodes energy, achieving though an extended network lifetime. Nevertheless, Wireless Sensor Networks algorithms are designed to tackle bigger size networks. Besides, the cluster-based architecture has been proven to be an inconvenient choice for WBAN [13]. Moreover, the previously mentioned algorithms did not take into account the sensor motes where the energy consumption does not respect the theoretical model of sensor node’s battery depletion [14]. In [15], the authors reviewed WBAN communication architecture, security, and privacy requirements in WBAN. A novel biometric algorithm was designed in [16] based on biometric feature Electrocardiogram and Data Authentication Function in order to replace the traditional key generation techniques and attain security and privacy in WBANs. The simulation results showed that the proposed scheme outperforms symmetric encryption based technique DES and asymmetric encryption based algorithm RSA. Moreover, fewer resources were required during data transmission, which offered cost-efficient solution compared with the conventional approaches for WBAN security. In [17], a key generation algorithm using ECG feature biometric for WBAN security was proposed. The fast Fourier transform method was used to individually process the selected ECG datasets of diabetic patients. The simulation results showed that the algorithm provides a secured internode communication with a 25% energy efficiency in node transmission energy consumption for a WBAN system.
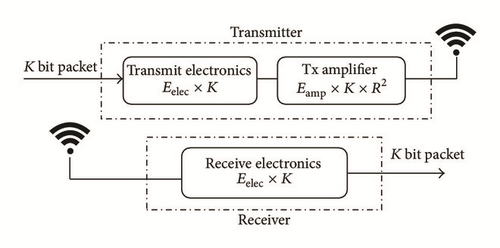
3. Energy Consumption Model
| Radio | TR1000 | TR1000 | CC1000 | CC2420 |
|---|---|---|---|---|
| Data rate (kbps) | 10 | 40 | 38.4 | 250 |
| Modulation type | OOK | ASK | FSK | O-QPSK |
| Receive power (mW) | 9 | 12 | 29 | 38 |
| Transmit power at 0 dBm (mW) | 36 | 36 | 42 | 35 |
4. Mobile Agent Paradigm
The mobile agent paradigm has been widely utilized for an efficient data management. In fact, data can be sensed and treated locally based on the portion of the code carried by the mobile agent when it is roaming the network. The mobile agent code size mainly depends on the measured parameters. In other words, as the number of these parameters increases up to a certain limit, the size of collected data evenly increases, which affects the overall energy needed to transmit or receive data. The mobile agent paradigm can be a packet including a preestablished path to collect data. The packet is retransmitted to the intermediate nodes in the vicinity until it reaches the destination node. The mobile agent can also be referred to as a mobile node or an actuator, capable of acting upon the physical environment. Such entities can be implemented to perform networking-related functionalities such as receiving, transmitting, processing, and relaying data towards the destination. They also roam the network to particular positions and proceed with data measurement in respect to the application requirements.
In [19], the average energy consumption within WSNs has been highlighted when the mobile agent packet and the mobile agent sensor mote are implemented. As mentioned in [19], the mobile agent node approach shows a better performance in terms of energy consumption, as it reaches a maximum value equal to 0,080115 mJ (Sn2) versus 0,555522 mJ (Sn4) in case of mobile agent packet. This behavior was expected as the energy consumption model of sensor nodes depends on both data and code sizes but also the distance between the sender and the receiver. Thereby, the mobile agent packet size increases exponentially which explains the results obtained. The mobile agent packet needs to check the connectivity between two consecutive sensor nodes in the preestablished path, for there is no forwarding mechanism taking place. However, when considering the mobile agent node, data packets are aggregated locally. In other words, the sensor node communicates the same amount of data size every time it is interrogated by the mobile agent located within its communication range. Besides, the maximum energy consumption is formulated in respect to the communication range length of the sensor node. The mobile agent packet approach presents an important advantage concerning data transmission latency, which is reduced to 0,13 s compared with 8 s for the mobile agent node. Again, this behavior was expected as the mobile agent node roams the network with a particular speed (m/s) value to reach the following destination, which explains the delay being found. Based on the aforementioned results, we base our mobile agent approach choice on minimizing EPD factor (Energy Delay). The purpose is to give a trade-off balance between the energy consumption and the end-to-end delay. However, this choice will certainly serve some applications while giving undesirable performances to others. For instance, some application put much emphasis on the transmission delay. Hence, it is important to use a mobile agent where the latency does not overcome a specific threshold. Nevertheless, other applications focus on maintaining the network lifetime as long as possible, which makes the energy consumption the main problem to resolve. Thereby, the choice of the mobile agent approach remains application-oriented, determined by the user.
5. MABMR: Mobile Agent Based Multipath Routing
Many researches have been focusing on finding the optimal number of mobile agents to disperse in the network, but also the optimum itinerary to follow in order to maintain a minimal energy consumed and guarantee data delivery within the delay interval threshold. However, the continuous use of the same itinerary for data collection leads to unbalanced energy consumption; therefore, the sensor nodes will run out of energy in a short period of time. The network lifetime often indicates the first sensor node experiencing a complete battery depletion. However our algorithm is valid for any network lifetime definition since it puts much emphasis on equalizing the energy consumption among sensors, thus extending the network lifetime for many rounds.
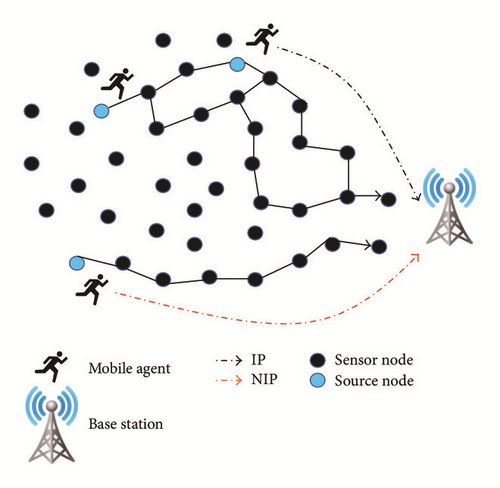
Our algorithm is based on exploring all the possible itineraries from source nodes to the base station in respect of data transmission delay, which does not overcome a predefined delay threshold (see Figure 3). These itineraries are classified in a way that paths including intersected nodes have the least ranking as they may create energy depletion holes in the network after a short time period of its use. Algorithm 1 is implemented to establish the mobile agent itineraries. It has a quadratic complexity and it starts off with defining all possible paths from the source nodes to destination node, that is, the base station. These paths are then filtered in a way that the path’s delay that exceeds a delay threshold (measured in respect to the application type in use) is excluded from the overall paths set, and then the resulting set will be subdivided into two main subsets which are as follows: NIP (Nonintersected Paths) and IP (Intersected Paths). of a source node si designates all paths that do not intersect with any other path.
-
Algorithm 1
-
CHSs: indicates the set of all possible paths of a source
-
node s.
-
BS: indicates the base station.
-
SN: corresponds to the number of source nodes in the
-
network.
-
Num_CHSs: the number of paths in CHs set.
-
NIPs: the set of all non intersecting paths of the source
-
node s.
-
IPs: the set of all intersecting paths of the source node s.
-
Tr(Pi): a function indicating packet transmission delay
-
corresponding to a path Pi.
-
for s = 1 to SN do ⊳ Definition of CHSs
-
Define all possible paths towards the Base Station
-
end for
-
for Pi =1 to Num_CHS_s do
-
if Tr(Pi) ≥ DELAY_THRESHOLD then ⊳
-
CHSs filtering
-
Suppression of Pi path.
-
end if
-
end for
-
for Pi =1 to Num_CHS_s do ⊳ Definition of NIPs
-
and IPs
-
if Pi∩Pj = ∅ then ⊳
-
∀Pj ∈ ⋃CHSk where k ∈ SN, k ≠ s
-
Insert Pi into NIPs set.
-
else
-
Insert Pi into IPs set.
-
end if
-
end for
- (i)
k ∈ SN and i is an intersection point, i ∈ ID_SN, i ≠ 0;
- (ii)
SN is the set of source nodes and ID_SN is the set of sensor node identifiers;
- (iii)
num_IPs corresponds to the size of IPs set;
- (iv)
num_CHS_s is the size of all paths;
- (v)
Current_ID_SN indicates the current source node identifier;
- (vi)
α ∈ {0, …, ∑ num_CHS_s}, s ≠ Current_ID_SN;
- (vii)
j ∈ num_IPs and k ∈ SN.
-
Algorithm 2
-
SUB_NIPs: indicates a sub set of IPs non intersected
-
paths.
-
SUB_IPs: indicates a sub set of IPs intersected paths.
-
PERIODIC_COLLECT: Periodic data collection
-
EVENT_COLLECT: Random Data collection based
-
on event occurrence or user request.
-
use paths of SUB_NIPs successively.
-
if NIPs ≠ ∅ then
-
Use paths of NIPs set successively.
-
goto : end ⊳ The end of the algorithm
-
else
-
if NIPs = ∅ && IPs ≠ ∅ then
-
if EVENT_COLLECT then
-
use IPs set paths successively.
-
goto : end
-
end if
-
if PERIODIC_COLLECT then
-
if SUB_NIPs ≠ ∅ then
-
use paths of SUB_NIPs successively.
-
goto : end
-
else
-
use paths of SUB_IPs successively. goto
-
: end
-
end if
-
end if
-
end if
-
fin: The end of the algorithm
-
end if
5.1. Realistic Model
5.2. Theoretical Model
- (i)
Cr is the maximum communication range;
- (ii)
β is a variable indicating if the current node nj is an intersected node or not;
- (iii)
indicates the order of nj in the path Pk;
- (iv)
r is the number of paths that intersect at nj where 1 ≤ r ≤ SN;
- (v)
SN corresponds to the number of source nodes.
| Cr (m) | 3 |
| Data size (bytes) | 200 |
| Eamp (J/bit/m) | 10−10 |
| Eelec (nJ/bit) | 50 |
6. Estimation of the Energy Consumption and the Network Lifetime
-
, if nodei is an intersection point;
-
β = 1, else
-
+ETx is energy of the transmission;
-
+ERx is energy of reception;
-
+ETTR is energy of transition from TX to RX;
-
+ERTT is energy of transition from RX to TX;
-
+Ef is operating energy;
-
+k is number of events occurrences, k = 0, 1, 2, …;
-
+α = Sup(T/Tu).
When considering the realistic energy consumption model, the energy consumed when no event occurs during the time interval T (which is represented in terms of time interval units Tu) depends mainly on the operating energy of the sensor node but also the energy of reception. When the transceiver transmit data for a long period of time, it consumes an important amount of energy required to transit from transmission to reception state and vice versa. For analysis purposes, we consider the simulations parameters depicted in Table 3. These parameters are defined in Castalia 2.3, which is an open source simulator for WBSNs/WSNs [20–22]. The packet generation rate is constant and equals 5 pps (packets/sec). The initial energy level of each sensor node is assumed to be 18720 J and the data packet length is also constant and equals 200 bytes. The radio initial reception mode is set to high which stands for 1024 for data rate (kbps), DIFFQPSK as a modulation type, bandwidth (MHz), sensitivity (dBm), and power consumption (mW) equal, respectively, to 20, −87, and 3.1. The main loop of Algorithm 1 is executed times. Choosing the set of paths to which the current path belongs requires time . Algorithm 1 thus runs in time .
| Realistic model | ||||
|---|---|---|---|---|
| Telos CC2420 | RX MODES | 62 mw | ||
| TX LEVELS | 57.42 mw | |||
| Initial energy | 18720 (J/S) | |||
| RX | TX | SLEEP | ||
| Transition power | RX | - | 62 | 62 |
| TX | 62 | - | 62 | |
| SLEEP | 1.4 | 1.4 | - | |
| Theoretical model | ||||
| Eelec | 50 nJ/bit | |||
| Eamp | 100 pJ/bit/m | |||
| D | 200 bytes | |||
| d | 3 m | |||
6.1. Estimation of the Network Lifetime of a Nonintersecting Node in T (ms)
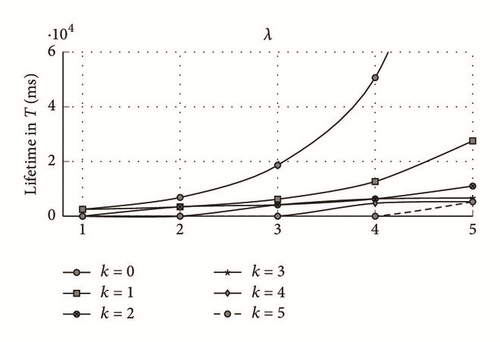
As can be seen in Figure 4, when the number of the occurred events increases, the corresponding network lifetime decreases, regardless of the average event occurrence value. These results were expected as the occurrence of an event puts the transceiver in transmission state after being transited from the reception state (in case of realistic modeling of the transceiver). Both radio transition and data transmission consume a considerable amount of energy as defined in the radio worksheet. Similarly to the theoretical model, more events occurrences lead to more bits transmitted in accordance with the distance. Therefore, an important amount of energy is consumed, which contributes to reducing the network lifetime. The network lifetime can be defined as the first sensor running out of energy or the x% sensor nodes dissipating their overall energy batteries. In our case of study, the dysfunction of the first sensor node defines the network lifetime in terms of intervals T (100 s). Hence, in order to guarantee the best network performance, the routing functionality needs to include the fault tolerance option to avoid the frequent network topology reconfiguration and increase data packet delivery ratio, while minimizing the transmission delay.
6.2. Estimation of the Network Lifetime of an Intersecting Node in T (ms)
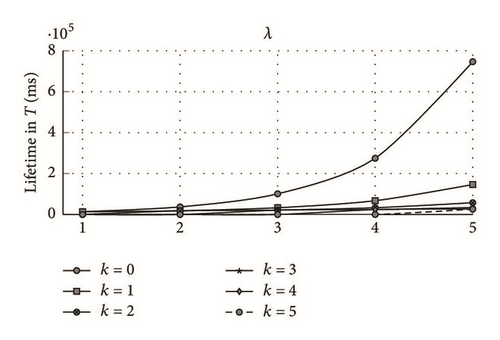
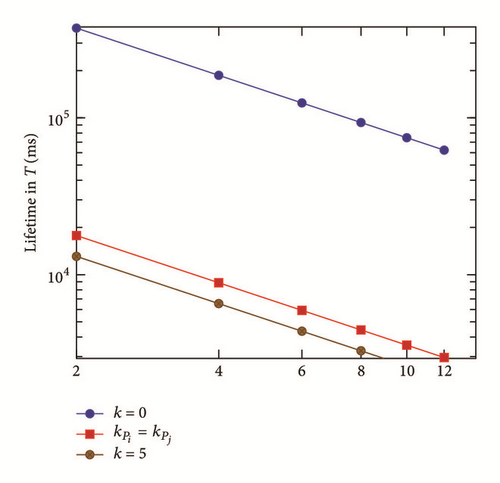
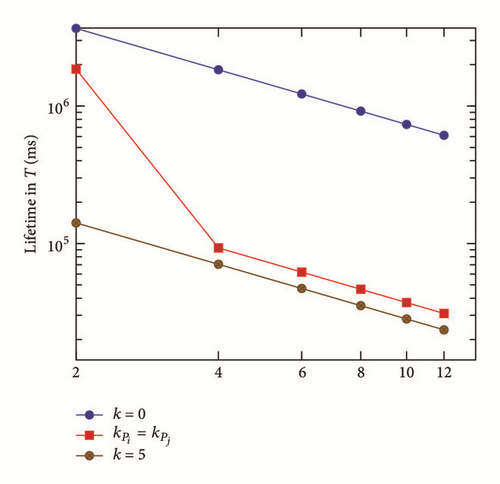
As depicted in Figure 5, there is a perfect correlation between the degree of the intersecting node and the network lifetime for both radio energy consumption models (realistic and theoretical). The bigger the degree of an intersecting point is, the less the network lifetime becomes. This tendency was expected as the intersecting point requires transmitting data packets which corresponds to zero (i.e., nonoccurrence of events) or many source nodes paths.
In our case of study, we did not consider a particular synchronization scenario where sensor nodes are active during a particular duty-cycle, after which the transceiver is turned off to save energy. In fact, the synchronization mechanism schema (when applied) makes a huge difference in energy consumption when both intersecting and nonintersecting nodes are considered. A nonintersecting node will spend more time in sleep mode, conserving though a great amount of energy, while an intersecting sensor node will have to stay on for most of the time as it delivers data to many source nodes, which leads to a rapid depletion of energy resource. The number of event occurrence possibilities is equal to λdegree_point_inter, where each path can deliver either 0,1, … or λ events.
7. Multipaths or Optimal Path Routing?
The proposed multipath approach equalized the energy consumed in the network. In Table 4, we compared our proposed routing approach with the optimal path routing in terms of network lifetime. To this end, we considered a grid network composed of 5 sensor nodes including two source nodes and the final destination. A random sensor deployment can also be utilized; however, it is important to employ additional number of relay sensors to insure the full network coverage. The results show that multipath routing outperforms the optimal path routing for both energy consumption models and data collection type. However, the optimal path might show better results in case of random data collection, where any combination of source node paths can be taking place. This will increase the chance of utilizing a sensor node with a high intersection degree. Therefore, the sensor batteries will run out of energy in a very short amount of time, which leads to network dysfunction. It is very important to carry out a detailed performance analysis of both approaches before choosing the most suitable one for data routing. When the optimal path belongs to the NIPs set, it is pointless to proceed with further analysis of lifetime estimation, as it is used by default in conjunction with other nonintersected paths. However, when it belongs to the IPs set, the corresponding estimated lifetime will be compared with the multipath routing. If the latter presents the biggest value then the multipath approach is chosen, and the optimal path will be automatically used since it is considered as an intersected path. Else if the optimal path maximizes the network lifetime, then all the paths belonging to IPs, where the estimated network lifetime is inferior or equal to the optimal path one, will be used successively.
| Realistic model | Theoretical model | |||
|---|---|---|---|---|
| Multipath | Optimal path | Multipath | Optimal path | |
| Periodic | 1890 | 1804 | 415 | 320 |
| Random | 2712 | 2709 | 12572 | 9720 |
8. Conclusion
WBAN constitutes a subset of WSNs responsible for monitoring medical and nonmedical applications. WBAN consists in using biosensors to measure physiological parameters and forwarding them to the base station where further analyses are performed. This paper presents a new routing approach to increase the network lifetime by equalizing the energy consumption within sensor devices. The proposed approach takes into consideration the type of the radio model and the frequency of data collection. The statistical results prove the efficiency of our approach in minimizing the overall energy consumption. In fact, 89 time intervals were added to the network lifetime when a realistic model is applied, compared with 9815 in case of theoretical model. Hence, the frequent topology reconstruction is reduced, leading to a minimal network cost and transmission delay.
Conflicts of Interest
The authors declare that there are no conflicts of interest regarding the publication of this paper.


