A Comparative Study of the Inhibitory Effect of Gum Exudates from Khaya senegalensis and Albizia ferruginea on the Corrosion of Mild Steel in Hydrochloric Acid Medium
Abstract
A comparative study of the inhibitory potentials of gum exudates from Albizia ferruginea (AF) and Khaya senegalensis (KS) on the corrosion of mild steel in HCl medium was investigated using weight loss and gasometric method. The active chemical constituents of the gum were elucidated using GC-MS while FTIR was used to identify the bonds/functional groups in the gums. The two gum exudates were found to be good corrosion inhibitors for mild steel in acidic medium. On comparison, maximum inhibition efficiency was found in Khaya senegalensis with 82.56% inhibition efficiency at 0.5% g/L concentration of the gum. This may be due to the fact that more compounds with heteroatoms were identified in the GCMS spectrum of KS gum compared to the AF gum. The presence of such compounds may have enhanced their adsorption on the metal surface and thereby blocking the surface and protecting the metal from corrosion. The adsorption of the inhibitors was found to be exothermic and spontaneous and fitted the Langmuir adsorption model.
1. Introduction
Interaction between valuable metals (such as mild steel) and aggressive media (such as acid, base, or salt) is a serious impediment that may risk cost benefit analysis in the operation of some industries [1]. The effects of these on the safe, reliable, and efficient operation of equipment or structures sometimes are often more serious than simple loss of a mass of a metal [2–4]. Several methods have been investigated and implemented to reduce the corrosion process and extend the lifetime of the metals/structures including painting, electroplating, coating, and cathodic protection [5–9]. The use of inhibitors has been found to be one of the best options available for the protection of metals against corrosion [10].
The use of plant products (such as extracts, gums, and latex), as corrosion inhibitors, is also on the increase [11–20]. The greatly expanded interest in these naturally occurring substances is attributed to the fact that they are cheap, readily available, and ecologically friendly and possess no threat to the environment. In addition, they contain compounds that may be aromatic and rich in π-electrons and suitable functional groups (such as C=C, C=O, and -OH) [21]. Plant gum exudates from Ferula assa-foetida [22], Dorema ammoniacum [22], Guar gum [23], Raphia hookeri [18], Pacchylobus edulis [24], and so forth have been reported as good corrosion inhibitors recently because they are less toxic, green, and eco-friendly.
It is also known that Nigeria is rich in many plant gums species which have not been put into use. Current trends in corrosion inhibition researches are directed towards finding inhibitors (green corrosion inhibitors such as gums) that are eco-friendly, less expensive, and biodegradable.
Hence, the present study is aimed at elucidating the chemical structures of Khaya senegalensis and Albizia ferruginea and evaluating their corrosion inhibition potentials. From the identified chemical constituents or structures that are inherent in the gums, other industrial potentials of the plant were also investigated. The assessment of the corrosion behaviour was studied using weight loss and gasometric techniques while FTIR measurements were used to study the functional groups associated with the adsorption of the inhibitor.
2. Materials and Methods
2.1. Materials
Corrosion experiments were performed on mild steel specimens with weight percentage composition as follows: Mn (0.6), P (0.36), C (0.15), Si (0.03), and the rest Fe. The sheet was mechanically press-cut into different coupons, each of dimension 5 × 4 × 0.11 cm. These coupons were degreased in absolute ethanol, dried in acetone, and stored in a desiccator free of moisture prior to their use in corrosion studies. The aggressive solutions for gasometric and weight loss studies were 2.5 and 0.1 M, respectively.
Albizia ferruginea (AF) and Khaya senegalensis (KS) used as inhibitors were obtained as dried exudates from their parent trees grown at Kanya Babba village in Bubura Local Government Area of Jigawa State, Nigeria, and purified following the method described by Eddy et al. [25]. The concentrations of AF and KS (inhibitors) were prepared and used for the study range from 0.1 g/L to 0.5 g/L.
2.2. GC-MS Analysis
GC-MS analysis was carried out as described by Eddy et al. [25]. Interpretation on mass spectrum GC-MS was conducted using the database of National Institute Standard and Technology (NIST) having more than 62,000 patterns. The spectrum of the unknown component was compared with the spectrum of the known components stored in the NIST library. The name, molecular weight, and structure of the components of the test materials were ascertained. Concentrations of the identified compounds were determined through area and height normalization.
2.3. Corrosion Inhibition Study
2.3.1. Weight Loss Method
The weight loss of the mild steel in 0.1 M HCl with and without the various concentrations of the inhibitors (AF and KS) was determined at 303, 313, 323, and 333 K as described by Oguzie [13]. The coupons were retrieved every 24 hrs for 7 days (168 hrs.) and the difference in weight for a period of 168 hours was taken as total weight loss.
2.3.2. Gasometry Method
2.4. FTIR Analysis
FTIR analysis of the corrosion product of mild steel and those of the studied gums was carried out at the National Research Institute of Chemical Technology (NARICT), Zaria, Kaduna State, Nigeria, using Shimadzu FTIR-8400S Fourier transform infrared spectrophotometer. The sample was prepared using KBr and the analysis was done by scanning the sample through a wave number range of 400 to 4000 cm−1.
3. Results and Discussions
3.1. GC-MS Study
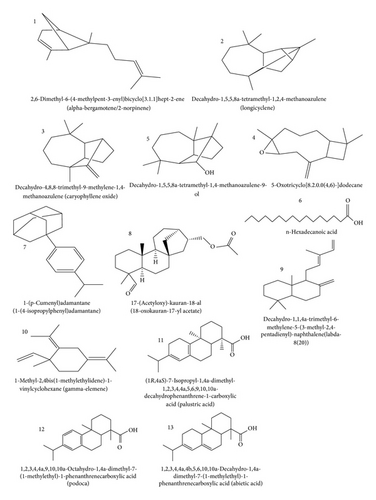
Chemical structures of most probable compounds deduced from the GC-MS spectra of KS and AF gums are presented in Figures 1 and 2, respectively. The retention time (RT), IUPAC names of the compounds suggested by reliable spectral library, molecular weight (MW), and charge to mass ratio (m/z) are presented in Tables 1 and 2. Since the area under a GC spectrum is proportional to concentration, normalization of area of the peaks was carried out and used for estimation of percentage concentration (%C) of the respective constituents of the gums. Height normalization was also carried out and the concentrations of constituents (%) based on height normalization were comparable to those obtained from area normalization.
| Line number | %C | Compound | MF | MW | RT | Fragmentation peaks |
|---|---|---|---|---|---|---|
| 1 | 6.22 | alpha-Thujene/origanene | C10H16 | 136 | 6.9 | 27 (15%), 41 (15%), 43 (15%), 65 (10%), 77 (50%), 93 (100%), 105 (2%), 121 (2%), and 136 (10%) |
| 2 | 20.31 | Myrcene | C10H16 | 136 | 7.1 | 27 (15%), 41 (20%), 53 (10%), 67 (100%), 77 (35%), 93 (100%), 105 (10%), 121 (20%), and 136 (10%) |
| 3 | 1.39 | Camphene | C10H16 | 136 | 7.4 | 27 (20%), 39 (30%), 53 (20%), 67 (30%), 79 (40%), 93 (100%), 107 (30%), 121 (60%), and 136 (20%) |
| 4 | 1.90 |
|
C10H16 | 136 | 8.0 | 27 (25%), 41 (40%), 43 (15%), 69 (15%), 77 (40%), 93 (100%), 105 (2%), 121 (10%), and 136 (20%) |
| 5 | 2.61 | Nopinen/pseudopinen | C10H16 | 136 | 8.1 | 27 (20%), 41 (60%), 53 (15%), 69 (40%), 77 (30%), 93 (100%), 105 (2%), 121 (15%), and 136 (15%) |
| 6 | 1.39 | 2,6-Dimethylhepta-1,5-diene | C10H16 | 136 | 8.5 | 27 (20%), 41 (100%), 53 (20%), 69 (80%), 77 (25%), 93 (100%), 107 (8%), 121 (10%), and 136 (5%) |
| 7 | 2.37 | Limonene/cajepetene | C10H16 | 136 | 9.6 | 27 (40%), 39 (60%), 53 (45%), 68 (100%), 79 (40%), 93 (65%), 107 (20%), 121 (20%), and 136 (25%) |
| 8 | 3.01 | Verbenol | C10H16O | 152 | 11.6 | 27 (35%), 41 (65%), 43 (40%), 59 (55%), 79 (60%), 94 (100%), 109 (90%), 119 (30%), and 137 (20%) |
| 9 | 1.14 | alpha-Campholenal | C10H16O | 152 | 12.0 | 27 (15%), 39 (20%), 55 (20%), 67 (25%), 81 (20%), 93 (55%), 108 (100%), 119 (5%), 137 (2%), and 152 (2%) |
| 10 | 7.24 | cis-Verbenol | C10H16O | 152 | 12.8 | 27 (35%), 41 (60%), 43 (40%), 59 (50%), 79 (60%), 94 (100%), 109 (100%), 119 (30%), and 137 (20%) |
| 11 | 2.61 | Myrtenol | C10H16O | 152 | 14.3 | 27 (20%), 41 (40%), 43 (20%), 67 (20%), 79 (100%), 91 (50%), 108 (40%), 119 (30%), 134 (20%), and 152 (10%) |
| 12 | 0.67 | Carvacrol | C10H16O | 152 | 14.8 | 27 (10%), 41 (32%), 55 (35%), 69 (20%), 83 (30%), 84 (55%), 109 (100%), 119 (20%), 137 (10%), and 152 (10%) |
| 13 | 2.91 | Diisopropenyl-1-methyl-1-vinylcyclohexane | C15H24 | 204 | 31.8 | 27 (32%), 41 (100%), 53 (60%), 68 (100%), 81 (100%), 93 (80%),107 (40%), 121 (35%), 133 (15%), 147 (20%), 161 (15%), and 189 (15%) |
| 14 | 8.44 | o-Menth-8-ene-4-methanol | C15H26O | 222 | 33.2 | 27 (12%), 39 (18%), 43 (38%), 59 (100%), 81 (50%), 93 (70%), 107 (40%), 121 (30%), 135 (22%), 147 (10%), 161 (40%), 189 (20%), and 204 (10%) |
| 15 | 28.82 | Nerolidol isobutyrate | C19H32O2 | 292 | 33.3 | 41 (42%), 43 (100%), 69 (25%), 71 (50%), 93 (30%), 107 (10%), 121 (40%), 127 (5%), 143 (2%), and 161 (2%) |
| 16 | 6.23 | 2-Methylene cholestan-3-ol | C28H48O | 400 | 34.0 | 65 (10%), 69 (100%), 81 (75%), 95 (70%), 105 (35%), 121 (25%), 133 (15%), 149 (15%), and 161 (10%) |
| 17 | 0.81 | 7-Hexadecenal | C16H30O | 238 | 35.2 | 41 (80%), 55 (90%), 71 (78%), 85 (50%), 98 (40%), 121 (40%), 135 (20%), and 141 (10%) |
| 18 | 1.93 | 5 alpha-pregnane-12,20-dione | C23H36OS2 | 392 | 39.9 | 43 (80%), 67 (25%), 81 (35%), 95 (18%), 105 (20%), 119 (40%), 131 (15%), 145 (20%), 159 (10%), 189 (8%), 203 (5%), 229 (10%), 255 (50%), 299 (10%), 331 (10%), 349 (20%), 350 (4%), 364 (4%), and 392 (100%) |
| Peak number | % C | Compound | MF | MW | RT | MP | Fragmentation peaks |
|---|---|---|---|---|---|---|---|
| 1 | 0.27 | alpha-Bergamotene | C15H24 | 204 | 18.9 | 42 | 69 (40%), 77 (35%), 91 (100%), 107 (40%), 119 (90%), 133 (10%), 147 (5%), 161 (15%), 189 (5%), and 204 (5%) |
| 2 | 0.65 | Longicyclene | C15H24 | 204 | 19.5 | 57 | 27 (20%), 41 (60%), 55 (30%), 69 (25%), 79 (30%), 94 (100%), 105 (60%), 119 (50%), 133 (40%), 147 (35%), 161 (40%), 180 (30%), and 204 (35%) |
| 3 | 9.15 | 1,4-Methanoazulene | C15H24 | 204 | 20.5 | 89 | 27 (35%), 41 (100%), 55 (55%), 67 (40%), 79 (70%), 91 (90%), 107 (70%), 119 (55%), 133 (10%), 149 (10%), 161 (5%), and 177 (5%) |
| 4 | 1.25 | Caryophyllene oxide | C15H24O | 220 | 26.5 | 68 | 27 (25%), 41 (90%), 69 (45%), 81 (40%), 85 (100%), 109 (45%), 119 (45%), 137 (20%), 151 (10%), 161 (15%), 189 (35%), and 204 (40%) |
| 5 | 0.66 | 1,4-Methanoazulene-9-ol | C15H26O | 222 | 26.9 | 64 | 27 (10%), 41 (60%), 55 (40%), 69 (45%), 81 (30%), 85 (100%), 109 (45%), 119 (45%), 137 (20%), 151 (10%), 161 (15%), 189 (35%), and 204 (40%) |
| 6 | 0.64 | n-Hexadecanoic acid | C16H32O2 | 256 | 31.7 | 72 | 27 (20%), 41 (80%), 43 (100%), 60 (90%), 73 (100%), 85 (25%), 98 (20%), 115 (15%), 129 (40%), 143 (5%), 157 (10%), 171 (10%), 185 (10%), 213 (20%), 227 (5%), and 256 (50%) |
| 7 | 0.45 | 1-(p-Cumenyladamantane) | C19H26 | 254 | 32.5 | 128 | 39 (40%), 41 (85%), 67 (15%), 79 (35%), 91 (40%), 105 (20%), 115 (20%), 135 (40%), 145 (10%), 155 (50%), 169 (5%), 197 (20%), 211 (5%), 239 (60%), and 254 (50%) |
| 8 | 1.38 | 18-Oxokauran-17-ylacetate | C22H34O3 | 346 | 33.3 | 150 | 31 (5%), 41 (50%), 43 (100%), 67 (40%), 81 (50%), 91 (35%), 109 (30%), 123 (40%), 135 (10%), 149 (5%), 161 (5%), 187 (5%), 257 (5%), and 286 (10%) |
| 9 | 1.27 | Naphthalene | C20H32 | 272 | 33.9 | 132 | 27 (15%), 41 (80%), 55 (60%), 69 (55%), 81 (65%), 95 (55%), 105 (50%), 119 (40%), 137 (40%), 149 (20%), 161 (40%), 175 (20%), 187 (25%), 257 (100%), and 272 (40%) |
| 10 | 11.97 | Gamma-elemene | C15H24 | 204 | 34.5 | 196 | 28 (15%), 41 (100%), 53 (50%), 67 (60%), 79 (40%), 93 (80%), 107 (50%), 121 (90%), 133 (20%), 147 (10%), 161 (20%), 189 (10%), and 204 (5%) |
| 11 | 14.77 | 1-Phenenathrenecarboxylic acid,1,2,3,4,4a,5,6,9,10,10a-decahydro-1,4a | C20H30O2 | 302 | 34.9 | 203 | 41 (20%), 81 (15%), 91 (30%), 105 (35%), 117 (20%), 13 (35%), 149 (35%), 157 (20%), 171 (10%), 185 (25%), 197 (10%), 213 (35%), 241 (50%), 256 (35%), 287 (80%), and 302 (100%) |
| 12 | 18.31 | 1-Phenenathrenecarboxylic acid,1,2,3,4,4a,5,6,9,10,10a-octahydro-1,4a-dimethyl-7-(1-methylethyl)- | C20H28O2 | 300 | 35.1 | 198 | 41 (10%), 69 (5%), 81 (5%), 91 (10%), 105 (5%), 117 (10%), 129 (15%), 141 (20%), 155 (15%), 169 (10%), 183 (10%), 197 (30%), 211 (5%,) 225 (5%), 239 (90%), and 285 (100%) |
| 13 | 39.24 | Abietic acid, 1-phenenathrenecarboxylic acid | C20H30O2 | 302 | 35.6 | 195 | 18 (10%), 41 (20%), 67 (10%), 81 (30%), 9 (35%), 105 (40%), 121 (20%), 136 (50%), 143 (20%), 157 (20%), 171 (10%), 185 (20%), 213 (30%), 241 (40%), and 259 (50%) |
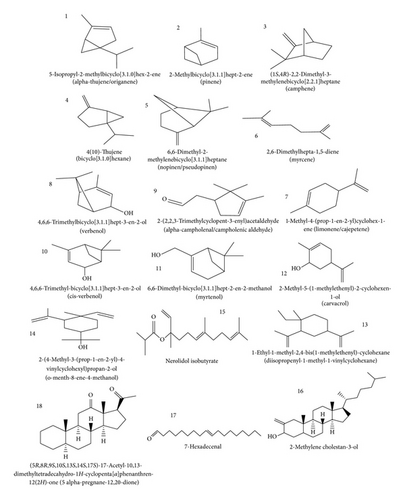
The GC-MS spectra of KS gum revealed 18 peaks. However, only 9 peaks were prominent. From the results presented, it is evident that the most abundant compound in KS gum is nerolidol isobutyrate (peak 15), which constituted about 28%.
This compound undergoes fragmentation into six molecular ions and is characterized with a mass peak value of 41. The compound is a fragrance agent and up to 1 : 10 0000 in the fragrance concentrate is recommended for use [27]. Another major component of KS gum is pinene (line 2: 20.31%), which was separated with characteristic mass peak value of 50 and with about 9 fragment ions. Pinene (C10H16) is a bicyclic monoterpene. There are two structural isomers of pinene found in nature: α-pinene and β-pinene. As the name suggests, both forms are important constituents of pine resin; they are also found in the resins of many other conifers, as well as in nonconiferous plants. In chemical industry, selective oxidation of pinene with catalysts gives many compounds for perfumery, such as artificial odorants.
In line 14, 8.8% of o-menth-8-ene-4-methanol (2-(4-methyl-3-(prop-1-en-2-yl)-4-vinylcyclohexyl)propan-2-ol) was isolated with characteristic mass peak of 128. Eighteen fragmentation ions were identified in the mass spectrum of the sample. In line 10, 7.24% of cis-verbenol (4,6,6-trimethyl-bicyclo[3.1.1]hept-3-en-2-ol) was identified. The mass peak for this fraction was 63 and 8 fragment ions characterized the mass spectrum. Verbenol is one of the common ingredients in flavour and fragrance. An isomer of verbenol was also identified in line 8 (3.01%) of the spectrum. However, the concentration of this isomer was much lower than that found in line 10. About 6.22% of alpha-thujene/origanene (5-isopropyl-2-methylbicyclo[3.1.0]hex-2-ene) was separated in line 1 of the GC-MS spectrum of KS. Mass peak for the separated compound was 41 and 7 fragment ions were identified in the mass spectrum. Thujene (or α-thujene) is a natural organic compound classified as a monoterpene. It is found in the essential oils of a variety of plants and contributes pungency to the flavour of some herbs such as Summer savory. The term thujene usually refers to α-thujene. A less common chemically related double-bond isomer is known as β-thujene (or 2-thujene). Another double-bond isomer is known as sabinene which is one of the chemical compounds that contributes to the spiciness of black pepper and is a major constituent of carrot seed oil. Thujene has long been known for its fragrance and medicinal functions.
Area normalization of the GC-MS spectrum of line 16 indicated the presence of 6.23% of 2-methylene cholestan-3-ol. This compound is a derivative of cholesterol, an essential organic compound with numerous biochemical and pharmaceutical applications. In lines 13 and 7, 2.91 and 2.37% of diisopropenyl-1-methyl-1-vinylcyclohexane and limonene/cajepetene were identified through area normalization of the GC-MS spectrum of KS gum. Limonene is a colourless liquid hydrocarbon classified as a cyclic terpene. The more common isomer possesses a strong smell of oranges. Limonene is used in chemical synthesis as a precursor to carvone and as a renewably based solvent in cleaning products.
Other minor components of KS gum include 5 alpha-pregnane-12,20-dione ((5R,8R,9S,10S,13S,14S,17S)-17-acetyl-10,13-dimethyltetradecahydro-1H cyclopenta[a]phenanthren-12(2H)-one) whose concentration is 1.93% (line 18) isomer of sabinene (line 4; 1.90%), myrcene (line 6; 1.39%), camphene (line 3; 1.39%), alpha-campholenic aldehyde (line 9; 1.14%), 7-hexadecenal (line 17: 0.81%), and carvacrol (line 12: 0.67%).
The characteristics of compounds identified in GC-MS spectrum of AF are presented in Table 2. The results obtained indicate that AF gums have 13 likely compounds and from area normalization of lines in the spectrum, it is found that the most abundant component is alpha-bergamotene. Bergamotene is a sesquiterpenoid that is a component of a number of volatile oils; it functions as an insect repellent in plants. They are usually found as racemic pairs of the cis- and trans-isomer. However, the concentration of alpha-bergamotene in AF gum is very low (0.27%), the least of all its components.
In line 2, longicyclene (0.65%) was identified in the GC-MS spectrum. This compound has been found to be the first tetracycline sesquiterpene and was isolated from Pinus longifolia [28], suggesting that this compound has some pharmaceutical values. From the mass spectrum of the compound, 11 fragmentation peaks were identified under a mass peak value of 57.
1,4-Methanoazulene was found to be the most likely compound in lines 3 (9.15%) and 5 (0.66%) of the GC-MS spectrum of AF gum. 1,4-Methanoazulene is also called longifolene and is commercially categorized as polymer/resin and plastic indicating that the gum can be a good source of raw materials for the polymer industries. Present usage of longifolene includes but is not limited to perfumery chemicals, cosmetic products, soaps detergents, deodorants, and fabric products. Twelve (12) fragmentation peaks were identified in the mass spectrum of this compound 9 for both lines 3 and 5 and the mass peak values were 89 and 64, respectively.
In line 4, caryophyllene oxide (1.25%) was identified as the most likely compound (S1 = 95) in the GC-MS spectrum of AF gum. Caryophyllene oxide, an oxygenated terpenoid, well known as preservative in food, drugs, and cosmetics, has been tested in vitro as an antifungal agent against dermatophytes. Its antifungal activity was found to be comparable to that of ciclopiroxolamine and sulconazole, commonly used in onychomycosis treatment and chosen because of their very different chemical structures [29]. Mass peak value for this compound was 68 and 12 different fragmentation peaks characterized its mass spectrum.
Analysis of spectra obtained from AF gum indicated that, in line 6, 0.64% of hexadecanoic acid is the most likely compound that is present. Mass peak values of 72 and 16 fragmentation peaks were identified from these lines. 1-(p-Cumenyl)adamantane at concentration of 0.45% was identified as the most likely component in line 7 of the GC-MS spectrum of AF gum. The mass peak value for this fraction was 128 and 17 fragmentation peaks were also identified. 1-(p-Cumenyl)adamantine is adamantane derivative and has practical application as drugs, polymeric materials, and thermally stable lubricants. Adamantane is a colorless, crystalline chemical compound with a camphor-like odour. It is a cycloalkane and also the simplest diamondoid. Adamantane molecules consist of three cyclohexane rings arranged in the “armchair” configuration. It is used in some dry etching masks and polymer formulations.
Kauran-18-al (1.38%) was identified as the likely compound in line 8. Eighteen (18) fragmentation peaks were identified and the mass peak value was 150. In line 9, decahydro-1,1,4a-trimethyl-6-methylene-5-(3-methyl-2,4-pentadienyl)-naphthalene(labda-8(20)) was likely isolated from GC-MS of AF gum.
The most dominant fractions isolated from GC-MS spectrum of AF gum were found to be concentrated in lines 10 to 13. Compounds in lines 10, 11, 12, and 13 were gamma-elemene (11.97%), palustric acid (14.77%), 1-phenanthrene carboxylic acid (18.31%), and abietic acid (39.24%).
3.2. FTIR Study
Wave number and peaks of adsorption deduced from the respective FTIR spectra of KS and AF gums as well as the correlation area and concentrations are presented in Tables 3 and 4. The common features in the adsorption peaks of the gums studied are the appearance of bands and peaks that are typical of polysaccharides. The 2800–3000 cm−1 wave number range is associated with the stretching modes of C-H bonds of methyl groups (-CH3). The broad bands around 3400 cm−1 are consequence of the presence of -OH groups. However, in AF, -OH groups are is shifted to 3426.68 cm−1, and in KS gum, it is shifted to 3390.97 cm−1. The shifts may be due to dissociating carboxylic acid. The 900–1200 cm−1 range represents various vibrations of C-O-C glycosidic and C-O-H bonds.
| Wave number (cm−1) | Intensity | Area | Assignments |
|---|---|---|---|
| 786.02 | 45.47 | 28.83 | CH oop |
| 1033.88 | 22.71 | 58.13 | C-O stretch |
| 1245.09 | 22.78 | 56.12 | C-O stretch |
| 1377.22 | 23.52 | 42.07 | C-H scissoring and bending |
| 1457.27 | 23.43 | 46.35 | CH rock |
| 1704.17 | 21.57 | 29.46 | C=O stretch: carboxylic group |
| 2870.17 | 17.08 | 81.07 | C-H stretch |
| 2929.00 | 11.79 | 65.06 | CH- stretch |
| 3390.97 | 23.18 | 3.67 | OH stretch |
| Wave number (cm−1) | Intensity | Area | Assignments |
|---|---|---|---|
| 710.79 | 67.12 | 7.69 | C-H bend |
| 827.49 | 64.41 | 7.39 | C-H bend |
| 888.25 | 56.94 | 15.32 | C-H bend |
| 955.76 | 58.30 | 17.83 | C-H bend |
| 1027.13 | 60.25 | 11.39 | C-O stretch |
| 1185.30 | 52.15 | 10.84 | C-N stretch |
| 1276.92 | 39.14 | 35.31 | NO2 symmetric stretch |
| 1384.94 | 49.95 | 18.37 | NO2 symmetric stretch |
| 1461.13 | 45.91 | 19.79 | C-H bend |
| 1694.52 | 13.64 | 47.31 | C=C stretch |
| 2652.21 | 56.40 | 35.53 | -OH stretch |
| 2933.83 | 15.87 | 178.41 | C-H aliphatic stretch |
| 3426.66 | 54.33 | 10.71 | -OH stretch |
Of special interest to this study is the wave length range of 1500 and 1800 cm−1, typically used to detect the presence of carboxylic groups. In KS gum, phenyl ring substitution band was found at 1704.17 cm−1. Several adsorption bands were also found in the finger print regions (400–1500 cm−1) for AF.
3.3. Corrosion Studies
3.3.1. Weight Loss Study
- (i)
Possession of aromatic or long carbon chain that has heteroatom.
- (ii)
Presence of heteroatom(s) in the compound.
- (iii)
Presence of suitable functional groups (i.e., π-electron rich functional systems).
- (iv)
Presence of conjugated system.
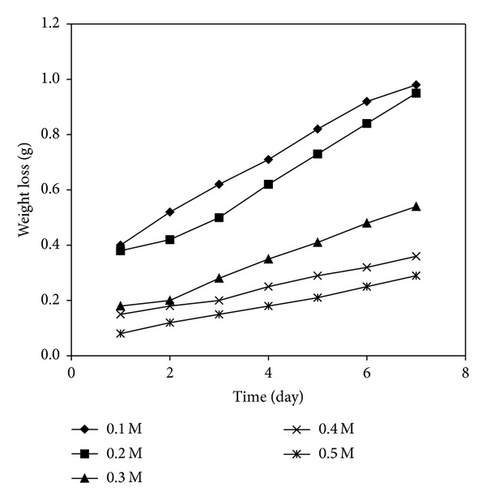
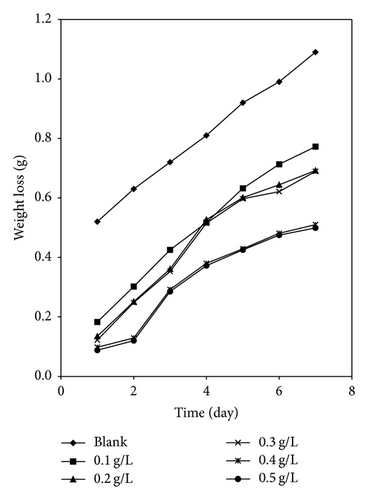
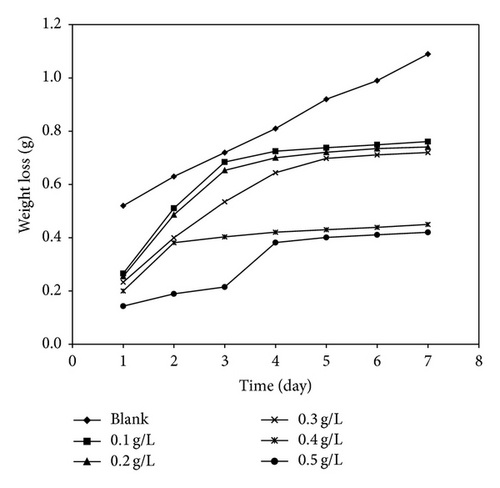
Figure 3 shows the variation of weight loss of mild steel with time for the corrosion of mild steel in various concentrations of HCl while Figures 4 and 5 present the variation of weight loss with time for the corrosion of mild steel at 303 K in 0.1 M HCl containing various concentrations of KS and AF gums, respectively. From the plots, it can be seen that weight loss of mild steel decreases with increase in the concentration of the gums indicating that KS and AF gums retarded the corrosion rate of mild steel in solutions of HCl. However, weight loss was also found to increase with increase in the period of contact. At 333 K (plots not shown), weight loss of mild steel was found to increase with increasing temperature indicating that the mechanism of inhibition of mild steel corrosion by AL gum is by physisorption [15]. Calculated values of corrosion rates of mild steel in various media obtained using (3) are recorded in Table 5. The results also indicate that the corrosion rate of mild steel in solutions of HCl increases with increasing time but decreases with increase in the concentration of the gums. These trends confirm that KS and AF gums are inhibitors for the corrosion of mild steel in solutions of HCl. Values of inhibition efficiencies of KS and AF gums for the corrosion of mild steel in solutions of HCl are also presented in Table 5. The result indicates that the inhibition efficiencies of the gums studied increase with increasing concentration. However, the inhibition efficiencies values obtained for KS gum were higher than that of the AF gum. This may be due to the fact that more compounds with heteroatoms were identified in the GCMS spectrum of KS gum compared to the AF gum. The presence of such compounds may have enhanced their adsorption on the metal surface and thereby blocking the surface and protecting the metal from corrosion. Inhibition efficiencies obtained at higher temperatures (Table 5) were lower than those for 303 K, indicating that the mechanism of adsorption of the inhibitor is physical adsorption [24, 31].
| System | Inhibition efficiency (%) | Corrosion rate (gh−1cm−2) | ||
|---|---|---|---|---|
| KS | AF | KS | AF | |
| Blank at 303 K | — | — | 0.000329 | 0.000329 |
| 0.1 g at 303 K | 58.75 | 43.53 | 0.000201 | 0.000282 |
| 0.2 g at 303 K | 62.93 | 48.05 | 0.000143 | 0.000221 |
| 0.3 g at 303 K | 71.16 | 53.93 | 0.000125 | 0.000219 |
| 0.4 g at 303 K | 77.37 | 55.91 | 0.000122 | 0.000176 |
| 0.5 g at 303 K | 82.56 | 66.80 | 0.000118 | 0.000168 |
| Blank at 333 K | — | — | 0.001863 | 0.001863 |
| 0.1 g at 333 K | 55.53 | 36.74 | 0.000917 | 0.001429 |
| 0.2 g at 333 K | 58.10 | 39.85 | 0.000803 | 0.001389 |
| 0.3 g at 333 K | 65.05 | 43.60 | 0.000676 | 0.001333 |
| 0.4 g at 333 K | 72.62 | 53.10 | 0.000648 | 0.001301 |
| 0.5 g at 333 K | 76.87 | 60.36 | 0.000581 | 0.001294 |
3.3.2. Gasometric Study
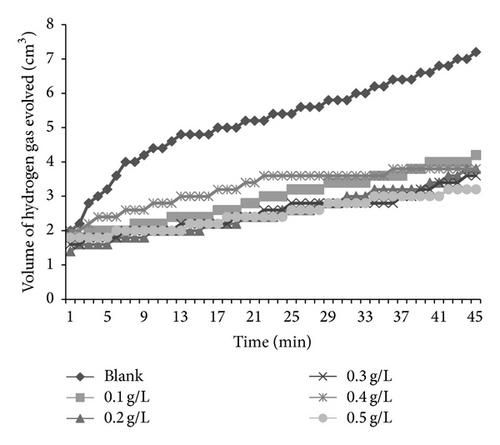
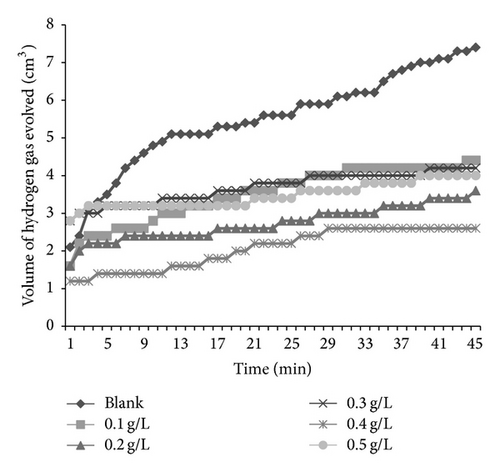
Figures 6 and 7 present plots for the variation of the volume of hydrogen gas evolved during the corrosion of mild steel in solution of HCl containing various concentrations of AF and KS, respectively. From the plots, it is generally evident that the volume of hydrogen gas evolved increases with increase in time but decreases with increase in the concentration of the respective inhibitors. This indicates that the corrosion of mild steel in 0.1 M HCl is inhibited by these inhibitors and that the inhibitors are adsorption inhibitors because their corrosion rates decrease with increase in concentration of the inhibitors [32]. At higher temperatures (333 K), plots obtained for the variation of volume of hydrogen gas with time (figure not shown) also reveal that the volume of hydrogen gas evolved increases with time but decreases with concentration of the added spices, which also indicate that the rate of corrosion of mild steel in 0.1 M HCl increases with time but decreases with increase in the concentration of the added inhibitors.
3.4. Effect of Temperature
| C (g/l) | Ea (kJ/mol) | Qads (kJ/mol) | |
|---|---|---|---|
| KS | Blank | 38.97 | — |
| 0.1 | 42.50 | –72.30 | |
| 0.2 | 48.31 | –63.79 | |
| 0.3 | 47.26 | –58.86 | |
| 0.4 | 46.75 | –64.15 | |
| 0.5 | 44.63 | –60.36 | |
| AF | 0.1 | 45.44 | –56.65 |
| 0.2 | 51.47 | –52.69 | |
| 0.3 | 50.57 | –47.85 | |
| 0.4 | 56.01 | –75.16 | |
| 0.5 | 57.16 | –57.76 | |
3.5. Thermodynamic/Adsorption Study
The values of surface coverage θ obtained from weight loss measurement corresponding to different concentrations of KS and AF at 303 and 333 K were fitted into different adsorption isotherms including those of Langmuir, Freundlich, Temkin, Flory Huggins, Frumkin, and El Awardy.

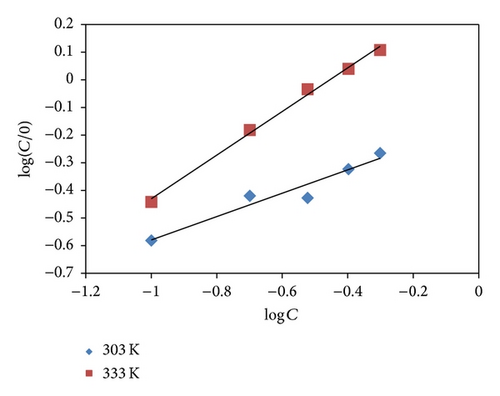
Adsorption parameters deduced from the plots are presented in Table 7. From the results obtained, it is evident that regression coefficient (R2) values and slopes of the plots are very close to unity confirming that the inhibitors exhibited a single-layer adsorption characteristic [37].
| Inhibitor | T (K) | Slope | logb | (kJ/mol) | R2 |
|---|---|---|---|---|---|
| KS | 303 | 0.7841 | 0.0288 | −33.95 | 0.9957 |
| 333 | 0.7911 | 0.0642 | −34.63 | 0.9928 | |
| AF | 303 | 0.7582 | 0.1338 | −35.96 | 0.9887 |
| 333 | 0.7002 | 0.1627 | −36.51 | 0.9715 | |
3.6. FTIR Study
Corrosion inhibitors are mostly compounds that have suitable functional groups in addition to the presence of heteroatoms. Based on these principles, almost all the chemical structures of compounds identified in the studied gums are potential corrosion inhibitors. The functional groups associated with the adsorption of the inhibitor onto the metal surface can be studied by comparing the FTIR spectra of the inhibitor before and after adsorption. When this is done, missing functional groups suggest adsorption. Frequencies and peaks of FTIR spectra of the corrosion product of mild steel when KS and AF gums were used as inhibitors are recorded in Tables 8 and 9.
| Peak (cm−1) | Intensity | Assignment (functional group) |
|---|---|---|
| 722.37 | 25.108 | C-H oop due to aromatic bond |
| 819.77 | 26.354 | C-H oop due to aromatic bond |
| 896.93 | 26.597 | N-H wag due to primary or secondary amines |
| 1026.16 | 24.095 | C-O stretch due to alcohol, carboxylic acids, esters, and ethers |
| 1220.98 | 24.462 | C-O stretch due to alcohol, carboxylic acids, esters, and ethers |
| 1381.08 | 22.733 | C-H rock due to alkane |
| 1600.97 | 20.221 | C=C aromatic stretch |
| 1902.84 | 20.51 | C-H stretch due to phenyl ring substitution |
| 1970.35 | 20.625 | C-H stretch due to phenyl ring substitution |
| 2170.95 | 19.653 | C≡C stretch |
| 2437.14 | 20.002 | OH stretch |
| 2600.13 | 19.521 | OH stretch |
| 3038.95 | 20.449 | =CH stretch due to alkene |
| 3144.07 | 21.063 | OH stretch due to carboxylic acid |
| 3289.7 | 21.852 | C≡C stretch |
| 3474.88 | 22.834 | OH stretch due to alcohol or phenol |
| 3607.97 | 22.261 | OH stretch (free hydroxyl) due to alcohol or phenol |
| Peak (cm−1) | Intensity | Area (cm2) | Assignment (functional group) |
|---|---|---|---|
| 872.82 | 40.031 | 36.912 | C-H oop due to aromatics |
| 1030.99 | 38.267 | 37.875 | C-O stretch due to alcohol, carboxylic acids, esters, or ethers |
| 1084.99 | 38.785 | 59.234 | C-O stretch due to alcohol, carboxylic acids, esters, or ethers |
| 1360.82 | 39.535 | 2.330 | NO2 symmetric stretch |
| 1466.91 | 38.277 | 2.010 | C-H scissoring and bending |
| 1635.69 | 34.353 | 2.236 | -C=C- stretch due to alkene |
| 3277.17 | 18.327 | 4.257 | OH stretch due to phenols and alcohols |
| 3444.98 | 17.393 | 7.301 | OH stretch due to phenols and alcohols |
From the adsorption band of KS gum and the corrosion product of mild steel when KS gum was used as an inhibitor, it is evident that the C-H “oop” at 786.02 was shifted to 819.77 cm−1; the C-O stretches at 1033.88 and 1245.09 were shifted to 1026.16 and 1220.98 cm−1, respectively, while the C-H rock at 1457.27 was shifted to 1381.08 cm−1. These shifts indicate that there is interaction between the inhibitor and the metal surface. However, the C-H rocking vibration at 1377.22, C=O stretch at 1704.17, OH stretch at 3390.97, and C-H stretches at 2870.17 and 2920.00 cm−1 were absent in the spectrum of the corrosion product suggesting that KS gum was adsorbed on mild steel surface through these functional groups.
On the other hand, the C-H oop vibration due to aromatics, N-H wagging vibrations due to primary amine, C-H rock due to alkane at 1381.08, C=C aromatic stretch, C-H stretches due to phenyl ring substitutions at 1902.84 and 1970.35, the C≡C stretch at 2170.95, OH stretches at 2437.14, 2600.13, 3144.07, 3474.88, and 3607.97, and =CH stretch at 3038.95 cm−1 were found in the spectrum of the corrosion product indicating that these functional groups were used in forming new bonds.
Comparison of the adsorption band of the corrosion product with that of AF gum revealed that the C-O stretch at 1027.13 was shifted to 1030.99 cm−1, the NO2 symmetric stretch at 1384.94 was shifted to 1360.82, the CH bend at 1461.13 was shifted to 1466.91 cm−1, the C=C stretch at 1694.52 was shifted to 1635.69 cm−1, and the OH stretch at 3426.66 was shifted to 3444.98 cm−1, which also indicate that there is an interaction between AF inhibitor and metal surface. However, the CH bends at 710.79, 827.49, 888.25, and 955.76 cm−1 as well as the C-N stretch at 1185.30 cm−1, NO2 symmetric stretch at 1276.92 cm−1, OH stretch at 2652.21 cm−1, and CH aliphatic stress at 2933.83 cm−1 were missing in the spectrum of the corrosion product indicating that these bonds were probably used in the adsorption of AF gum onto the metal surface. Also, the CH “oop” due to aromatics, the C-O stretch at 1084.99 cm−1, and the OH stretch at 3277.17 cm−1 were found in the spectrum of the corrosion product of mild steel indicating that these functional groups were used in forming new bonds between the metal surface and the inhibitor.
The analysis of the FTIR spectra indicates that the formation of multimolecular layers of adsorption between the inhibitor and mild steel is likely. This also supports the mechanism of physical adsorption. It is also possible that the gums inhibited the corrosion of mild steel by forming stable complexes between the metal and the inhibitors.
4. Conclusion
- (1)
GC-MS study reveals that the studied gums have some potential for use in the polymer and pharmaceutical industries as well as intermediates for other chemicals.
- (2)
Functional groups identified in the gums were found to be those typical for other carbohydrates.
- (3)
Albizia ferruginea and Khaya senegalensis were found to be good corrosion inhibitors for mild steel in acidic medium. However maximum inhibition efficiency was exhibited by Khaya senegalensis with 82.56% inhibition efficiency at 0.5% g/L concentration.
- (4)
The corrosion inhibition efficiencies of the inhibitors are dependent on the period of contact with the corrodent, concentration of the inhibitors, and the temperature.
- (5)
The inhibitors displayed progressive increase in efficiencies as the concentration increases, but a decrease with increasing temperature, which supported the mechanism of physical adsorption. The adsorption of the inhibitors was found to be exothermic and spontaneous and fitted the Langmuir adsorption model.
Conflict of Interests
The author declares that there is no conflict of interests regarding the publication of this paper.


