Probabilistic Structural Integrity Analysis of Boiling Water Reactor Pressure Vessel under Low Temperature Overpressure Event
Abstract
The probabilistic structural integrity of a Taiwan domestic boiling water reactor pressure vessel has been evaluated by the probabilistic fracture mechanics analysis. First, the analysis model was built for the beltline region of the reactor pressure vessel considering the plant specific data. Meanwhile, the flaw models which comprehensively simulate all kinds of preexisting flaws along the vessel wall were employed here. The low temperature overpressure transient which has been concluded to be the severest accident for a boiling water reactor pressure vessel was considered as the loading condition. It is indicated that the fracture mostly happens near the fusion-line area of axial welds but with negligible failure risk. The calculated results indicate that the domestic reactor pressure vessel has sufficient structural integrity until doubling of the present end-of-license operation.
1. Introduction
The reactor pressure vessels (RPVs) of nuclear power plant have to withstand the high pressure, high temperature, and neutron irradiation. During long-term operation, the fast neutron fluence causes the ferritic steel of RPV susceptible to brittle fracture, especially for the plate and weld materials in the beltline region corresponding to the reactor core. The embrittled vessel shell may fracture due to a preexisting fabrication flaw and leads to a through-wall crack. On the basis of operational safety of nuclear power plants in Taiwan, the regulatory body strictly requires the licensee to perform the in-service inspection (ISI) periodically and thoroughly on all shell welds according to the requirement of ASME Boiler and Pressure Vessel Code, Section XI. On the other hand, the surveillance capsules mounted in the reactor core used to assess the neutron fluence and radiation embrittlement of the RPV materials also need to be regularly drawn out, tested, and analyzed.
When evaluating the fracture behavior of RPV, the relevant parameters such as neutron irradiation, chemical composition of materials, and flaw characteristics are difficult to be accurately determined because of the uncertainties mainly from the inaccuracy of measurement or other undetermined factors. Therefore, evaluation based on deterministic method frequently makes conservative assumptions to envelop any potential uncertainties regarding multiple parameters and thus it inevitably produces an overconservative result. From the past two decades, the application of probabilistic fracture mechanics (PFM) has been widely applied to evaluate the structural integrity of RPV. The BWR Vessel and Internal Project (BWRVIP) and the United States Nuclear Regulatory Commission (USNRC) had utilized PFM to evaluate the fracture probabilities of boiling water reactor (BWR) pressure vessel shell welds and finally concluded that the in-service inspection (ISI) on the circumferential shell welds can be relieved conditionally [1, 2]. On the other hand, the USNRC’s new pressurized thermal shock (PTS) screening criteria for pressurized water reactor (PWR) pressure vessel were also determined by the PFM analysis results [3–5]. Using the Monte Carlo simulations, vessels can be sampled many times with random parameters affecting the fracture toughness of RPV materials based on the probability distribution functions. The probability of failure (POF) is determined from dividing the sum of total failure probability by the total number of iterations which have been performed.
In Taiwan, the PFM code, FAVOR (Fracture Analysis of Vessels-Oak Ridge) of Oak Ridge National Laboratory (ORNL), has been employed to perform the fracture probability analyses for domestic RPVs. A very conservative model based on the USNRC’s assumption used for regulation in 1998 [2] had been rebuilt to evaluate the structural integrity of the domestic BWR pressure vessels with their plant specific parameters [6, 7]. It was demonstrated that the domestic BWR pressure vessels can maintain adequate structural integrity even subjected to the specified worst accidental transient of low temperature overpressure (LTOP) event. However, the previous model was overconservative and so cannot reasonably represent the fracture mechanism of RPV. For example, the previous flaw model, the PVRUF-exponential best estimate distribution [2], assumed that all the preexisting flaws are surface breaking with a very conservative depth distribution. The flaw density of 108 flaws/vessel was assumed and all simulated surface breaking flaws were conservative with an aspect ratio of 10. As a matter of fact, it has been found that most preexisting fabrication flaws along the vessel wall are embedded with various aspect ratios. The flaw characteristics are mainly associated with the material types, welding process, bead size, and so on [8]. In the study, we aim at reanalyzing the fracture probability of a Taiwan domestic BWR pressure vessel by the more realistic model. First, a beltline region model which includes axial welds, circumferential welds, and plates of the domestic BWR pressure vessel was established for the advanced version of FAVOR code. Then, we utilized the VFLAW code developed by the Pacific Northwest National Laboratory (PNNL) in the United States [8] to generate the flaw files for FAVOR which describe the flaw characteristics of surface breaking flaws, weld embedded flaws, and plate embedded flaws. An improved radiation embrittlement correlation was also employed here. The transient of LTOP event was applied as the loading condition as the worst-case accident. Two levels of radiation embrittlement of the RPV were considered. The analysis result in the paper could be a reference for the BWR operations in Taiwan.
2. Evaluation Methodology
- (1)
KI of the flaw tip is greater than in (1) for the temperature at the flaw tip ().
- (2)
A raising KI field, that is, the time-rate-of-change of KI is positive (dKI/dτ > 0).
- (3)
In a rising KI field, KI must exceed the previously established maximum value experienced by the flaw tip during the transient up to the current point in time under consideration (applied-KI(τ) > KI(max)(τ)).
The IGA submodel in FAVPFM is complicated and will not be described here. The conditional probability of failure (CPF) is defined as CPI multiplied by the ratio that the initiated flaw propagates to 90% vessel wall thickness.
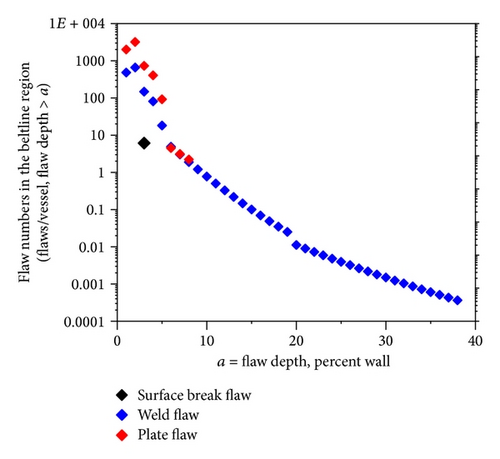
For the flaw distribution in the analysis, we utilized the PNNL’s VFLAW code to generate the surface breaking flaw file, S.dat, weld embedded flaw file, W.dat, and plate embedded flaw file, P.dat, for FAVOR [8]. These files describe the flaw characteristics such as location, size, and aspect ratio. The corresponding parameters based on the RPV fabrication input for VFLAW are listed in Table 1, and the mean flaw number distributions of the RPV beltline region against the percentage of the vessel wall thickness simulated by 1000 Monte Carlo simulations of VFLAW are shown in Figure 1. FAVOR classifies all simulated flaws into three categories: Flaw Category 1: the surface breaking flaws; Flaw Category 2: the embedded flaws which exist in the base material between the clad/base interface and (1/8)t; and Flaw Category 3: the embedded flaws in the base material between (1/8)t and (3/8)t. FAVOR assumes inner Category 1 flaws are circumferentially oriented based on the vessel fabrication, which has austenitic stainless-steel cladding applied to the inner surface of the vessel. Weld embedded flaws in axial welds are oriented axially and in circumferential welds are oriented circumferentially. As for the plate embedded flaws, they are 50% for axially oriented and 50% for circumferentially oriented, respectively [9, 14]. In addition, the Flaw Population Option 3 of the FAVOR which allocates the flaw tips throughout the entire wall thickness from inner to outer surface was used. In the option, the external surface breaking flaws will be equally divided between axial and circumferential orientations.
| Flaw type | Input parameters | |||
|---|---|---|---|---|
| Bead size (mm) | Clad bead width (mm) | Number of clad layers | Truncation of flaw depth (mm) | |
|
3.175 | 20 | 2 | 200 |
| Material type | Area fraction (%) | Bead size (mm) | Truncation of flaw depth (mm) | |
|
SAW | 93 | 6.5 | 25 |
| SMAW | 5 | 3.5 | 25 | |
| Repair | 2 | 3.5 | 50 | |
| Material type | Volume fraction (%) | Bead size (mm) | Truncation of flaw depth (mm) | |
|
SAW | 93 | 6.5 | 11 |
| SMAW | 5 | 3.5 | 11 | |
| Repair | 2 | 3.5 | 11 | |
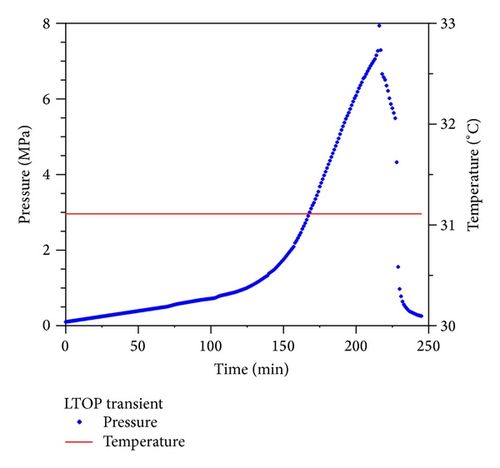
The loading condition in the study is a recorded low temperature overpressure (LTOP) accident that actually happened in a BWR plant. It was a beyond design basis event. According to the recorded data, the temperature remained constant of 88°F (33°C) and the pressure reached 1,150 psi (7.94 MPa) at most. The USNRC has evaluated the occurrence frequency as 1 × 10⁻³/year [2]. The pressure and temperature histories of the LTOP transient input for FAVLoad are shown in Figure 2. Even though the LTOP has never happened in the United States, the USNRC still concluded that the event may severely influence the BWR pressure vessel integrity and should be strictly prevented. According to the description of [2], the event happened in 1989 while the reactor was at a cold shutdown state in a refueling outage. A series of operator errors and malfunctions resulted in the control rod drive (CRD) pump continuing to run until an alarm level was exceeded. Meanwhile, the safety relief valve (SRV), the reactor water cleanup (RWCU), and the vessel head vent pipe were administratively blocked and could not be opened rapidly, which led to the LTOP accident eventually. In general, the event represents the greatest challenge of BWRs as a conservative condition to evaluate the structural integrity and operational stability. The resulting CPI and CPF from FAVOR analyses represent the conditional probability due to LTOP event and should be multiplied by 1 × 10⁻³/year to estimate the potential risk of a BWR pressure vessel during operation.
3. PFM Model for the BWR Pressure Vessel
Above, f is the neutron fluence (1019 n/cm2, E > 1 MeV) at the flaw tip, fsurf is the neutron fluence at the inner wetted surface, and x is the depth between the flaw tip (in inches) and inner surface. The elements of chemical composition that make steel susceptible to radiation embrittlement are cooper (Cu), nickel (Ni), manganese (Mn), and phosphorus (P). Table 2 lists the embrittled-relative properties including the initial RTNDT and chemical compositions of each beltline region material provided by the manufacturer [16]. FAVOR assumes that the embedded weld flaws are all distributed in the fusion-line area at the boundaries between a weld and its adjacent plates. The RTNDT at each flaw tip in the fusion-line area will be determined from the highest one sampled between the weld and its adjacent plates [9].
| Material ID | Major region | Cu (%) | Ni (%) | P (%) | Mn (%) | Initial RTNDT (°C) | |
|---|---|---|---|---|---|---|---|
| Axial welds | W-1001-07 | 1 | 0.14 | 0.34 | 0.011 | 1.2 | −44.4 |
| W-1001-08 | 2 | 0.14 | 0.34 | 0.011 | 1.2 | −44.4 | |
| W-1001-09 | 3 | 0.14 | 0.34 | 0.011 | 1.2 | −44.4 | |
| W-1001-10 | 4 | 0.14 | 0.88 | 0.012 | 1.31 | −44.4 | |
| W-1001-11 | 5 | 0.14 | 0.88 | 0.012 | 1.31 | −44.4 | |
| W-1001-12 | 6 | 0.14 | 0.88 | 0.012 | 1.31 | −44.4 | |
| Circumferential weld | W-1102-3 | 7 | 0.14 | 0.85 | 0.013 | 1.21 | −45.6 |
| Plates | SC-03-S3 | 8 | 0.09 | 0.58 | 0.013 | 1.50 | 6.7 |
| SC-03-S2 | 9 | 0.08 | 0.57 | 0.015 | 1.43 | −12.2 | |
| SC-03-S1 | 10 | 0.10 | 0.57 | 0.010 | 1.40 | −1.1 | |
| SC-04-S1 | 11 | 0.12 | 0.59 | 0.012 | 1.42 | −12.2 | |
| SC-04-S3 | 12 | 0.16 | 0.56 | 0.011 | 1.48 | −12.2 | |
| SC-04-S2 | 13 | 0.14 | 0.56 | 0.011 | 1.48 | −12.2 | |
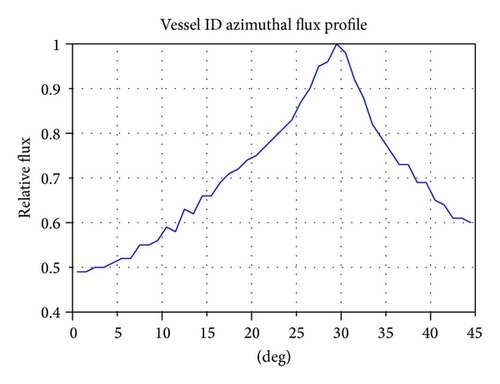
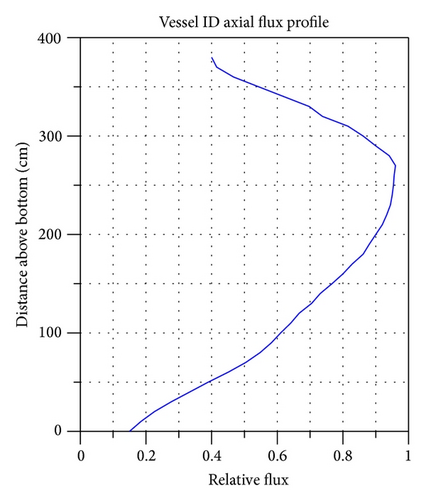
Figure 4 illustrates the normalized fast neutron flux profiles by eighth core symmetry along the circumferential direction of the RPV inner surface at 106.3 inches (270 cm) above the bottom of the active fuel (BAF). The normalized neutron flux variation along the vertical direction at 28.5° is shown in Figure 5. The maximum value of fast neutron flux in the beltline region was determined to be 8.46 × 10⁸ n/cm2-s [16]. Hence, considering 80% capacity factor of the BWR, the maximum fast neutron fluence in the beltline region after 32 effective full power years (EFPY), which is the end of present 40-year license, can be calculated to be 0.0854 × 10¹⁹ n/cm2. Also, the double irradiation of life extension operation for 64 EFPY was also considered in the study.
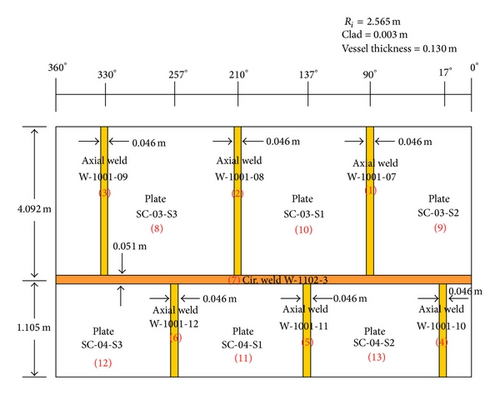
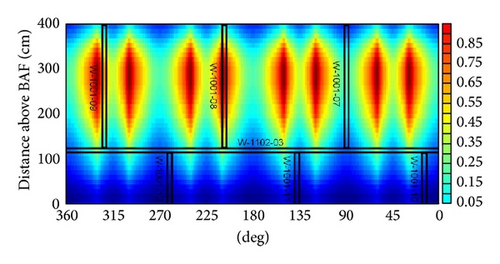
According to the neutron flux profiles along different directions, the neutron fluence distribution on the beltline region can be obtained. Figure 6 shows the normalized neutron flux map of the beltline region. The maximum values of 32 and 64 EFPY neutron fluence of each major region are listed in Table 3. For axial welds, the highest ratio of irradiation is 0.99 on W-1001-08. In contrast, the circumferential weld is subject to much lower neutron irradiation. The upper and lower plates were conservatively assumed to suffer from the 100% and 55% values of maximum neutron irradiation, respectively. The beltline region model which consists of various embrittlement-relative properties and neutron irradiations was written in the input file of FAVPFM.
| Material ID | Major region | Ratio to max. neutron flux |
Neutron fluence for 32 EFPY a (1019 n/cm2) |
Neutron fluence for 64 EFPY a (1019 n/cm2) |
|
|---|---|---|---|---|---|
| Axial welds | W-1001-07 | 1 | 0.49 | 0.0478 | 0.0956 |
| W-1001-08 | 2 | 0.99 | 0.0845 | 0.1690 | |
| W-1001-09 | 3 | 0.66 | 0.0564 | 0.1128 | |
| W-1001-10 | 4 | 0.39 | 0.0333 | 0.0666 | |
| W-1001-11 | 5 | 0.278 | 0.0237 | 0.0474 | |
| W-1001-12 | 6 | 0.505 | 0.0431 | 0.0862 | |
| Circumferential weld | W-1102-3 | 7 | 0.561 | 0.0479 | 0.0958 |
| Plates | SC-03-S3 | 8 | 1.00 | 0.0854 | 0.1708 |
| SC-03-S2 | 9 | 1.00 | 0.0854 | 0.1708 | |
| SC-03-S1 | 10 | 1.00 | 0.0854 | 0.1708 | |
| SC-04-S1 | 11 | 0.55 | 0.0470 | 0.0940 | |
| SC-04-S3 | 12 | 0.55 | 0.0470 | 0.0940 | |
| SC-04-S2 | 13 | 0.55 | 0.0470 | 0.0940 | |
- aThe maximum values are 0.0854 × 10¹⁹ n/cm2 and 0.1708 × 10¹⁹ n/cm2 for 32 EFPY and 64 EFPY, respectively.
4. Results and Discussion
The values of mean RTNDT of each beltline region material projected by Eason’s correlation [4, 14] are listed in Table 4. It can be seen that the RTNDT values of plates are much higher than weld materials and therefore control the fracture properties of fusion-line area. For example, the fracture toughness of the axial weld W-1001-07 is dominated by its adjacent plate SC-03-S1 which has higher RTNDT for 32 EFPY condition. Table 5 arranges the PFM analysis results of the RPV and by each beltline region material. 1,000,000 Monte Carlo simulations were performed and based on the flaw files around 9.2 billion flaws were sampled during the analyses to obtain the convergent solution. Each CPI and CPF should be multiplied by 1 × 10⁻³/year the occurrence frequency of LTOP event to calculate the frequency of crack initiation (FCI) and through-wall cracking frequency (TWCF) of the vessel, respectively. Therefore, the FCI are 1.38 × 10⁻¹⁰/year and 4.13 × 10⁻¹⁰/year for 32 EFPY and 64 EFPY under LTOP event, and the corresponding TWCFs are around 1.30 × 10⁻¹⁰/year and 3.85 × 10⁻¹⁰/year, respectively. The small difference between the CPI and CPF is ascribed to the simpler pressure and temperature histories of LTOP transient without a rapid cooling or pressure fluctuations that may take place in PWR. Since the computed TWCFs are much lower than the specified acceptable risk of 10−6/year of 10 CFR 50.61a, we can say that the domestic BWR pressure vessel has good structural integrity even for doubling of the present license of operation. From Table 5, it is also seen that the fracture mainly occurs from the axial welds and W-1001-08 contributes the most failure risk. There are merely tiny portions of both crack initiation and propagation presented by the circumferential weld W-1102-3, and no fractures happen on plates. Table 6 shows the fractions of CPI and CPF from the plates with controlling embrittlement-related properties for the fracture behavior of all major regions. It is found that the embrittlement-related properties of major region 8 (plate SC-03-S3) dominate the fracture behavior of RPV. Therefore, the axial welds with fusion-line area adjacent to the plate present higher fracture probability than others.
| Material ID | Major region | RTNDT for 32 EFPY | Control region | RTNDT for 64 EFPY | Control region | |
|---|---|---|---|---|---|---|
| Axial welds | W-1001-07 | 1 | −23.82 | 10 | −15.32 | 10 |
| W-1001-08 | 2 | −17.32 | 8 | −9.96 | 8 | |
| W-1001-09 | 3 | −21.01 | 8 | −12.93 | 8 | |
| W-1001-10 | 4 | −21.51 | 12 | −5.35 | 12 | |
| W-1001-11 | 5 | −26.27 | 13 | −11.58 | 13 | |
| W-1001-12 | 6 | −17.46 | 12 | −0.56 | 12 | |
| Circumferential weld | W-1102-3 | 7 | −16.69 | 8 | 0.06 | 8 |
| Plates | SC-03-S3 | 8 | 24.88 | — | 31.73 | — |
| SC-03-S2 | 9 | 3.56 | — | 9.62 | — | |
| SC-03-S1 | 10 | 18.41 | — | 25.53 | — | |
| SC-04-S1 | 11 | 7.79 | — | 17.51 | — | |
| SC-04-S3 | 12 | 15.34 | — | 27.53 | — | |
| SC-04-S2 | 13 | 11.36 | — | 22.19 | — | |
| Material ID | 32 EFPY | 64 EFPY | |||||||
|---|---|---|---|---|---|---|---|---|---|
| Total CPI a | Total CPF a | Total CPI a | Total CPF a | ||||||
| 1.38 × 10⁻⁷ | 1.30 × 10⁻⁷ | 4.13 × 10⁻⁷ | 3.85 × 10⁻⁷ | ||||||
| % of CPI | CPI | % of CPF | CPF | % of CPI | CPI | % of CPF | CPF | ||
| Axial welds | W-1001-07 | 5.33 | 7.36 × 10⁻⁹ | 5.45 | 7.09 × 10⁻⁹ | 7.64 | 3.16 × 10⁻⁸ | 7.90 | 3.04 × 10⁻⁸ |
| W-1001-08 | 45.37 | 6.26 × 10⁻⁸ | 44.65 | 5.80 × 10⁻⁸ | 38.38 | 1.59 × 10⁻⁷ | 37.13 | 1.43 × 10⁻⁷ | |
| W-1001-09 | 25.92 | 3.58 × 10⁻⁸ | 25.35 | 3.30 × 10⁻⁸ | 23.68 | 9.78 × 10⁻⁸ | 23.25 | 8.95 × 10⁻⁸ | |
| W-1001-10 | 15.82 | 2.18 × 10⁻⁸ | 16.78 | 2.18 × 10⁻⁸ | 17.01 | 7.03 × 10⁻⁸ | 18.22 | 7.01 × 10⁻⁸ | |
| W-1001-11 | 0 | 0 | 0 | 0 | 0.21 | 8.67 × 10⁻¹⁰ | 0.21 | 8.09 × 10⁻¹⁰ | |
| W-1001-12 | 7.53 | 1.04 × 10⁻⁸ | 7.75 | 1.01 × 10⁻⁸ | 12.97 | 5.36 × 10⁻⁸ | 13.23 | 5.09 × 10⁻⁸ | |
| Circumferential weld | W-1102-3 | 0.04 | 5.52 × 10⁻¹¹ | 0.01 | 1.30 × 10⁻¹¹ | 0.11 | 4.54 × 10⁻¹⁰ | 0.05 | 1.93 × 10⁻¹⁰ |
| Plates | SC-03-S3 | 0 | 0 | 0 | 0 | 0 | 0 | 0 | 0 |
| SC-03-S2 | 0 | 0 | 0 | 0 | 0 | 0 | 0 | 0 | |
| SC-03-S1 | 0 | 0 | 0 | 0 | 0 | 0 | 0 | 0 | |
| SC-04-S1 | 0 | 0 | 0 | 0 | 0 | 0 | 0 | 0 | |
| SC-04-S3 | 0 | 0 | 0 | 0 | 0 | 0 | 0 | 0 | |
| SC-04-S2 | 0 | 0 | 0 | 0 | 0 | 0 | 0 | 0 | |
- aThe conditional probabilities should be multiplied by 10−3/year (the occurrence frequency of LTOP transient) to determine the fracture and failure frequencies per year.
| Major region | Material ID | 32 EFPY | 64 EFPY | ||||||||
|---|---|---|---|---|---|---|---|---|---|---|---|
| Total CPI a | Total CPF a | Control weld | Total CPI a | Total CPF a | Control weld | ||||||
| 1.38 × 10⁻⁷ | 1.30 × 10⁻⁷ | 4.13 × 10⁻⁷ | 3.85 × 10⁻⁷ | ||||||||
| % of CPI | CPI | % of CPF | CPF | % of CPI | CPI | % of CPF | CPF | ||||
| 8 |
|
71.32 | 9.84 × 10⁻⁸ | 70.62 | 9.18 × 10⁻⁸ | W-1001-08, W-1001-09, W-1102-3 | 62.17 | 2.57 × 10⁻⁷ | 60.43 | 2.33 × 10⁻⁷ | W-1001-08, W-1001-09, W-1102-3 |
| 10 |
|
5.33 | 7.36 × 10⁻⁹ | 5.45 | 7.09 × 10⁻⁹ | W-1001-07 | 7.64 | 3.16 × 10⁻⁸ | 7.90 | 3.04 × 10⁻⁸ | W-1001-07 |
| 12 |
|
23.34 | 3.22 × 10⁻⁸ | 24.53 | 3.19 × 10⁻⁸ | W-1001-10, W-1001-12 | 29.98 | 1.24 × 10⁻⁷ | 31.45 | 1.21 × 10⁻⁷ | W-1001-10, W-1001-12 |
| 13 |
|
0 | 0 | 0 | 0 | W-1001-11 | 0.21 | 8.67 × 10⁻¹⁰ | 0.21 | 8.09 × 10⁻¹⁰ | W-1001-11 |
- aThe conditional probabilities should be multiplied by 10−3/year (the occurrence frequency of LTOP transient) to determine the fracture and failure frequencies per year.
On the other hand, the CPI and CPF fractions by the flaw category for 32 and 64 EFPY are arranged in Table 7. It can be seen that the crack initiation mainly occurs from the inner Category 2 flaws, but with tiny effects from the inner Category 1 and outer Category 3 flaws. Finally, only inner flaws of Category 2 and much less inner flaws of Category 1 grow through the vessel wall under the LTOP transient. The reason can be attributed to the fact that the temperature remains constant during LTOP transient, so the thermal tensile stress along the vessel wall is negligible. The fracture behavior under LTOP transient is controlled by pressure-induced membrane stresses and embrittled material. As a result, it can be said that in the domestic RPV beltline region the crack initiates and propagates from the internal embedded flaws in axial welds, but the embrittlement-related properties are controlled by their adjacent plates.
| Flaw category | 32 EFPY | 64 EFPY | |||||||
|---|---|---|---|---|---|---|---|---|---|
| Total CPI a | Total CPF a | Total CPI a | Total CPF a | ||||||
| 1.38 × 10⁻⁷ | 1.30 × 10⁻⁷ | 4.13 × 10⁻⁷ | 3.85 × 10⁻⁶ | ||||||
| % of CPI | CPI | % of CPF | CPF | % of CPI | CPI | % of CPF | CPF | ||
| Flaw Category 1 | Inner | 0.08 | 1.10 × 10⁻¹⁰ | 0.03 | 3.90 × 10⁻¹¹ | 0.20 | 8.26 × 10⁻¹⁰ | 0.08 | 3.08 × 10⁻¹⁰ |
| Outer | 0 | 0 | 0 | 0 | 0 | 0 | 0 | 0 | |
| Flaw Category 2 | Inner | 94.67 | 1.31 × 10⁻⁷ | 99.97 | 1.30 × 10⁻⁷ | 93.52 | 3.86 × 10⁻⁷ | 99.92 | 3.85 × 10⁻⁶ |
| Outer | 0 | 0 | 0 | 0 | 0 | 0 | 0 | 0 | |
| Flaw Category 3 | Inner | 0 | 0 | 0 | 0 | 0 | 0 | 0 | 0 |
| Outer | 5.25 | 7.25 × 10⁻⁹ | 0 | 0 | 6.28 | 2.59 × 10⁻⁸ | 0 | 0 | |
- aThe conditional probabilities should be multiplied by 10−3/year (the occurrence frequency of LTOP transient) to determine the fracture and failure frequencies per year.
5. Conclusion
A series of PFM analyses were conducted to evaluate the fracture probability of a Taiwan domestic BWR pressure vessel subjected to a prescribed LTOP transient. At first, the PFM model including the configuration of beltline region and the plant specific parameters of the domestic BWR pressure vessel was built for PFM FAVOR code. The PNNL’s VFLAW code was employed to generate flaw files which include the surface breaking flaws, weld embedded flaws, and plate embedded flaws. The analyzed failure risks of the BWR pressure vessel for 32 EFPY and 64 EFPY conditions are merely 1.30 × 10⁻¹⁰/year and 3.85 × 10⁻¹⁰/year, respectively, both much lower than the acceptable risk of 10−6/year. The fracture occurs from the preexisting fabrication flaws along the inner fusion-line area of beltline axial welds, and the corresponding properties of fracture are controlled by the adjacent plates. The analyzed results demonstrate that the domestic BWR pressure vessel can maintain sufficient structural integrity until either the present end-of-license or doubling of the present license of operation.
Conflict of Interests
The authors declare that there is no conflict of interests regarding the publication of this paper.
Acknowledgments
This work was supported by the Taiwan Power Company under Contract no. 054010000101. The support is greatly acknowledged. The authors are also grateful to Mr. Terry L. Dickson, senior researcher in the Oak Ridge National Laboratory, for the technical support and discussions.


