Adsorption of Organic Dyes by TiO2@Yeast-Carbon Composite Microspheres and Their In Situ Regeneration Evaluation
Abstract
TiO2@yeast-carbon microspheres with raspberry-like morphology were fabricated based on the pyrolysis method. The obtained products were characterized by field emission scanning electron microscopy (FE-SEM), energy dispersive spectrometry (EDS), and X-ray diffraction (XRD). Effects of initial dye concentration and contact time on adsorption capacity of TiO2@yeast-carbon for cationic dye methylene blue (MB) and anionic dye congo red (CR) were investigated. Experimental data were described by Langmuir, Freundlich, Temkin, and Koble-Corrigan isotherm models, respectively. It was found that the equilibrium data of MB adsorption were best represented by Koble-Corrigan, and CR adsorption was best described by both Freundlich and Koble-Corrigan isotherm models. The kinetic data of MB and CR adsorption fitted pseudo-second-order kinetic model well. The results demonstrated that TiO2@yeast-carbon microspheres achieved favorable removal for the cationic MB in comparison with that for the anionic CR. In addition, regeneration experimental results showed that TiO2@yeast-carbon exhibited good recycling stability, reusability, and in situ renewability, suggesting that the as-prepared TiO2@yeast-carbon might be used as the potential low cost alternative for recalcitrant dye removal from industrial wastewater. One possible mechanism for regenerating dye-loaded TiO2@yeast in situ was also proposed.
1. Introduction
Organic dyes are widely and frequently used in various industries as textile, printing, petroleum, paper, and rubber [1, 2]. During the manufacturing and dyeing process, a substantial amount of dyestuff is lost into water, which poses a great threat to the environment. Typically, the presence of these toxic organic compounds reduces light penetration into water, affects photosynthesis of aquatic lives, impedes the growth of microbes, creates toxicity to fish, accumulates in the food chain, and even travels long distance, causing harm not only to the place where they are produced and used but also globally [3]. Moreover, most of the organic dyes are recalcitrant and difficult to degrade because of their complex and stable aromatic molecular structure [4]. Hence, the removal or degradation of organic dyes from water bodies has become a major environmental problem. Till now, some physical or chemical strategies have been attempted to remove dye contaminants from water, including adsorption [5], advanced oxidation process (AOP) [6], membrane filtration [7], ozonation [8], and coagulation-flocculation [9]. Among the above-mentioned technologies, adsorption has been proven to be one of the most efficient and reliable methods for removing dyes from aqueous solution because of its flexibility, high efficiency, ease of operation, simplicity of design, and insensitivity to toxic pollutants [10]. A wide variety of low cost and easily available materials, such as bentonite [11], fly ash [12], clay [13], active carbon [14], and agriculture wastes [15, 16], have been exploited for the removal of dyes from aqueous solutions.
Yeast-carbon is a porous and amorphous solid carbon material, which is derived mainly from baker’s yeast. For example, Nacco and Aquarone [17] firstly reported the fabrication of yeast-carbon by carbonizing yeast cells in gas-heated muffle. The prepared yeast-carbon exhibited larger surface area. Guan et al. [18] synthesized amphiphilic porous hollow carbonaceous spheres via mild hydrothermal treatment of yeast cells and further pyrolyzing. The obtained carbon spheres displayed effective sorption of phenol from water. In comparison with the great successes in the yeast-carbon synthesis, the practical application of yeast-carbon as adsorbent in wastewater treatment has still been limited because the adsorbent could get saturated easily in the adsorption process, which requires extra regeneration or complete replacement [4]. More recently, TiO2 has become a hot topic mainly for its excellent photocatalytic performance [19]. The integration of adsorption and TiO2 photocatalysis seems to offer a good solution to overcome the shortcoming of extra regeneration or complete replacement from the traditional adsorption process. In such a synergetic process, the rich pore structure of adsorbents might promote the transfer and adsorption of organic dyes, while the TiO2 could destroy dyes by photocatalytic oxidation, thus regenerating the adsorbent in situ [20].
In the previous work, we fabricated the novel TiO2@yeast-carbon microsphere with raspberry-like morphology based on the pyrolysis method [21]. In the present work, as a continual job, the prepared hybrid raspberry-like TiO2@yeast-carbon microspheres were further used as adsorbents for removal of two typical organic dyes (Methylene blue and Congo red) from aqueous solution. The adsorption equilibrium isotherms and kinetics was fully conducted. Moreover, in situ regeneration of the adsorbents was investigated, and one possible mechanism for regenerating dye-loaded TiO2@yeast in situ was also proposed.
2. Materials and Methods
2.1. Materials
The powdered yeast was provided by Angel Yeast Co. TiO2 with the primary particle size at 20–30 nm was from Degussa and was used without further purification. Absolute ethanol and double-distilled water were used throughout all the experimental procedures. Methylene blue (MB) and Congo red (CR) were purchased from Xi’an Chemical Agent Company and were used as pollutants in the present work. Analytic grade sodium hydroxide (NaOH) and sulfuric acid (H2SO4) were purchased from Xi’an Chemical Agent Company.
2.2. Synthesis of TiO2@Yeast-Carbon Microspheres
In a typical synthesis procedure, 0.1 g of TiO2 was dissolved in 200 mL of distilled water, using ultrasonic vibration for 10 min, and the pH value was adjusted to approximately 9-10 by adding dropwise sodium hydroxide (1.0 mol/L). Then, the dispersion was stirred in magnetic stirrers for 30 min to facilitate particle deaggregation. In a separate vessel, 1.25 g yeast powder was washed with distilled water and absolute ethanol for three times, respectively. Subsequently, the yeast was dispersed in 200 mL of distilled water and magnetically stirred vigorously for 30 min, and the pH value was adjusted to approximately 3 with sulfuric acid (1.0 mol/L). After that, the above TiO2 and yeast cells were gathered by centrifugation from their own suspensions and redispersed in 200 mL of distilled water, respectively. Thereafter, TiO2 and yeast suspensions were slowly mixed with continuously magnetic stirring for 1.5 h at room temperature and left for 3.0 h without further stirring in order to ensure the formation of TiO2@yeast particles. The mixture was collected by centrifugation, washed with distilled water and absolute ethanol for three times, and then desiccated at 353 K for 1.0 h. Finally, the dried TiO2@yeast particles were calcined at 573 K in a nitrogen pipe furnace for 1.0 h and cooled to room temperature. After that, TiO2@yeast-carbon hybrid microspheres were obtained. For comparison, the yeast-carbon was prepared by similar method without adding TiO2.
2.3. Characterization
Surface structure and morphology of samples were observed by using Philip XL-30 field emission scanning electron microscope (FE-SEM). Detailed composition characterization was carried out with energy-dispersive spectroscopy (EDS) analysis. X-ray diffraction (XRD) patterns were conducted on X. Pert Pro diffractometer using Cu Kα radiation (λ = 0.15418 nm) at a scanning rate of 10°/min.
2.4. Dye Solution Preparation
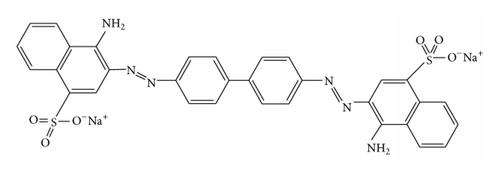
Methylene blue and Congo red were cationic and anionic dyes, respectively, and were used as model pollutants to study the adsorption properties of TiO2@yeast-carbon microspheres. The structures of both dyes are shown in Figure 1. Stock MB and CR solutions (1.0 g/L) were prepared by dissolving 1 g of MB or CR in 1 L of double distilled water, respectively. Experimental solutions of desired concentration were obtained by further dilution.

2.5. Analysis of Organic Dyes
The samples were separated from the solution at set intervals with centrifugation at 3000 rpm for 5 min and were returned to the reaction system immediately after each analysis. The concentrations of MB and CR in the supernatant solution were determined using a double beam UV/visible spectrophotometer (UV-752, Shanghai) at 666.4 nm and 499.0 nm, respectively. Calibration curve was found to be very reproducible and linear over the concentration range used in this work.
2.6. Batch Adsorption Experiments
2.7. In Situ Regeneration of TiO2@Yeast-Carbon Microspheres
3. Results and Discussion
3.1. Characterization
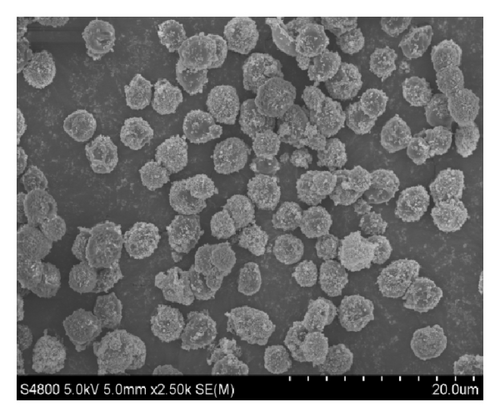
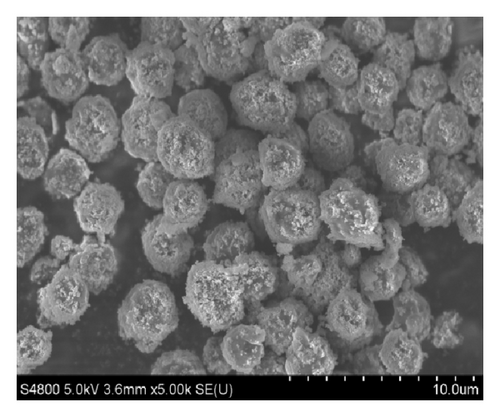
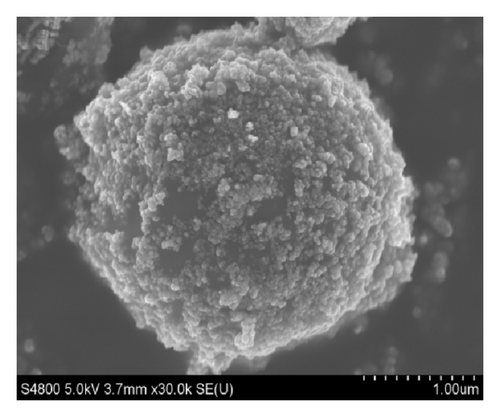
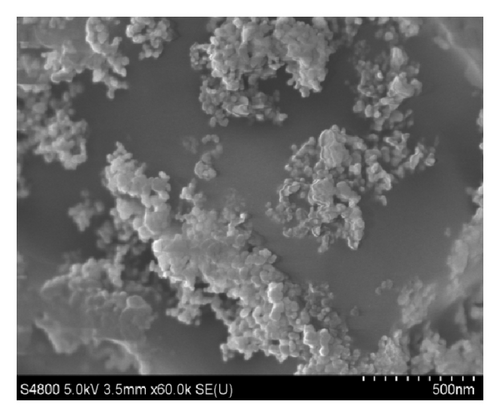
Figure 2(a) is the SEM images of yeast-carbon. It reveals that the yeast-carbon had smooth surface morphology and uniform size (length = 3.5 ± 0.4 μm; width = 2.3 ± 0.5 μm). Figure 2(b) depicts an image of the TiO2@yeast which is the precursor of TiO2@yeast-carbon. The size of TiO2@yeast (length = 3.7 ± 0.4 μm; width = 2.6 ± 0.5 μm) increased compared with the yeast-carbon in Figure 2(a), which may be assigned to the attachment of TiO2 particles. Figure 2(c) presents an overall image of the TiO2@yeast-carbon hybrid microspheres. The micrograph in Figure 2(c) indicates that the particles inherited the general shape and good dispersity of the precursor in Figure 2(b). Figures 2(d) and 2(e) expresses the TiO2@yeast-carbon spheres in different magnifications. The TiO2@yeast-carbon in Figure 2(d) exhibits a typical raspberry-like structure since the TiO2 nanoparticles were randomly decorated on the surface of carbon microspheres. Figure 2(f) displays the detailed information of the outer appearance of the TiO2@yeast-carbon microspheres under a higher magnification. It can be clearly seen that the surfaces of the microspheres were coated with small TiO2 particles, whereas some residual bare areas still remained. These residual bare regions were of great benefit to the adsorption of dye molecules in aqueous solution.
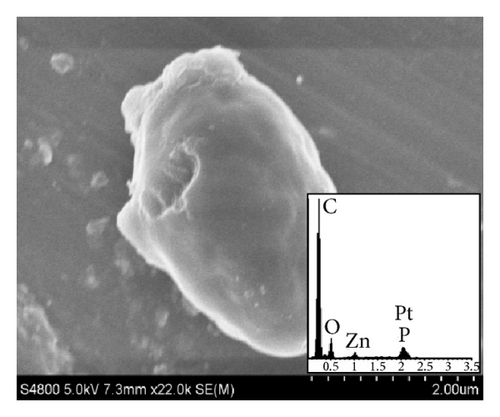
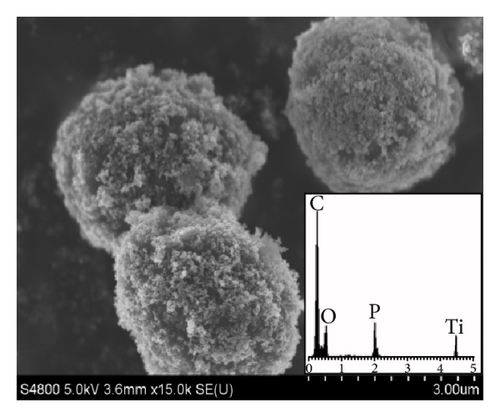
Additionally, the unique raspberry-like structure of TiO2@yeast-carbon is further confirmed from the EDS analysis. In the insert image in Figure 2(a), C, O, Zn, P, and Pt elements can be observed. C, O, and P result from the yeast cells, Zn element comes from the yeast cells activation agent ZnCl2, and Pt is assumed to be due to the metal spraying before SEM studies. C, O, P, and Ti elements are observed in the insert image in Figure 2(d). C, O, and P elements also derive from the yeast, and the Ti element detected indicates that TiO2 has been already successfully coated on the yeast carbon.
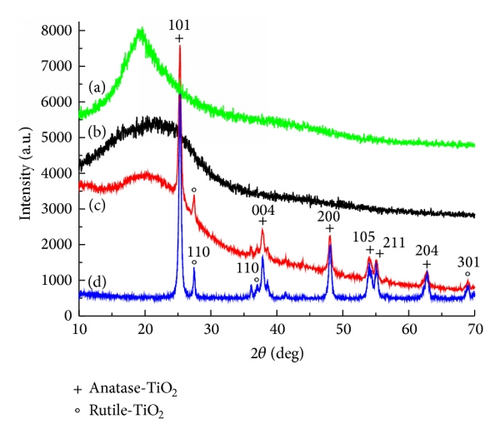
XRD patterns of TiO2, yeast, yeast-carbon, and TiO2@yeast-carbon are shown in Figure 3. Diffraction peaks at around 20° in Figures 3(a) and 3(b) indicate the formation of amorphous species. Figure 3(c) illustrates an XRD pattern of TiO2@yeast-carbon. The broad peak at 20° is mainly caused by the amorphous structure of yeast-carbon. Moreover, the remaining diffraction peaks are in good agreement with TiO2 in Figure 3(d) and no other diffraction peaks can be detected within the investigated range. Figure 3(d) exhibits the XRD pattern of the original components of TiO2 nanoparticles (P25 TiO2: 78% anatase-type TiO2 and 22% rutile-type TiO2). The observed sharper diffraction peaks at 25°, 37.9°, 48.2°, 54.8°, and 63.0° are consistent with diffraction peaks of anatase-type TiO2 (JCPDS. number: 21-1272) [22], and the other diffraction peaks centering at 69.0°, 70.3°, and 75.0° correspond well with the reflections of rutile-type TiO2 (JCPDS. number: 21-1276) [23].
3.2. Adsorption Capacity of MB and CR on TiO2@Yeast-Carbon
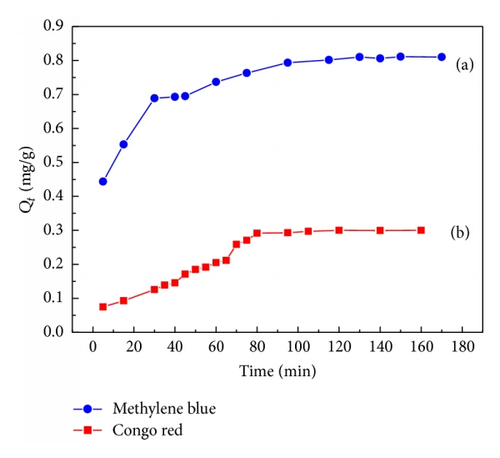
Figure 4 describes the measured isotherms for MB and CR on the TiO2@yeast-carbon samples at the same initial dye concentration. From Figure 4, Qt for MB and CR increased dramatically during the initial time. Then, MB and CR adsorption reached equilibrium at the time of about 80 and 130 min, respectively, which was similar to observations of Hameed et al. [24]. As shown in Figure 4, two adsorption stages existed obviously: a very rapid initial adsorption over a few minutes, followed by a longer period of much slower uptake. The rapid uptake at the initial contact time could be ascribed to the fact that there were plenty of available adsorption active sites on the surface of TiO2@yeast-carbon, while the slow rate of dye adsorption was probably due to the repulsive forces between the dye molecules in the solution and on the surface of the TiO2@yeast-carbon [25]. It can also be seen from Figure 4 that the adsorption capacity of cationic dye MB by TiO2@yeast-carbon was significantly higher than that of anionic dye CR, as manifested by the approximately 3-fold higher adsorption capacity of the CR, which could be assigned to the negatively charged surface of the adsorbent [21, 26]. Moreover, because the CR possesses more polar atoms (N and S), the interaction between CR and TiO2@yeast-carbon may be stronger than that between MB and TiO2@yeast-carbon. This may induce a collapse in the pore structure of TiO2@yeast-carbon and then create a sharp decrease in the adsorption capacity. It is noteworthy that the adsorption capacity of MB on TiO2@yeast-carbon is similar to that of Basic Green 5 measured by Juang et al. [27]. According to the adsorption results above, it is experimentally demonstrated that TiO2@yeast-carbon may be a good adsorbent for the removal of MB even if no chemical modification is taken.
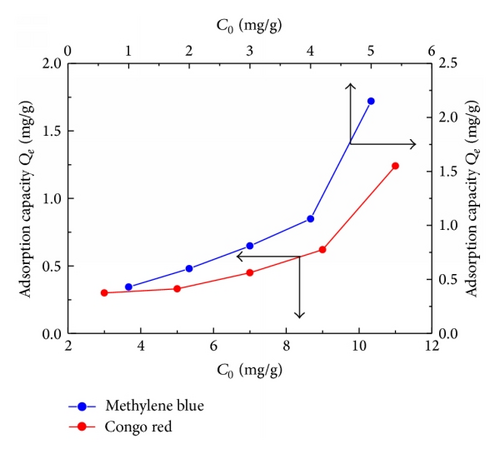
The favorable removal of cationic MB in comparison with the anionic CR by TiO2@yeast-carbon adsorbent can be further verified by changing of initial dye concentration. Figure 5 illustrates the influence of dye concentration on adsorption capacity of TiO2@yeast-carbon nanocomposite for MB and CR. As shown in Figure 5, the adsorption capacity for MB and CR augmented with the increase of dye concentration, which could be explained by the elevated concentration gradient between the bulk solution and the surface of the TiO2@yeast-carbon [25]. As presented in Figure 5, the adsorption of MB on TiO2@yeast-carbon showed higher capacity than CR within the investigated concentration. However, the adsorption capacity for MB or CR is sure to reach a constant if the dye concentration exceeds continuously because a certain amount of TiO2@yeast-carbon could only provide limited active adsorption sites.
3.3. Adsorption Isotherms
Adsorption isotherm models are important to investigate how adsorbates interact with adsorbents [28] and are widely used to describe the adsorption progress [10]. Langmuir, Freundlich, Temkin, and Koble-Corrigan isotherm models were used to fit the equilibrium data obtained from the study of MB and CR adsorption onto TiO2@yeast-carbon at initial concentrations of 1.0~5.0 mg/L and 3.0~11.0 mg/L, respectively.
A comparison of the adsorption experimental isotherms of MB onto the TiO2@yeast-carbon and theoretical plots of the Langmuir, Freundlich, Temkin, and Koble-Corrigan isotherm models was shown in Figure 6. Correlation coefficients and constants of the models were given in Table 1.
| Adsorption isotherm models | Constants | MB | CR |
|---|---|---|---|
| Langmuir isotherm | Qm (mg/g) | 2.20 | 1.62 |
| KL (l/mg) | 0.65 | 0.57 | |
| R2 | 0.6745 | 0.9128 | |
| RL | 0.2346 | 0.2597 | |
| Freundlich isotherm | 1/n | 0.630 | 0.655 |
| KF [(mg/g)
] |
0.840 | 0.033 | |
| R2 | 0.5832 | 0.9920 | |
| Temkin isotherm | A | 0.607 | 0.500 |
| B | 4.314 | 0.510 | |
| R2 | 0.7517 | 0.9134 | |
| Koble-Corrigan isotherm | AKC | 8.63 | 0.03 |
| BKC | 7.08 | 5.22 | |
| β | 4.20 | 1.54 | |
| R2 | 0.9745 | 0.9883 | |
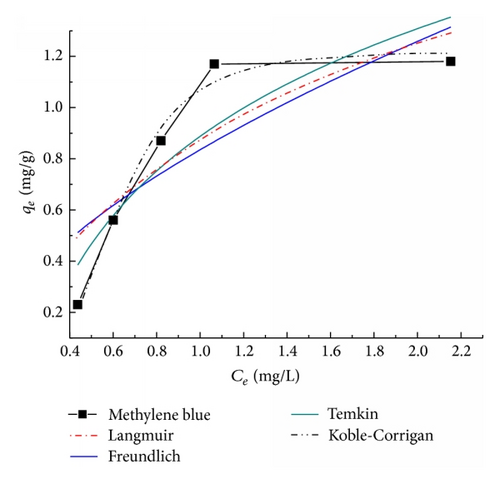
As can be seen from Figure 6, Koble-Corrigan isotherm plot was very close to the experimental data plot. Besides, it was observed in Table 1 that the value of R2 of Koble-Corrigan model (R2 > 0.97) was higher than those of Temkin, Langmuir, and Freundlich isotherm models, showing that Koble-Corrigan model was most suitable for the MB adsorption than the other models. This indicated that a combination of heterogeneous and homogeneous uptakes occurred in MB uptake by the synthesized TiO2@yeast-carbon. Meanwhile, comparing the coefficients of determination of the Langmuir and Freundlich models, we could infer that homogeneous uptake was the main mechanism of the MB adsorption process [38]. Moreover, the value of RL from the Langmuir isotherm was between 0 and 1, the Freundlich constant 1/n was smaller than 1, and the value β in Koble-Corrigan model is over 1, indicating that the adsorption of MB onto TiO2@yeast-carbon was a favorable adsorption process.
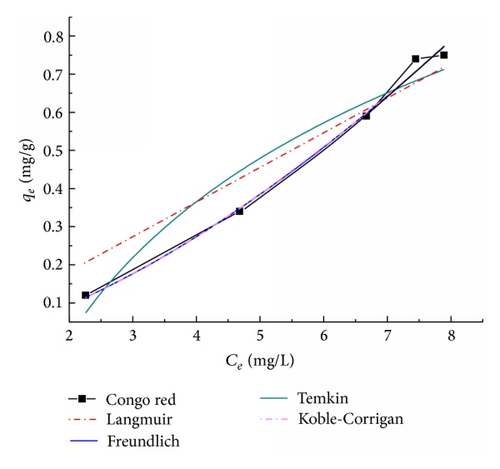
Figure 7 typically showed the adsorption isotherms of CR onto the TiO2@yeast-carbon. The parameters of the isotherm equations were summarized in Table 1. It was shown in Figure 7 that both Koble-Corrigan and Freundlich models are suitable for CR adsorption process. From Figure 7, the low deviation between the calculated behavior and experimental plot had been observed. This fitting result can be explained by the presence of competition between adsorbate molecules for the adsorption sites on the surface [36]. The higher value of R2 in Table 1 from Freundlich model than Koble-Corrigan model implied that Freundlich model fitted the most exactly. In contrast, the RL value obtained from the Langmuir model, the Freundlich constant (1/n), and the value β from Koble-Corrigan model exhibited the same tendency as those for MB adsorption above, representing that the adsorption of CR on the TiO2@yeast-carbon was favorable.
The above analyses showed that the Koble-Corrigan model yields a better fit of MB than the other models. CR adsorption on the TiO2@yeast-carbon microspheres conforms well to Freundlich and Koble-Corrigan models. Namely, the Koble-Corrigan model fitted both MB and CR adsorption well. In addition, constants of AKC and BKC from Koble-Corrigan model are indicators of adsorption capacity and affinity of the adsorbent [36]. The values of Kolbe-Corrigan constant AKC were 8.63 and 0.03 and those of BKC were 7.08 and 5.22 for MB and CR, respectively. The greater AKC and BKC values for MB indicated higher MB adsorption capacity, affinity, and intensity compared to CR adsorption onto TiO2@yeast-carbon microspheres. This phenomenon was in accordance with the result illustrated in Figure 4, which may be attributed to the different active functional groups in MB and CR molecules [39], revealing that the TiO2@yeast-carbon microspheres can be served as a promising adsorptive material for MB.
Since adsorption isotherm is basically important to describe how adsorbates interact with adsorbents, some researchers had also investigated the best fitted isotherm models for the adsorption of MB and CR onto several adsorbents in aqueous solutions [2, 24, 33, 34, 40–45]. The results were listed in Table 2, and the TiO2@yeast-carbon studied in this work represented different adsorption behaviors.
| Adsorbent | Dyes | Adsorption isotherm | Reference |
|---|---|---|---|
| Activated carbon/cobalt ferrite/alginate | MB | Langmuir, Freundlich | Ai et al. [40] |
| Bamboo-based activated carbon | MB | Langmuir | Hameed et al. [24] |
| TiO2@yeast | MB | Langmuir | Chen and Bai [33] |
| Graphene | MB | Langmuir | Liu et al. [41] |
| Perlite | MB | Langmuir | Doğan et al. [42] |
| Garlic peel | MB | Freundlich | Hameed and Ahmad [43] |
| TiO2@yeast-carbon | MB | Koble-Corrigan | This study |
| Bagasse fly ash and activated carbon | CR | Redlich-Peterson | Mall et al. [34] |
| Kaolin | CR | Langmuir | Vimonses et al. [2] |
| Bentonite zeolite | CR | Freundlich | Vimonses et al. [2] |
| Activated carbon prepared from coir pith | CR | Langmuir, Freundlich | Namasivayam and Kavitha [44] |
| Chitosan/montmorillonite nanocomposite | CR | Langmuir | L. Wang and A. Wang [45] |
| TiO2@yeast-carbon | CR | Freundlich, Koble-Corrigan | This study |
3.4. Adsorption Kinetics
| C0 (mg/L) | Qe,exp (mg/g) | Pseudo-first-order | Pseudo-second-order | ||||||
|---|---|---|---|---|---|---|---|---|---|
| k1 (min−1) | Qe,cal (mg/g) | R2 | SSE (%) | k2 (g/mg⋅min) | Qe,cal (mg/g) | R2 | SSE (%) | ||
| MB | |||||||||
| 1.0 | 0.43 | 3.4 × 10⁻³ | 2.16 | 0.868 | 0.87 | 0.426 | 0.39 | 0.961 | 0.10 |
| 2.0 | 0.60 | 4.9 × 10⁻³ | 1.65 | 0.912 | 1.01 | 0.404 | 0.63 | 0.989 | 0.08 |
| 3.0 | 0.81 | 1.0 × 10⁻² | 1.82 | 0.683 | 0.42 | 0.260 | 1.01 | 0.994 | 0.02 |
| 4.0 | 1.06 | 2.4 × 10⁻² | 1.79 | 0.953 | 0.38 | 0.055 | 1.16 | 0.976 | 0.24 |
| 5.0 | 2.15 | 2.0 × 10⁻² | 1.84 | 0.767 | 0.18 | 0.049 | 2.14 | 0.936 | 0.32 |
| CR | |||||||||
| 3.0 | 0.29 | 9.6 × 10⁻² | 1.67 | 0.960 | 0.69 | 0.270 | 0.30 | 0.981 | 0.04 |
| 9.0 | 0.62 | 8.5 × 10⁻² | 1.25 | 0.903 | 0.32 | 0.052 | 0.64 | 0.989 | 0.11 |
| 11.0 | 1.24 | 11.0 × 10⁻² | 3.75 | 0.941 | 1.25 | 0.040 | 1.33 | 0.994 | 0.01 |
Figure 8 exhibits the plots of the pseudo-first-order and pseudo-second-order kinetics of MB adsorption on TiO2@yeast-carbon at different initial concentrations. The adsorption rate constants, correlation coefficient, and SSE values were calculated and summarized in Table 2. It was observed from Table 2 that the experimental Qe values (Qe,exp) did not agree with the calculated ones (Qe,cal) although the correlation coefficient values for the pseudo-first-order at some concentrations were higher than 0.85. As a result, the sorption of MB on the TiO2@yeast-carbon did not follow pseudo-first-order in all cases. It was also obvious that the correlation coefficient R2 was found to range from 0.936 to 0.994 for the pseudo-second-order kinetic model, which were higher than those for the pseudo-second-order model, and the experimental Qe values (Qe,exp) were closer with the theoretical calculated values (Qe,cal) compared to the pseudo-first-order model. Furthermore, SSE values for the pseudo-second-order model were lower than those for the pseudo-second-order model. All the illustrations mentioned above indicated that the adsorption of MB onto TiO2@yeast-carbon followed the pseudo-second-order kinetic model, and the chemical sorption might be involved in the adsorption process. Moreover, the rate constant (k2) decreased with the increase of the initial MB concentrations, which was due to the striking hindrance of higher concentrations of MB [40].
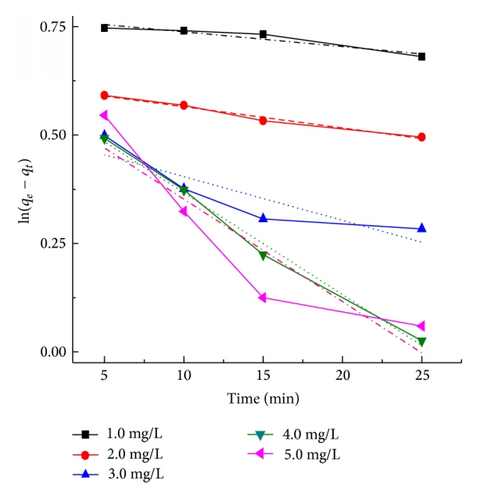
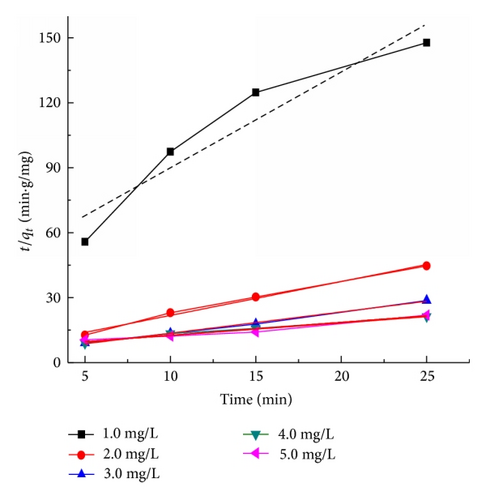
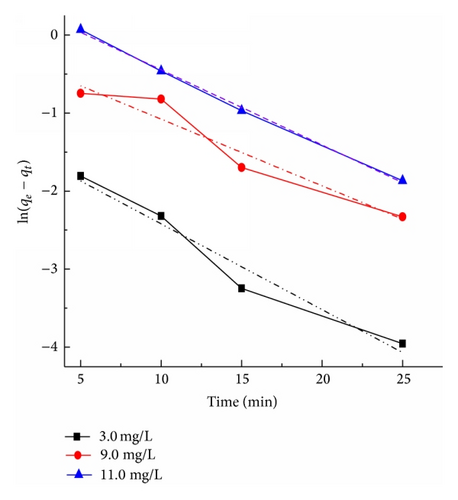
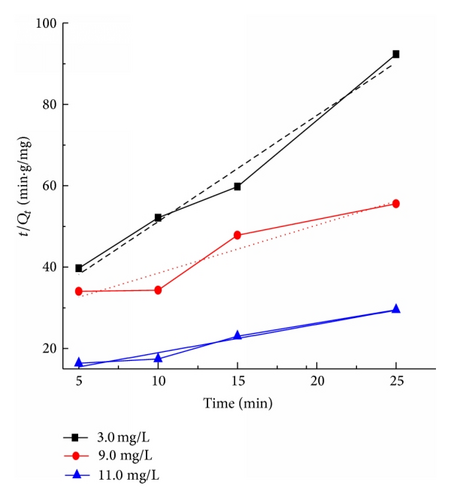
Figure 9 presents the plots of the pseudo-first-order and pseudo-second-order kinetics of CR adsorption on TiO2@yeast-carbon at different initial concentrations. The adsorption rate constants, correlation coefficient, and SSE values are also given in Table 3. The results presented an ideal fit to the pseudo-second-order kinetics for all concentrations with the higher correlation coefficient (R2 > 0.98) and lower SSE values. A good agreement with this model was confirmed by the similar values of calculated adsorption capacity at equilibrium (Qe,cal) and experimental ones (Qe,exp) for all concentrations. The best fit to the pseudo-second-order kinetics model indicates that the adsorption mechanism depends on the adsorbate and adsorbent, and the rate controlling step might be chemical sorption involving valence forces through exchange or sharing of electrons [2]. The rate constant (k2) also decreased with the increase of the initial CR concentrations, owing to that the higher probability of collisions among CR molecules would decrease the sorption rate [28]. Similar kinetic results have also been reported for the CR adsorption onto bagasse fly ash [34], activated carbon from coir [44], and chitosan/montmorillonite [45].
3.5. Regeneration of Dye Loaded TiO2@Yeast-Carbon Microspheres
No matter if adsorption is carried out in statical or dynamical forms, it will gradually reach equilibrium if more contaminated water was treated or more adsorption cycles were conducted without regeneration [48]. So the removal of adsorbed pollutants and the regeneration study of saturated composite were completely necessary. Hence, experiments were performed to evaluate the lifetime and reusing efficiency of prepared composite in removing MB (Figure 10).
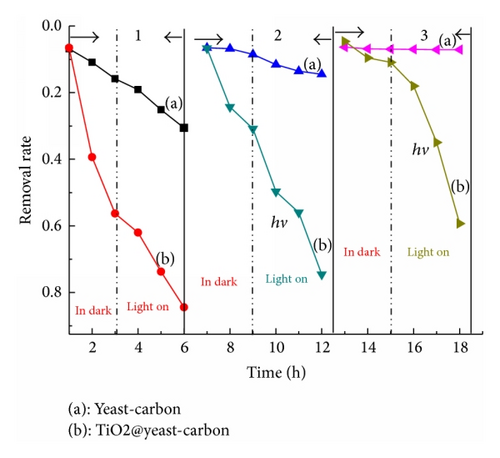
For the dark adsorption section in the first cycle, near absorption-desorption equilibrium was established during the 3.0 h dark phase before the irradiation of the dyes solutions. It can also be seen from Figure 10 that strengthening trend occurs for the adsorption capacities of TiO2@yeast-carbon microsphere when TiO2 nanoparticles were attached onto the yeast-carbon. This enhanced effect of absorption might be ascribed to the integration of yeast-carbon and TiO2 nanoparticles, which creates more adsorption sites for MB. The dark adsorption results show that TiO2@yeast-carbon microsphere have faster adsorption kinetics due to their larger vacant surface area compared to the naked yeast-carbon. This phenomenon can be further affirmed by the pseudo-first-order kinetic data in Table 4. As can be seen, the kinetic rate constant in dark (kdark) for TiO2@yeast-carbon is 5.5 × 10⁻³, which is almost 4.2 times of that for the yeast-carbon. The higher kdark gave clear evidence that TiO2@yeast-carbon exhibited higher adsorption rate than yeast-carbon. Thereafter, the experiments for the removal of MB compound from aqueous solution were continued for about 3 h under UV light irradiation. Figure 10 shows that in the first cycle approximately 30% of MB was removed from the aqueous solution by adsorption on the naked yeast-carbon. In the presence of the raspberry-like TiO2@yeast-carbon microspheres and under UV irradiation, nearly 85% of MB molecule disappearance was accomplished.
| Cycle 1 | Cycle 2 | Cycle 3 | ||||
|---|---|---|---|---|---|---|
| Yeast-carbon | TiO2@yeast-carbon | Yeast-carbon | TiO2@yeast-carbon | yeast-carbon | TiO2@yeast-carbon | |
| kdark | 1.3 × 10⁻³ | 5.5 × 10⁻³ | 2.8 × 10⁻⁴ | 4.2 × 10⁻³ | 8.9 × 10⁻⁵ | 9.0 × 10⁻⁴ |
| R2 | 0.980 | 0.838 | 0.834 | 0.870 | 0.866 | 0.904 |
| klight | 1.22 × 10⁻³ | 6.03 × 10⁻³ | 5.7 × 10⁻⁴ | 5.57 × 10⁻³ | 1.7 × 10⁻⁵ | 5.44 × 10⁻³ |
| R2 | 0.992 | 0.917 | 0.946 | 0.968 | 0.894 | 0.946 |
These results suggest that the prepared TiO2@yeast-carbon composites are effective for the removal of MB from aqueous solutions. The integration of adsorption by the yeast-carbon with photocatalysis by the TiO2 nanoparticles attached on the yeast-carbon surface showed a combined function in the removal of the MB molecule. Specifically, yeast-carbon can increase the photodegradation rate by progressively allowing an increased concentration of MB to come in contact with the TiO2 nanoparticles through means of adsorption. TiO2 nanoparticles on the surface of yeast-carbon can be activated to generate hydroxyl free radicals, which can decompose most of the MB molecules and keep the adsorption sites unsaturated. In return, the simultaneous adsorption of the MB molecules onto the renewed areas of the yeast-carbon provides a continuous supply of substrate to the TiO2 nanoparticles [49]. Thus, the adsorption performance of the yeast-carbon and the photocatalytic property of the attached TiO2 have been integrated as a novel property for the raspberry-like TiO2@yeast-carbon composites.
It was also observed in Figure 10 that, after three times reuses, the MB removal by yeast-carbon apparently dropped from 30.6% to 7.0%. It could be attributed to the fact that the removal of MB in aqueous solution by yeast-carbon mostly relied on adsorption, which fully depended on the absorption sites. Hereby, the bare active sites on yeast-carbon were covered by MB molecules adsorbed in the last cycle, which gave explanation for the rapid loss of MB removal. However, the TiO2@yeast-carbon still achieved desired removal efficiency for MB with slight decrease from 84.4% to 59.3% even though it had been reused for three times; that is, after 3 successive cycles under UV light irradiation, the removal rate of MB by TiO2@yeast-carbon was still 70% of that for the first cycling run. These phenomena give evidence that TiO2@yeast-carbon nanocomposites exhibited excellent photocatalytic stability and regeneration efficiency.
The outstanding regeneration ability of TiO2@yeast-carbon in comparison with the yeast-carbon could be further affirmed by contrasting the pseudo-first-order kinetic rate constants kdark (in dark) and klight (light on) in Table 4. As can be seen, the kdark for TiO2@yeast-carbon during three cycle times are 5.5 × 10⁻³, 4.2 × 10⁻³, and 9.0 × 10⁻³, respectively, which were almost 4.2, 15.0, and 10.1 times those for the yeast-carbon. The higher kdark means that TiO2@yeast-carbon regenerated by UV light illumination exhibited higher adsorption rate than yeast-carbon. Besides, irradiation of yeast-carbon after dark adsorption equilibrium had resulted in smaller klight (1.22 × 10⁻³, 5.7 × 10⁻⁴, and 1.7 × 10⁻⁵) compared to TiO2@yeast-carbon under UV light, showing that the attachment of TiO2 nanoparticles on the surface of yeast-carbon had a great significant influence on the removal rate of MB and implied that in situ regeneration of the MB-loaded TiO2@yeast-carbon had already occurred.
3.6. In Situ Regenerating Mechanism for TiO2@Yeast-Carbon
Simultaneously, the renewed adsorption sites provide a durative supply of MB molecule for TiO2 particle. Then, the activity of TiO2@yeast-carbon was successfully recovered after in situ regeneration. The recovered adsorbent could be used for the next adsorption and catalytic reaction cycle. All in all, the combination of both adsorption and heterogeneous catalysis could be regarded as cleaner, greener, favored, and promising technology for removing dye from water. An optimal amount of TiO2 coverage should exist since the coverage rate of the attached TiO2 nanoparticles onto the yeast-carbon surface in the TiO2@yeast-carbon composite is an important factor for the control of removing dyes. This aspect is currently under investigation.
4. Conclusions
In conclusion, TiO2@yeast-carbon with raspberry-like structure was successfully prepared based on pyrolysis method and was characterized by FE-SEM, EDS, and XRD. The synthetic TiO2@yeast-carbon was used as adsorbent to remove MB and CR from aqueous solutions, respectively. FE-SEM images displayed that TiO2@yeast-carbon microspheres have rough surface morphology and uniform diameter with good dispersity. EDS showed that TiO2 has been already successfully coated on the yeast carbon. The adsorption results showed that TiO2@yeast-carbon microspheres achieved favorable removal of cationic MB in comparison with the anionic CR. Equilibrium data for MB adsorption were best described by the Koble-Corrigan isotherm model. The adsorption of CR onto TiO2@yeast-carbon showed best agreement with both Freundlich and Koble-Corrigan models. Kinetic data indicated that the adsorption of both MB and CR onto TiO2@yeast-carbon microspheres obeyed pseudo-second-order kinetic model well. Moreover, regeneration experiments showed that TiO2@yeast-carbon composites exhibited excellent recycling stability, reusability, and renewable ability. One possible mechanism for regenerating dye-loaded TiO2@yeast in situ was also proposed. This paper may be useful for further research and practical applications of the novel TiO2@yeast composite in dye wastewater treatment.
Conflict of Interests
The authors declare that there is no conflict of interests regarding the publication of this paper.
Acknowledgments
This work was financially supported by the National Natural Science Foundation of China (no. 21176031), Fundamental Research Funds for the Central Universities (no. 2013G2291015), and National Undergraduate Training Programs for Innovation and Entrepreneurship of Chang’an University (no. 201410710059).


