Microstructure Properties of Rapidly Solidified Al-Zn-Mg-Cu Alloys
Abstract
The Rietveld X-ray diffraction analysis was applied to analyze the weight fraction of precipitation phases and microstructure characterizations of rapidly solidified Al-8Zn-4Mg-xCu, x = 1, 4, 8, and 10 alloys (in wt.%), prepared by melt spun technique. A good agreement between observed and calculated diffraction pattern was obtained and the conventional Rietveld factors (Rp, Rwp, and GOF) converged to satisfactory values. Solid solubilities of Zn, Mg, and Cu in α-Al were extended to high values. Besides, metastable Al0.71Zn0.29, intermetallic Al2CuMg, Al2Cu, and CuMgZn phases have been observed for x = 4, 8, and 10 Cu alloys. The crystal structure and microstructure characterizations exhibit strong Cu content dependence.
1. Introduction
The main attributes of rapid solidification are the extension of solid solution, refinement of structures in the nanometer range, production of fine dispersion of the second phase, synthesis of novel crystalline, and amorphous phases [1–4]. The Al-Zn alloys fulfill a significant fraction of industry’s demand for the development of lightweight materials having high strength and toughness characteristics. Cu was added into the 7000 alloys to improve the stress corrosion cracking resistance [5, 6]. 7xxx series (Al-Zn-Mg-Cu) aluminum alloys are widely used in the aircraft industry due to their low density and high strength [7]. It was reported that several intermetallic phases such as η (MgZn2), T (Al2Mg3Zn3), S (Al2CuMg), and θ (Al2Cu) can occur below the solidus [8–10]. The interaction in Al-Zn alloys is rather weak and Zn atoms (atomic radius 1.39 Å) do not tend to form intermetallic phases with Al atoms (atomic radius 1.43 Å), which means that this size difference has a great influence upon the crystalline microstructure of Al-Zn alloys [11]. However, metastable Al0.71Zn0.29 phase has been observed by the author in melt spun Zn-22wt.%Al-6wt.%Ce [12]. This metastable phase disappeared by annealing (300°C/20 h) and has been also observed by others [13, 14]. Rietveld method is becoming progressively more popular for microstructure characterization of materials. It is common practice to estimate domain size and strain values from the refined profile width parameters. Moreover, weight fractions of all phases in multiphase sample can be calculated directly by their scale factors which can be obtained by Rietveld fitting.
The object of this study is to investigate the influence of Cu content and rapid solidification on precipitation contents and microstructure characterizations of Al-8Zn-4Mg-xCu, x =1, 4, 8, and 10 melt spun alloys, by using the Rietveld XRD analysis.
2. Experimental Methods
Al-8Zn-4Mg-xCu, x = 1, 4, 8, and 10 alloys, were prepared from 99.99 wt.% pure Zn, 99.75 wt.% pure Al, 99.99 wt.% pure Cu, and Al-10 wt.% Mg master alloy. The melt spun alloys have been prepared as explained elsewhere [12]. The estimated cooling rate was about 106 K/s. XRD patterns were performed using a 1390 Philips diffractometer, with filtered Cu Kα1 radiation (λ = 0.154056 Å) at 40 kV and 20 mA in the 2θ range 20–90°.
In the present study, the Rietveld X-ray diffraction analysis [16–18] was carried out by the X′pert HighScore 2004 program and the Pseudo-Voigt peak shape function. The reliability of the refinement results was judged by the pattern R factor (Rp), the weighted pattern R factor (Rwp), and the “goodness of fit”; [19]. Initial structure parameters of all phases used for Rietveld method in this study were from ICCD (Inorganic Crystal Structure Database) cards. The parameters that had been refined simultaneously include scale factors, zero point shift, lattice parameters, atomic coordinates, atomic sites occupancies, isotropic or anisotropic temperature factors, profile shape parameter, FWHM (Full Width at Half Maximum) parameters, asymmetry, and preferred orientation parameters. The total parameters to be refined of x = 1, 4, 8, and 10 Cu melt spun alloys were 10, 23, 30, and 31.
3. Results and Discussion
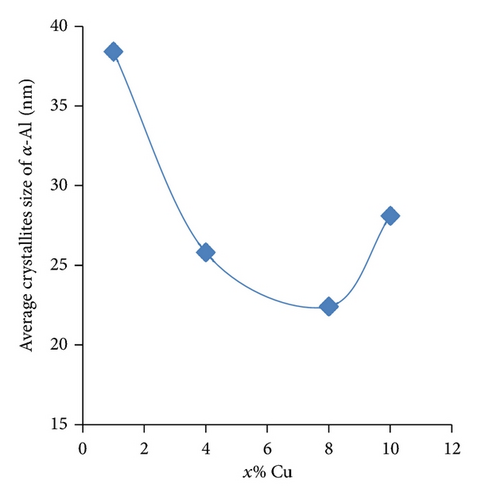
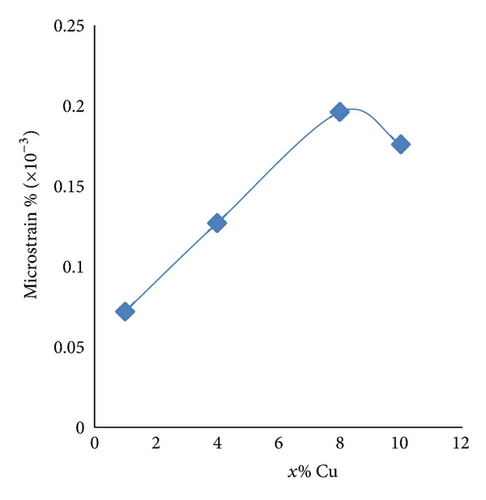
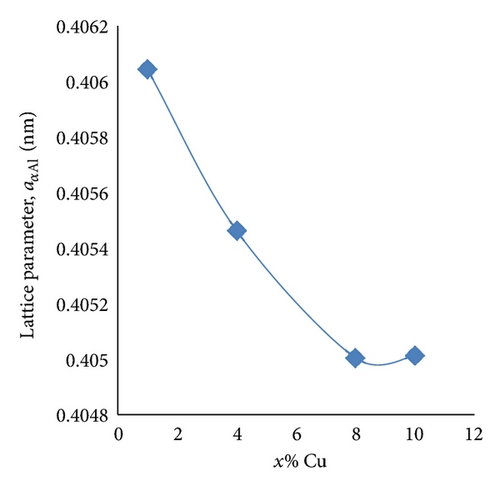
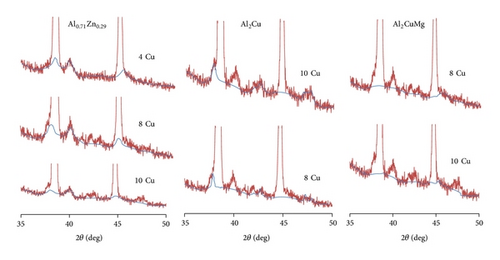
Figure 1 shows the observed, calculated diffraction patterns and differences curves of x = 1, 4, 8, and 10 Cu melt spun alloys. The difference curves are flat and the values of R factors are typical and satisfactory, which means that successful agreement is obtained between the observed and calculated diffraction patterns as shown in Table 1. Rietveld refinement results of α-Al forthe melt spun alloys have been shown in Table 1. The corresponding XRD lines of Zn (8%), Mg (4%) were absent and the lattice constant of aluminum, aα-Al, increased from 4.0496 Å to 4.0603 Å (for x = 1 Cu alloy) indicating the extent of the solid solubility of the alloying elements in α-Al. By taking into account nominal atomic radii of Al (1.43 Å), Cu (1.278 Å), Zn (1.394 Å), and Mg (1.602 Å) [20], it is reasonable to assume that the α-Al is a supersaturated solid solution of Al by Zn, Cu, and Mg. This means that the cooling rate obtained in the melt spun technique was high enough to retain the alloying elements in a solid solution. Besides, average crystallites size and microstrain% of α-Al phase were calculated from the refined profile width parameters and summarized in Table 1. The average crystallites size of α-Al phase was in range of 22–38 nm. By increasing Cu content, the average crystallites size of α-Al decreased at the beginning and then increased as shown in Figure 2(a). In addition, microstrain% of α-Al increased by constant rate and then decreased for x = 10 Cu melt spun alloy as shown in Figure 2(b) while the lattice constant of α-Al decreased and then increased for x = 10 Cu melt spun alloy as shown in Figure 2(c). A preferred orientation-correction refinement for α-Al phase had a great influence on the matching between the calculated and observed XRD lines intensity and consequently on the Rietveld agreement factors for the melt spun alloys. The α-Al phase exhibited preferred orientation in the crystallographic plane (111). XRD patterns of the intermetallic phases (Al0.71Zn0.29, Al2CuMg, and Al2Cu) observed in the melt spun alloys have been separately expanded and well illustrated in 35–50° 2θ range as shown in Figure 3. The calculated weight percent (wt.%), lattice constant aαAl (in Å), volume of the unit cell (in Å3), and atomic coordinates of Al0.71Zn0.29, θ (Al2Cu), and S (Al2CuMg) intermetallic phases obtained by Rietveld refinement are summarized in Table 2. Metastable Al0.71Zn0.29 intermetallic phase has been observed for x = 4, 8, and 10 Cu alloys with wt.% contents of 1.1, 2, and 1, respectively. It is obvious that the unit cell of the melt spun Al0.71Zn0.29 phase has expanded, and therefore Al0.71Zn0.29 phase can be attributed as supersaturated solid solution. In addition, for x = 4 Cu alloy, very weak peaks corresponding to intermetallic Al2CuMg phase (0.6 wt.%) have been detected, and therefore the decreasing of aα-Al (4.05462 Å) by increasing of Cu content from x = 1 to 4% may indicate that part of Cu content dissolves in α-Al. Moreover, Cu content seems to support the formation of the metastable Al0.71Zn0.29 phase except in x = 1 Cu alloy. Similarly, 6% Ce supported the formation of metastable Al0.71Zn0.29 phase in Zn-22Al-6Ce (in wt.%) melt spun alloy prepared and discussed by the author [12]. Further decrease of aα-Al (4.05004 Å) has been observed by increasing of Cu content to 8%, which can be attributed to the increasing of the solute Cu atoms in α-Al, while aα-Al increased a little bit (4.050138 Å) for x = 10 Cu alloy which may indicate that the saturation solubility of Cu in α-Al has reached (maximum solubility of Cu in α-Al is 5.4% at 548°C) and a few of Mg atoms (1.602 Å) have been dissolved in α-Al. The calculated lattice parameters and atomic coordinates for the trigonal metastable Al0.71Zn0.29, tetragonal intermetallic Al2Cu, and orthorhombic intermetallic Al2CuMg phases agree very well with published data with some refinements for the refinable coordinates as shown in Table 2. In general, the unit cell of each intermetallic phase in melt spun alloys exhibited contraction or expansion as the composition varies across it. For low Cu content where Cu/Mg ratio is close to one (x = 4 Cu alloy), little amount of Al2CuMg (0.6 wt.%) was formed. Increasing of Cu content where Cu/Mg = 2 (x = 8 Cu alloy) leads to formation of little amount of Al2Cu phase (1.2 wt.%) and Al2CuMg phase became dominant (3.8 wt.%). Further increasing of Cu content where Cu/Mg > 2 (x = 10 Cu alloy), Al2Cu became dominant (3.2 wt.%) with little amount of Al2CuMg (0.8 wt.%) as shown in Figure 3. This means that the formation of Al2CuMg intermetallic phase is preferable only at lower Cu contents. This replacement between the two intermetallic phases by increasing of Cu content was also observed in the casting AlCuMg alloys [21]. Besides, the intermetallic CuMgZn phase has been observed for x = 8 and 10 Cu alloys with lower contents (0.1% and 0.3%).
| Sample | Preferred ordination parameter |
Lattice constant (Å) and volume (V) of unit cell (Å3) for α-Al | Average crystallite size (nm) |
ε% | Agreement factors | |||
|---|---|---|---|---|---|---|---|---|
| Rp | Rwp | Rexp | GOF | |||||
| 1% Cu | 0.98 |
|
38 | 0.072 | 7.49 | 10.67 | 9.10 | 1.37 |
| 4% Cu | 0.87 |
|
26 | 0.127 | 5.78 | 7.78 | 6.39 | 1.48 |
| 8% Cu | 0.82 |
|
22 | 0.196 | 5.67 | 7.60 | 5.84 | 1.69 |
| 10% Cu | 0.85 |
|
30 | 0.163 | 4.74 | 6.52 | 5.82 | 1.25 |
| Phase | Sample | wt.% | Lattice constant and volume (V) of unit cell in Å3 (published) |
Lattice constant and volume of unit cell in Å3 (calculated) | (Wyckoff) Atom |
Atomic coordinates | ||
|---|---|---|---|---|---|---|---|---|
| x | y | z | ||||||
|
|
|
|
|
|
|
|
|
|
|
|
|
|
|
|
|
|
|
|
|
|
|
||||
|
|
|
|
|
|
|
|
|
|
|
|
|
|
||||
|
|
|
|
|
||||


4. Conclusion
The Rietveld X-ray diffraction analysis was successfully applied for analyzing the crystal structure and precipitation contents of the Al-8Zn-4Mg-xCu, x = 1, 4, 8, and 10 melt spun alloys. The “goodnesses of fit” were 1.37, 1.48, 1.69, and 1.25 for x = 1, 4, 8, and 10 Cu alloys, respectively. The cooling rate was high enough to mostly retain the alloying elements (8% Zn, 4% Mg, and 1% Cu) as a solid solution in α-Al. Besides, the average crystallites size of α-Al phase was in range of 22–38 nm. The melt spun α-Al phase exhibited preferred orientation in the plane (111). Metastable Al0.71Zn0.29 intermetallic phase was observed for all compositions except at low Cu content (1%Cu) which means that Cu content may play a certain role in the formation of this metastable phase. It is found that the intermetallic Al2CuMg phase was preferably formed at lower Cu contents (4 and 8% Cu) rather than the intermetallic Al2Cu phase which was formed at higher Cu content (10% Cu). As results of the rapid solidification obtained in the melt spun technique, the unit cell of all precipitation phases formed in melt spun alloys exhibited contraction or expansion depending on the kind of dissolved atoms.
Conflict of Interests
The author declared that he has no conflict of interests.
Acknowledgment
The author would like to acknowledge the National Research Center of Egypt for providing financial support for this research.


