On the Role of Optimal Counseling and Antiviral Therapy on Controlling HCV among Intravenous Drug Misusers
Abstract
Hepatitis C virus (HCV) remains a major health challenge despite the availability of highly effective antiviral drugs. Prior studies suggest that many physicians are reluctant to treat intravenous drug misusers due to low levels of treatment adherence associated with intravenous drug misusers. HCV treatment guidelines and recommendations stipulate that HCV patients in treatment should abstain from intravenous drug misuse activities in order to reduce the likelihood of treatment failure, drug resistance, reinfection, superinfection, or mixed infection. In this paper, a mathematical model for exploring the transmission dynamics of HCV among intravenous drug misusers is proposed. The model incorporates essential characteristics of intravenous drug misusers such as relapse and nonadherence to treatment guidelines. With the aid of optimal control theory we assess the effects of time dependent HCV screening and treatment. Results from this study provide a framework for designing the appropriate strategies on controlling the long-term dynamics of HCV among intravenous drug users.
1. Introduction
Intravenous drug misuse continues to claim a large proportion of new hepatitis C virus (HCV) infections worldwide [1]. Despite advancements in the management of HCV and suggestions that treatment of recently acquired HCV can lead to virological response rate of up to 98%, low rates of treatment among HCV patients continue to be observed [2]. Apart from low treatment rates, nonadherence to HCV treatment guidelines and recommendations has been observed as one of the major challenges on effective HCV control among intravenous drug misusers [2, 3]. Adherence in the context of HCV treatment includes the patient’s adherence to both the medication regimen and the overall medical plan [3]. Nonadherence to HCV treatment may be associated with a number of reasons among the following: higher pill burden and lengthy treatment, limited provider experience, lack of social support, and presence of cirrhosis [4].
This study aims to evaluate the effects of time dependent HCV screening and treatment. The application of optimal control theory on gaining insights into the long-term dynamics of HCV has been an interesting topic for a couple of researchers (e.g., see [5–8] and the references therein). In 2011, Martin et al. [5] developed a mathematical model to assess the impact of time dependent control on HCV antiviral treatment. Their work revealed, among others, that, with a fixed annual budget, greater impact on HCV control (measured by infections averted or prevalence reductions) and cost-effectiveness will be achieved in lower prevalence areas. Although nonadherence to HCV treatment is a major challenge on effective HCV control, few mathematical models have been proposed to assess its impact on HCV prevalence among intravenous drug misusers. It is against this background that this study is proposed.
2. Model Framework
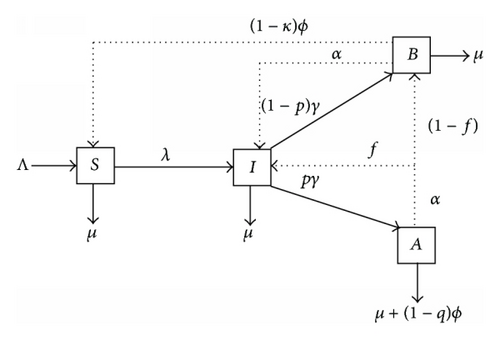
The study assumes a homogeneous mixing population, with Λ denoting the entrance of new intravenous drug misusers; β is the probability of HCV transmission per needle sharing, c is the average number of needle sharing partners for individuals in class I per year, θ is the partner acquisition rate for individuals in class B per year, and θ is assumed to be less or equal to c due to the fact that individuals in treatment are assumed to have adopted a positive behavior towards the control of the epidemic. Hence, they are bound to reduce the number of partners compared to HCV patients unaware of their status; ω is a modification parameter accounting for the reduction in HCV infection by individuals in class B compared to those in class I (due to the fact that antiviral therapy reduces the viral load); the acute infection spontaneously clears in a proportion δ. Individuals in subgroup I seek treatment at rate γ. Upon commencing treatment, a fraction, p, of infectious individuals is assumed to fully abstain from drug misuse activities while the remainder (1 − p) is assumed to partially abstain (i.e., they are assumed to continue participating in intravenous drug misuse activities with reduced partners); thus, they join class B. After successful treatment, a proportion (1 − κ) from class B recovers at rate ϕ and joins the susceptible class. A proportion (1 − q) who successfully recovers from treatment in class A exits the model at rate ϕ. Natural mortality rate, μ, is assumed to be constant in all classes. Due to drug addiction, HCV patients in class A may relapse to drug misuse activities at rate α. Since class A constitutes HCV infected individuals who would have fully abstained from drug misuse activities, we assume that a proportion f of those individuals who relapse join class I and the complementary proportion (1 − f) moves to class B. All parameters in the model are strictly positive. The model flow diagram is depicted in Figure 1 with λ = β(1 − δ)[cI + θ(1 − ω)B]/N.
3. The Optimal Control Problem
3.1. Existence of an Optimal Control Pair
The existence of optimal controls follows from standard results in optimal control theory [10, 11].
Theorem 1. Consider the control problem with system (2). There exists an optimal control such that
Proof. The boundedness of solutions of system (2) for a finite time interval is used to prove the existence of an optimal control. To determine existence of an optimal control to our problem, we use a result from Fleming and Rishel (1975) (Theorem 4.1 pages 68-69) [10], where the following properties must be satisfied.
- (1)
The class of all initial conditions with an optimal control set u1 or u2 in the admissible control set along with each state equation being satisfied is not empty.
- (2)
The control set is convex and closed.
- (3)
The right-hand side of the state is continuous, is bounded above by a sum of the bounded control and the state, and can be written as a linear function of each control in the optimal control sets u1 and u2, with coefficients depending on the time and the state variables.
- (4)
The integrand of the functional is concave on and is bounded above by , where c1, c2 > 0.
An existence result in Lukes (1982) (Theorem 9.2.1) [11] for the system (2) for bounded coefficients is used to give condition 1. The control set is closed and convex by definition. The right-hand side of the state system (2) satisfies condition 3 since the state solutions are a priori bounded. The integrand in the objective functional, , is Lebesgue integrable and concave on . Furthermore, c1, c2 > 0 and π1, π2, π3, π4 > 1, hence satisfying
3.2. Characterization of the Optimality Control
Theorem 2. Given optimal controls and and solutions of the corresponding state system (2), there exist adjoint variables ξi, i = 1,2, …, 4, satisfying
Proof. The form of the adjoint equation and transversality conditions are standard results from Pontryagin’s Maximum Principle [10]; therefore, solutions to the adjoint system exist and are bounded. To determine the interior maximum of our Lagrangian, we take the partial derivate of L with respect to u1 and u2 and set it to zero. Thus,
In compact form we have
4. Numerical Results and Discussion
In this section, we numerically illustrate the optimal scenarios of the two controls u1(t) and u2(t). The optimal screening and treatment strategy is obtained by solving the optimality system (2) from the state and adjoint equations. An iterative method is used for solving the optimality system. We start to solve the state equations with a guess for the controls over the simulated time using a forward fourth-order Runge-Kutta scheme. Because of the transversality conditions (3), the adjoint equations are solved by a backward fourth-order Runge-Kutta scheme using the current iteration solution of the state equations. Then, the controls are updated by using a convex combination of the previous controls and the value from characterizations (10). This process is repeated and iteration is stopped if the values of unknowns at the previous iteration are very close to the ones at the present iteration [12].
4.1. Discussion of Parameter and Initial Population Estimates
Increasing the weights π1 and π2 leads to reduction in the population of subgroups I and B, respectively. In real world, parameter π1 is greater than π2 since HCV screening and treatment require a couple of procedures and a large population compared to counseling and monitoring of HCV patients in treatment. Similarly, π3 ≥ π4. It follows that π1 = 1.1, π2 = 1.5, π3 = 0.3, and π4 = 0.2. We assume the following initial population sizes in our numerical simulations: S(0) = 1500, I(0) = 500, and B(0) = A(0) = 0.
4.2. Stopping Criteria
| Parameter description | Symbol | Units | Value (range) | Source |
|---|---|---|---|---|
| Relapse rate | α | Per year | 0.1 (0.01–0.3) | [9] |
| Infection rate | β | Per year | 0.1 (0.1834–0.2334) | [5] |
| Treatment rate | γ | Per year | 0.02 (0.01–0.4) | [1] |
| Abstinence ratio | p | — | 0.5 (0.01–0.6) | [9] |
| Modification factor | ω | — | 0.5 (0.1–1.0) | [9] |
| 1/treatment duration | ϕ | Per year | 1.5 (0.9–1.992) | [9] |
| Natural mortality rate | μ | Per year | 0.0142 (0.01-0.02) | [9] |
| New injector entrance rate | Λ | IDUs per year | 250 | Estimated |
| Average number of needle sharing partners for individuals in class I | c | IDUs per year | 5.0 (1–10) | [9] |
| Partner acquisition for individuals in class B | θ | IDUs per year | 3.0 (1–10) | [9] |
| Proportion of infections spontaneously clear | δ | — | 0.26 (0.01–0.26) | [9] |
| Proportion of infections cured by treatment for class A | 1 − q | — | 0.6 (0.5–0.625) | [9] |
| Proportion of infections cured by treatment for class B | 1 − κ | — | 0.5 (0.5–0.625) | [9] |
| Proportion of relapse into class I | f | — | 0.3 (0–0.3) | [9] |
The effects of absence and presence of time dependent HCV screening and treatment are illustrated in Figure 2. Results from Figure 2 reveal that time dependent controls will have a remarkable impact on controlling new HCV infections among intravenous drug misusers. In Figures 2(c) and 2(d), one can observe that, in the interval 0–8 years, there is a higher population of HCV patients in treatment when there are time dependent controls compared to when there are no time dependent controls. However, the usefulness of time dependent controls is observed when t > 8; in this region, the population of HCV patients in treatment in the presence of time dependent controls is lower than the population of HCV patients in treatment in the absence of time dependent controls. Thus, the presence of time dependent control leads to low levels of HCV patients who will fail to adhere to HCV treatment, consequently leading to low treatment failure and high level of cessation in intravenous drug misuse activities.
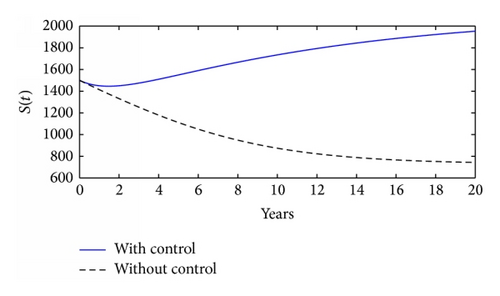
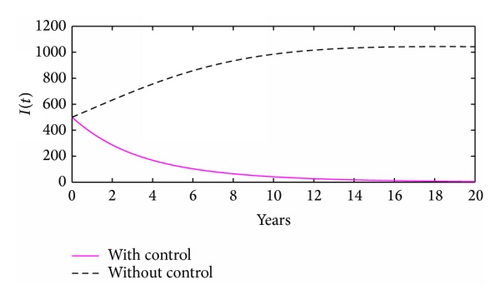
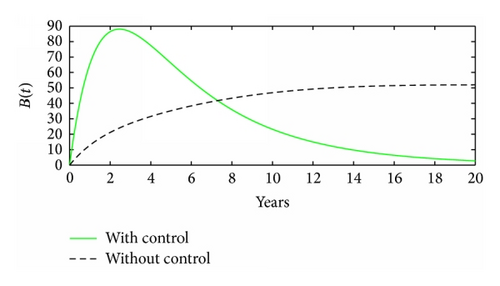
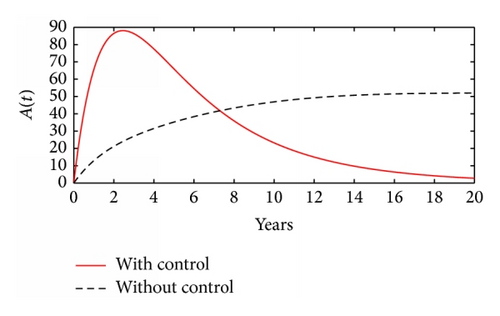
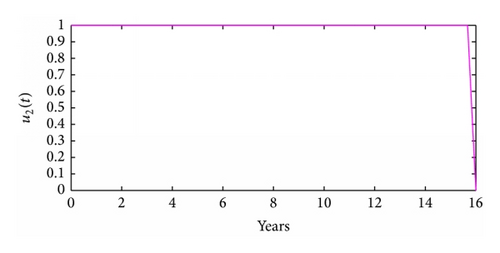
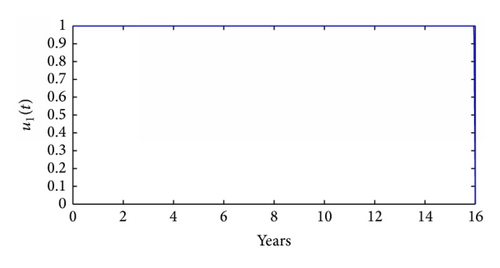
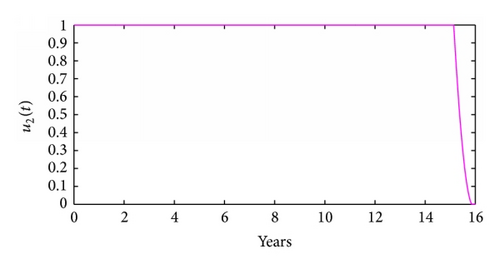
Figure 3 illustrates the control profiles for the controls u1(t) and u2(t). In Figures 3(a) and 3(c), the control profile for control u1 is at the upper bound from the start till the end. In Figure 3(b), the control profile for control u2 is at the upper bound from the start till the end while in Figure 3(d) the control profile for control u2 is at the upper bound from the start till when t is slightly above 15 years; thereafter, it drops sharply to the origin. The results here (Figure 3) suggest that, for effective HCV control among intravenous drug users, a slightly higher effort should be devoted to HCV screening and treatment than to counseling and monitoring.

5. Concluding Remarks
Intravenous drug misusers account for a disproportionately large burden of hepatitis C infection. Despite the availability of effective hepatitis C virus (HCV) antiviral therapy which leads to a sustained virological response (SVR) rate of up to 98%, there continues to be a low rate of treatment uptake among intravenous drug misusers. In this paper, a mathematical model is proposed to assess the effects of time dependent HCV screening and treatment. The model incorporates counseling and monitoring of HCV patients in treatment. Monitoring and counseling may lead to a reduction in cases of treatment failure which arise due to nonadherence to HCV treatment guidelines and recommendations. The study reveals, among others, that more effort on HCV screening and treatment coupled with counseling may be effective on controlling HCV prevalence among intravenous drug misusers. Further analysis of the results suggests that effective time dependent HCV screening and treatment may be useful in combating new HCV infections even if <50% of HCV patients fail to completely quit drug misuse activities during the course of treatment. Although counseling and monitoring of a patient in treatment is never a bad idea, results in this study emphasize that a slightly higher effort should be devoted to HCV screening and treatment than to counseling and monitoring of HCV patients in treatment. Optimal control theory applied to an HCV model discussed in this paper provides a starting point for more elaborate models which can include drug resistance, superinfection, or mixed infection.
Conflict of Interests
The author declares that there is no conflict of interests regarding the publication of this paper.
Acknowledgments
The author is grateful to the Editor and the anonymous referees for their helpful comments which greatly improved the paper.


