Influence of Hydrothermal Temperature on Phosphorus Recovery Efficiency of Porous Calcium Silicate Hydrate
Abstract
Porous calcium silicate hydrate (PCSH) was synthesized by carbide residue and white carbon black. The influence of hydrothermal temperature on phosphorus recovery efficiency was investigated by Field Emission Scanning Electron Microscopy (FESEM), Brunauer-Emmett-Teller (BET), and X-Ray Diffraction (XRD). Hydrothermal temperature exerted significant influence on phosphorus recovery performance of PCSH. Hydrothermal temperature 170°C for PCSH was more proper to recover phosphorus. PCSH could recover phosphorus with content of 18.51%. The law of Ca2+ and OH− release was the key of phosphorus recovery efficiency, and this law depended upon the microstructure of PCSH. When the temperature of synthesis reached to 170°C, the reactions between CaO and amorphous SiO2 were more efficient. Solubility of SiO2 was a limiting factor.
1. Introduction
Phosphorus recovery from wastewater in the form of hydroxyapatite is an effective method [1]. However, the optimal pH value for the formation of hydroxyapatite is in the range of 10.5~12.5 [2]. But this pH value is too high to biochemical treatment system where the pH value is located between 6.0 and 9.0 [3].
Phosphorus recovery on the condition of alkalescency not only decreased the significant competition between carbonate and calcium, but also decreased the cost of chemical treatment and increased the effective phosphorus composition of the final products [4]. To address these issues, calcium silicate hydrate was introduced [5]. The existing researches showed that calcium silicate hydrate could be considered as a very attractive and promising material to remove phosphorus from wastewater when compared with the common natural materials [6]. Because calcium silicate hydrate could release Ca2+ and OH− [7], Ca2+, OH− and in the solution form a condition locally for the growth of HAP, which could grow with pH = 8.0-9.0. In order to achieve this goal, it is necessary to find a process condition to prepare calcium silicate hydrate.
From a theoretical and practical point of view, the synthesis, properties, and structure of calcium silicate hydrate have been analyzed in detail [8–11]. Dynamic hydrothermal synthesis is a common method to prepare calcium silicate hydrate [12, 13]. Hydrothermal temperature is one of the most important factors, which determine the microstructure of calcium silicate hydrate [14]. Prophase researches showed that the difference of microstructure has an effect on the phosphorus recovery performance of calcium silicate hydrate. However, the bottleneck problem was that it was hard to determine the appropriate hydrothermal temperature for the preparation of the calcium silicate hydrate which possesses the phosphorus recovery performance.
- (1)
PCSH was synthesized by carbide residue and white carbon black with a dynamic hydrothermal method. The influence of hydrothermal temperature on phosphorus recovery performance was investigated.
- (2)
The relationship between pore structure and the law of Ca2+ and OH− release was established by Avrami kinetic model.
- (3)
The mechanism of phosphorus recovery was studied by FESEM, BET, and XRD on the basis of an in-depth critical investigation.
2. Materials and Methods
2.1. Preparation of PCSH
PCSH was synthesized with carbide residue (providing Ca) and white carbon black (providing Si). Carbide residue (calcareous, hoar, and powdery) was obtained from Chongqing Changshou Chemical Co. Ltd. and calcined at 700°C for 2 h. White carbon black (particles present spherical with homogeneous diameter) was purchased from Chongqing Jianfeng chemical Co. Ltd. Chemical constituents of carbide residue and white carbon black are shown in Table 1. The phosphorus solution was adjusted by adding KH2PO4 (Analytical reagent, Chongqing Boyi Chemical reagent Co. Ltd.) to prepare solution with initial phosphorus concentration of 100 mg/L. The above materials and chemicals were placed into sealed bottles for storage.
| Chemical components (contents)/% | ||||||||||
|---|---|---|---|---|---|---|---|---|---|---|
| CaO | SiO2 | Al2O3 | SO2 | MgO | Fe2O3 | SrO | NaOH | CuO | H2O | |
| Carbide residue | 79.34 | 3.57 | 2.14 | 1.22 | 0.62 | 0.21 | 0.26 | — | — | 12.64 |
| White carbon black | 0.08 | 97.46 | 0.16 | 1.82 | — | 0.03 | — | 0.29 | 0.02 | 0.14 |
Carbide residue and white carbon black were mixed, and the Ca/Si molar ratios were controlled at 1.6 : 1. The mixture was then added to prepared slurries. The slurry was hydrothermally reacted at 110°C, 140°C, 170°C, and 200°C, respectively, and the reaction time was 6 h. The samples were taken out when the temperature was reduced to the natural condition. The hydrothermal reaction was carried out with a liquid/solid ratio of 30. The obtained products were dried at 105°C for 2 h, and then were ground through a sieve of 200 meshes. The prepared samples that were hydrothermally reacted at 110°C, 140°C, 170°C, and 200°C were denoted as PCSH: 110°C, PCSH: 140°C, PCSH: 170°C, and PCSH: 200°C, respectively.
2.2. Evaluation of Phosphorus Recovery Performance
4 g of samples (PCSH: 110°C, PCSH: 140°C, PCSH: 170°C, and PCSH: 200°C) were immersed in 1 L of demonized water, respectively, contained in a glass bottle, generating samples with a solution concentration of 4 g/L. The bottle was placed on an agitation table and shaken at 40 r/min under controlled temperature conditions (20°C). Samples of solution were taken after 5, 10, 15, 20, 40, 60, and 80 mins of agitation. Ca2+ concentration of the samples was determined by EDTA titration (the relative error of data is 0.05%).
2.3. Characterization Methods
XRD patterns were collected in an XD-2 instrument (Persee, China) using Cu Kα radiation. FESEM images were collected on an S-4800 field emission scanning electron microscope (Hitachi, Japan). BET surface areas were measured by nitrogen adsorption at 77.35 K on an ASAP-2010 adsorption apparatus (Micromeritics, USA).
3. Results and Discussion
3.1. Phosphorus Recovery Performance of PCSH
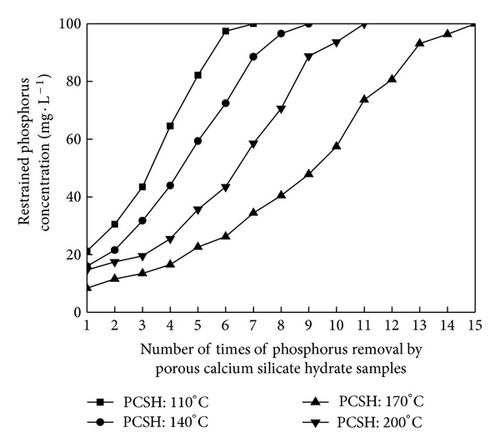
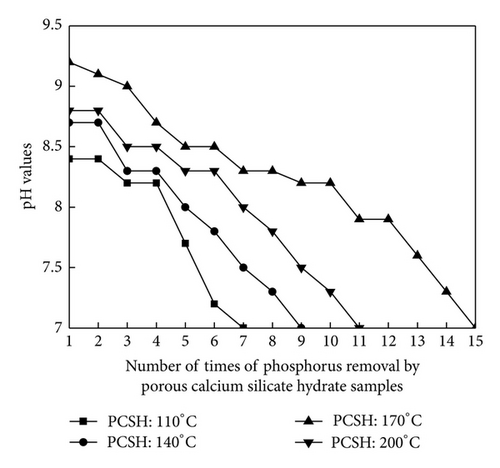
The PCSH samples were separated from the removed synthetic solution after phosphorus removal, and these samples were added into synthetic solution with initial phosphorus concentration 100 mg/L again. This process was repeated for several times in order to explore the phosphorus recovery performance of PCSH. Changes of restrained phosphorus concentration are shown in Figure 1. There were great differences among the phosphorus recovery performance of these samples. Phosphorus content of PCSH: 110°C was only 6.49% after 7 times of phosphorus removal. Phosphorus content of PCSH: 140°C was 9.07% after 9 times of phosphorus removal. PCSH: 170°C could remove phosphorus repeated for 15 times, and phosphorus content of this sample reached 18.51%. Phosphorus content of PCSH: 200°C was 12.92% after 11 times of phosphorus removal. Generally speaking, the material could be used as a high grade phosphorus ore when the phosphorus content of this material exceeds 15% [15]. Therefore, the hydrothermal temperature 170°C was beneficial for the PCSH to phosphorus removal. As seen in Figure 2, these samples reflected good phosphorus removal efficiency when pH values maintained 8.0~9.0. But with the times of phosphorus removal increased, pH values and the phosphorus removal efficiency of PCSH samples declined. The concentration of restrained phosphorus kept unchanged when pH values declined to 7.0. This phenomenon showed that these samples had no phosphorus recovery performance on the condition of neutral. In contrast, PCSH: 170°C could maintain pH values at a range of 8.0~9.0 more effectively.
3.2. The Pore Structure and Ca2+ Release of PCSH
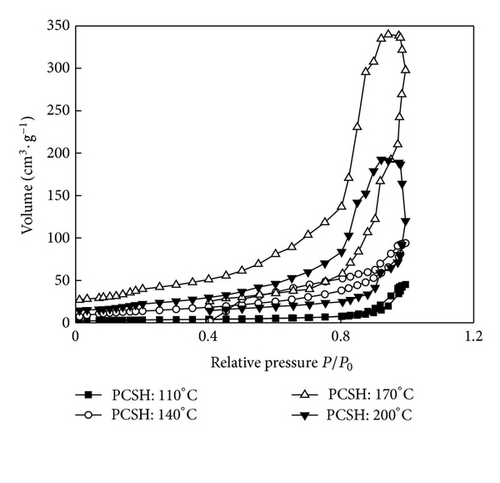
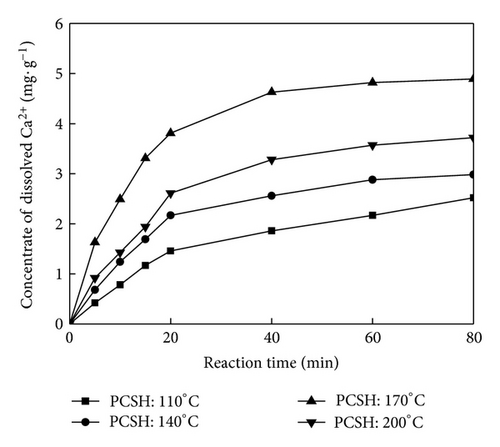
Specific surface area and pore size distribution were calculated by BET equation and Barrett-Joyner-Halenda method, respectively (Figure 3). The nitrogen sorption analysis was conducted to reveal the pore structure of calcium silicate hydrate. All three samples showed similar adsorption-desorption isotherms, which could be classified as type IV according to IUPAC nomenclature [16]. The results suggested the phenomenon of adsorption hysteresis loop. That mean mesopore or narrow gap pore existed on sample. Adsorption in mespore occurred mainly in medium pressure region (0.4 < P/P0 < 0.9). When the hydrothermal temperature was lower than 170°C, with the increase of hydrothermal temperature, the phenomenon of adsorption hysteresis loop became obvious and the adsorption curve increased. While the adsorption curve of PCSH: 200°C declined slightly, specific surface areas of PCSH: 110°C, PCSH: 140°C, PCSH: 170°C, and PCSH: 200°C were 11.91, 49.85, 113.36, and 59.67 m2/g, respectively. Pore volumes of these samples were 0.07, 0.15, 0.53, and 0.30 cm3/g, respectively.
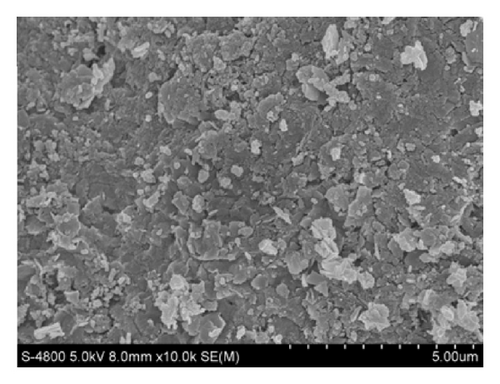
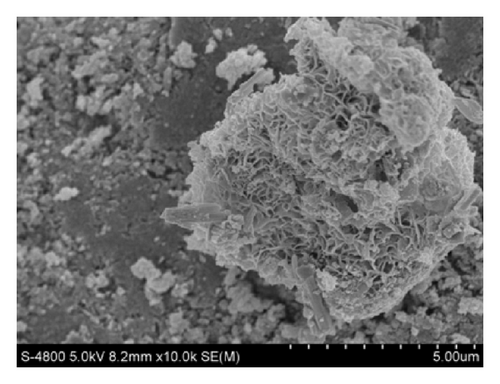
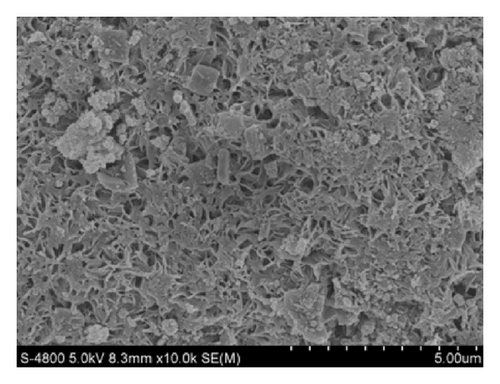
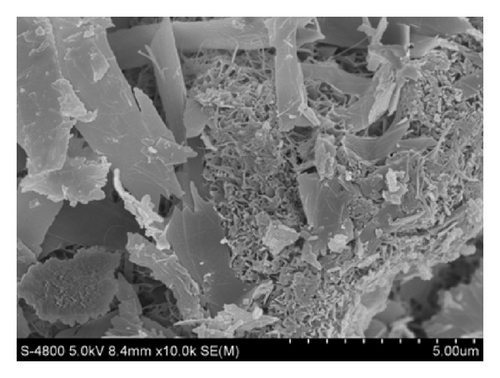
The morphology of PCSH: 110°C, PCSH: 140°C, PCSH: 170°C, and PCSH: 200°C was examined by FESEM observations (Figure 4). It could be indicated from the photographs that the surface structure of PCSH: 110°C seems dense with pore size inhomogeneous distribution. The surface structure of PCSH: 140°C and PCSH: 200°C seems dense with pore size homogeneous distribution. In contrast, PCSH: 170°C possesses obverse fibrous-network structure with a large number of mesopores, and the particle size of spherical particle distributed from 25 to 30 μm uniformly.
| Samples | Avrami kinetic equations | Kinetic constant (k) | Correlation coefficient (R2) |
|---|---|---|---|
| PCSH: 110°C | −ln(1 − x) = 0.039t0.947 | 0.039 | 0.973 |
| PCSH: 140°C | −ln(1 − x) = 0.052t0.947 | 0.052 | 0.985 |
| PCSH: 170°C | −ln(1 − x) = 0.085t0.947 | 0.085 | 0.998 |
| PCSH: 200°C | −ln(1 − x) = 0.066t0.947 | 0.066 | 0.988 |
3.3. Mechanism of Hydrothermal Temperature Effect on Phosphorus Recovery Performance
The mechanism of hydrothermal temperature effect on phosphorus recovery performance could be further investigated by XRD. The XRD patterns of PCSH samples were compared (Figure 6). The main phase of PCSH: 110°C was SiO2 (PDF card 18-1169), and this result indicated that carbide residue and white carbon black had not reacted completely. When the hydrothermal temperature increased to 140°C, the main phase included Jennite (PDF card 18-1206, chemical formula Ca9Si6O18(OH)6·8H2O) and SiO2, but the principal peaks of Jennite were not obvious. In this stage, a part of SiO2 had involved in the formation of Jennite, but the reaction was not completely, so the content of Jennite was low. When the hydrothermal temperature reached to 170°C, the principal peaks of Jennite appeared instead of the principal peaks of SiO2 in the XRD patterns. This result indicated that the main component of PCSH: 170°C was Jennite. As the hydrothermal temperature heated to 200°C, the production included jennite, xonotlite (PDF card 23-0125, chemical formula Ca6Si6O17(OH)2), and Ca3Si2O7 (PDF card 11-0317).
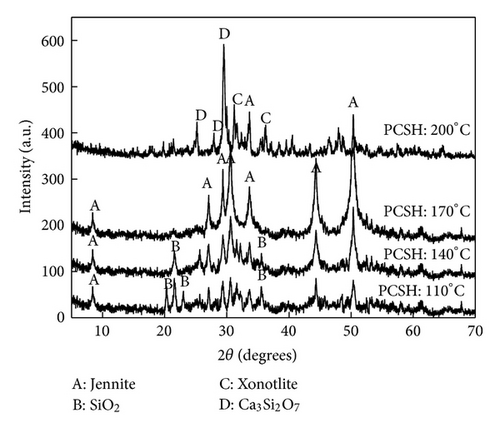
As the siliceous material, white carbon black exhibited high activity [19]. Therefore, the hydrothermal reaction in the high-pressure reactor belonged to controlling solution reaction. The reaction process depended on the dissolution of SiO2, and the dissolution rate depended on the solubility of SiO2 in the white carbon black. Based on the above analysis, when the hydrothermal reaction was too low, SiO2 was difficult to dissolute, and formed a layer of rich silicon on the surface of samples. This condition made the pore structure of samples became dense. Rising the hydrothermal temperature could increase the solubility of SiO2. The solubility of white carbon black was low at atmospheric temperature and pressure, but the solubility increased with the increasing of hydrothermal temperature. Jennite formed when the hydrothermal temperature reached to 170°C, and this material could dissolve a proper concentration of Ca2+ and OH− due to loose and porous structure. So PCSH: 170°C has better phosphorus recovery performance. The system of PCSH became instable due to a too high hydrothermal temperature, and multiple impurities appeared in this system. The phosphorus recovery performance of the sample declined because the efficiency of Ca2+ and OH− release of the impurities was too low.
4. Conclusions
Porous calcium silicate hydrate was synthesized by carbide residue and white carbon black with a dynamic hydrothermal method. This material could be considered a tenable material for phosphorus removal and recovery from wastewater. Hydrothermal temperature showed significant influence on phosphorus recovery performance of PCSH. Hydrothermal temperature 170°C for PCSH was more proper to recover phosphorus. PCSH could recover phosphorus with content of 18.51%.
The law of Ca2+ and OH− release was the key of phosphorus recovery efficiency. Changes of hydrothermal temperature led to the different pore structures. The increase of specific surface area and the increase in concentration of Ca2+ release were in good agreement with each other.
Further analysis by XRD indicated that hydrothermal reaction process depended on the dissolution of SiO2. And hydrothermal temperature affected the solubility of SiO2.


