Volume 2013, Issue 1 163484
Research Article
Open Access

Global Stability of HIV-1 Infection Model with Two Time Delays

Hui Miao

Hui Miao

College of Mathematics and System Science, Xinjiang University, Xinjiang, Urumqi 830046, China xju.edu.cn

Search for more papers by this author
Xamxinur Abdurahman

Corresponding Author

Xamxinur Abdurahman

College of Mathematics and System Science, Xinjiang University, Xinjiang, Urumqi 830046, China xju.edu.cn

Search for more papers by this author
Ahmadjan Muhammadhaji

Ahmadjan Muhammadhaji

College of Mathematics and System Science, Xinjiang University, Xinjiang, Urumqi 830046, China xju.edu.cn

Search for more papers by this author
First published: 22 December 2013
Citations: 2
Academic Editor: Ming Mei

Abstract

We investigate global dynamics for a system of delay differential equations which describes a virus-immune interaction in vivo. The model has two time delays describing time needed for infection of cell and CTLs generation. Our model admits three possible equilibria: infection-free equilibrium, CTL-absent infection equilibrium, and CTL-present infection equilibrium. The effect of time delay on stability of the equilibria of the CTL immune response model has been studied.

1. Introduction

As well known, in recent years the population dynamics of infectious diseases have been extensively studied [120]. Particularly, the HIV (human immunodeficiency virus) has been extensively studied in [15, 711, 14, 15, 20] and became a global problem. The HIV infection is characterized by three different phases, namely, the primary infection, clinically asymptomatic stage (chronic infection), and acquired immunodeficiency syndrome (AIDS) or drug therapy. During primary infection, viral load in the peripheral blood experiences a substantial increase to the peak level, followed by decline to the steady state, which is referred to as the viral set point. Extremely high viral load during primary infection leads to the activation of CD4+ T cells, which are recognized as cytotoxic T cells (CTL) capable of suppressing viral replication. Viral decline from the peak is due to the control by these immune cells and/or limited target cell availability. The viral set point has been shown to be predictive for the pace of disease development [8]. Clinical research combined with mathematical modeling has enhanced progress in the understanding of HIV-1 infection [4]. This is because mathematical models can offer a way to study the dynamics of viral load in vivo and can be very useful in understanding the interaction between virus and host cell.

On the other hand, in the real situation, there may be a lag between the time target cells are contacted by the virus particles and the time the contacted cells become actively affected meaning that the contacting virions enter cells. This can be explained by the initial (or eclipse) phase of the virus life cycle, which include all stages from viral attachment until the time that the host cell contains the infectious viral particles in its cytoplasm [3]. Research [8] has shown that models of HIV-1 infection that include intracellular delays are more accurate representations of the biology and change the estimated values of kinetic parameters when compared to models without delays. Therefore, we should introduce time delays into model foundation, which will have more resemblance to the real ecosystem. In the last decade, the HIV-infection models with time delay have been studied by many authors, and time delays of one type or another have been incorporated into biological models by many authors (e.g., [15, 811, 14, 15, 20] and the references cited therein). Here we include an intracellular delay as well as immune delay. There are some models which include an intracellular delay [15]; some authors believe that time delays can not be ignored in models for immune response [6, 7].

The salient features of the mechanism of the immune response during viral infection are as follows. First, the free virus enters its target, a susceptible cell. Inside this cell it replicates itself. And this susceptible cell becomes an infected cell. Then the infected cell dies and releases new viruses; these viruses begin to infect other susceptible cells. During the process of viral infection, the host is induced which is initially rapid and nonspecific (natural killer cells, macrophage cell, etc.) and then delayed and specific (cytotoxic T lymphocyte cells, antibody cell). But in most virus infections cytotoxic T lymphocyte (CTL) cells which attack infected cells, and antibody cell which attack viruses, play a critical part in antiviral defense. In order to investigate the role of the population dynamics of viral infection with CTL response, Pawelek et al. [8] constructed a mathematical model describing the basic dynamics of the interaction between the uninfected target cells, productively infected cells, free virus, and the CTL response cells, which is described by the following differential equation:
()
where the uninfected target cells are denoted by  x(t), productively infected cells are denoted by  y(t), free virus is denoted by  v(t), and the CTL response cells are denoted by  z(t). The parameter s represents the rate at which new target cells are created, d is the death rate of uninfected target cells, β is the infection rate of uninfected cells by virus, a is the death rate of productively infected cells, p represents the killing rate of infected cells by CTL response cells, k is the rate of the virus particles produced by infected cells, u is the viral clearance rate constant, c is the rate at which the CTL response is produced, and b is the death rate of the CTL response.

In order to incorporate the intracellular phase of the virus life cycle, we assume that virus production occurs after the virus entry by the constant delay τ1. The recruitment of virus-producing cells at time t is given by the number of the uninfected CD4+ T cells that were newly infected at time tτ1 and are still alive at time t [9, 10]. If we assume constant death rates m for infected CD4+ T cells but not yet producing virus particles, the probability of surviving the time period from tτ1 to t is . And the immune response plays an important role in eliminating or controlling the disease after human body is infected by virus. Antigenic stimulation generating CTLs may need a period of time τ2; that is, the CTL response at time t may depend on the population of antigen at a period time tτ2 [11].

Therefore, based on the discussion above, the model can be written in the following form:
()

The organization of this paper is as follows. In the next section we deal with some basic properties such as positivity and boundedness of the solutions and existence of equilibria of system (2). In Section 3, we prove the local stability of three possible equilibria. Further, by using the well-known Lyapunov-Lasalle invariance principle, we prove the global asymptotic stability of the infection-free equilibrium, CTL-absent infection equilibrium, and a special case of CTL-present equilibrium. By bifurcation theory, we also can prove that there is a stability switch for another special case for CTL-present equilibrium. In Section 4, one example is given to illustrate that our main results are applicable. In the final section, we offer a brief conclusion.

2. Basic Results

Based on the biological meaning, we will consider the system (2) with the following initial conditions:
()
Let X = C([−τ, 0];  R) be the Banach space of continuous functions mapping the internal [−τ, 0] into equipped with the sup-norm, where τ = max {τ1, τ2}. Based on the existence and uniqueness theory of solution for functional differential equations [12, 13], it is easy to show that there is a unique solution (x(t), y(t), v(t), z(t)) to system (2) with initial condition (3).

First we will discuss the positivity and boundedness of the solution.

Theorem 1. Let ((x(t), y(t), v(t), z(t)) be the solution of (2) satisfying conditions (3); then x(t), y(t), v(t), and z(t) are positive and ultimately bounded.

Proof. From (2), we have

()
This means that all the solutions of system (2) with initial condition (3) are positive. To prove the boundedness of the solution, denote
()
Calculating the derivative of N(t) along the solution of system (2) and by positivity of the solutions, we have
()
where q = min {d, a/2, u, b}. This implies that N(t) is bounded for large t. So x(t), y(t), v(t), and z(t) are ultimately bounded.

Next we will discuss the equilibria of system (2). The following is the basic reproductive ratio of system (2) which describes the average number of newly infected cells generated from one infected cell at the beginning of the infectious process:

()
By direct calculation we have that system (2) has three equilibria. Infection-free equilibrium E0 = (x0, 0,0, 0) = (s/d, 0,0, 0). If R0 > 1, there is a CTL-absent infection equilibrium
()
If R0 > 1 + βkb/ucd, then there is a CTL-present infection equilibrium
()

3. Stability Analysis of Delay Model (2)

In this section, we will analyse locally and globally asymptotic stability of the three equilibria.

3.1. Stability of Infection-Free Equilibrium E0

Theorem 2. For the infection-free equilibrium E0 of system (2);

  • (i)

    if R0 < 1, then E0 is locally asymptotically stable;

  • (ii)

    if R0 > 1, then E0 is unstable.

Proof. First, we will prove the local stability of E0. At the infection-free equilibrium E0, the characteristic equation for the corresponding linearized system of (2) becomes

()
Two of the roots of the characteristic equation (10) are λ1 = −b, and λ2 = −d. The remaining two roots are obtained by considering the following equation:
()
If λ has a nonnegative real part, then the modulus of the left-hand side of (11) satisfies
()
while the modulus of the right-hand side (11) satisfies
()
This leads to a contradiction. Thus, when R0 < 1, all the eigenvalues have negative real parts, and hence the infection-free steady state is locally asymptotically stable.

When R0 > 1, let

()
Then f(0) = auauR0 < 0, lim λ→+f(λ) = +. By the continuity of f(λ), there exists at least one positive root of f(λ) = 0. Thus, the infection-free equilibrium E0 is unstable if R0 > 1.

Theorem 3. If R0 < 1, then infection-free steady state E0 is globally asymptotically stable.

Proof. Define a Lyapunov functional

()
where x0 = d/s. Calculating the time derivative of V(t) along the solution of system (2), we obtain
()
Note that if and only if x = x0, y(t) = 0, z(t) = 0. By the second equation of (2), we also have v(t) = 0. Therefore, the maximal compact invariant set in is the singleton E0. By the Lasalle Invariance principle [12], the infection-free steady state E0 is globally attracting. Therefore, E0 is globally asymptotically stable.

3.2. Stability of the CTL-Absent Infection Equilibrium E1

Theorem 4. For the CTL-absent infection equilibrium E1 of system (2),

  • (i)

    if 1 < R0 < 1 + βkb/ucd, then E1 is locally asymptotically stable;

  • (ii)

    if R0 > 1 + βkb/ucd, then E1 is unstable.

Proof. At the CTL-absent infection equilibrium E1, the characteristic equation for the corresponding linearized system of (2) is

()
where
()
First we consider
()
When τ1 = 0, (19) becomes
()
As a1 = a + u > 0, a2 + a4 = (a + u)(d + (βksaud)/au) > 0, a3 + a5 = βksadu > 0, by Routh-Hurwitz criterion, we only need to show the following statement:
()
Thus all the roots of (19) have negative real parts when τ1 = 0.

Now we consider the distribution of roots of (19) while τ1 ≠ 0. If iw (w > 0) is a solution of (19), separating real and imaginary parts, it follows that

()
Squaring and adding the two equations of (22) yield
()
Letting r = w2, (23) becomes
()
where
()
By the Routh-Hurwitz criterion, (24) has no positive roots. This shows that (19) can not have a purely imaginary root.

Next, we analyze the transcendental equation

()
For τ2 = 0, if 1 < R0 < 1 + βkb/ucd, we have . This shows that the root of (26) is negative for τ2 = 0.

Now we only need to consider (26) in the case τ2 > 0. By letting λ = ωi (ω > 0) be a purely imaginary root of (26) for some ω > 0, we have

()
which implies that . Note that 1 < R0 < 1 + βkb/ucd; then ω2 < 0, which is a contradiction.

Therefore, we conclude that the characteristic equation (17) does not have any root with nonnegative real part. By the general theory of delay differential equations from Kuang [12], we see that if 1 < R0 < 1 + βkb/ucd, the equilibrium E1 is locally asymptotically stable.

Theorem 5. If 1 < R0 < 1 + βkb/ucd, then the CTL-absent infection equilibrium E1 of system (2) is globally asymptotically stable.

Proof. Denote g(ξ) = ξ − 1 − ln ξ, ξR+. Define a Lyapunov functional

()
By calculating the derivative of V(t) along the solution of system (2), we obtain that
()
Remember that
()
The equation above can be rewritten as
()
From (31), it follows that for all x, y, v, z > 0. D+V(t)|(2) = 0 if and only if . Then the globally asymptotic attractivity of E1 follows from Lyapunov-Lasalle invariance principle [12]. Therefore, E1 is globally asymptotically stable.

3.3. Stability of CTL-Present Infection Equilibrium E2

On the stability analysis of CTL-present infection equilibrium E2, we only consider the two special cases, that is, τ2 = 0, τ1 ≠ 0 and τ1 = 0, τ2 ≠ 0.

Firstly, we consider the local and global stability of E2 for the first case, and we have the following results.

Theorem 6. If τ2 = 0, τ1 ≠ 0 and R0 > 1 + βkb/ucd, then the CTL-present infection equilibrium E2 is locally asymptotically stable.

Proof. At equilibrium E2, the characteristic equation for the corresponding linearized system of (2) is

()
where δ = aucd/(ucd + kbβ). Further let τ2 = 0; then (32) becomes
()
By the continuous dependence of roots of the characteristic equation on R0, we know that the curve of the roots must cross the imaginary axis as R0 decreases sufficiently close to 1. That is, the characteristic equation (33) has a pure imaginary root λ = iω0 (ω0 > 0) if and only if the following statement is true:
()
We claim that the following inequality holds:
()
In fact, we have
()
It follows from |iω0 + d + βv* | ≥|iω0 + d|, |iω0 + u | ≥ u, and the inequality (35) that the modulus of the left-hand side of (34) is greater than the modulus of the right-hand side. This leads to a contradiction. Therefore, we conclude that (33) does not have any root with nonnegative real part. Thus, the CTL-present infection equilibrium E2 of system (2) is locally asymptotically stable when R0 > 1 + βkb/ucd in the case of τ2 = 0 and τ1 ≠ 0.

Theorem 7. If τ2 = 0, τ1 ≠ 0, and R0 > 1 + βkb/ucd, then the E2 is globally asymptotically stable.

Proof. Define a Lyapunov functional

()
where x*, y*, v*, and z* satisfy the following equations:
()
Calculating the derivative of V(t) along the solution of system (2) and using the similar method with the proof of Theorem 5, we have
()
Since 2 − x*/xx/x* ≤ 0, it follows that for all x, y, v, z > 0 and D+V|(2) = 0 if and only if (x(t), y(t), v(t), z(t)) = (x*, y*, v*, z*). Then the global attractivity of E2 follows from Lyapunov-Lasalle invariance principle [12]. Therefore the CTL-present infection equilibrium E2 of system (2) is globally asymptotically stable.

The following discussions focus on the stability of the equilibrium E2 in the second case. Let τ1 = 0 in (32); it follows that that

()
where
()
Let
()
Then we can rewrite (40) as follows:
()
Assume that P(λ, τ2) and Q(λ, τ2) are analytic functions in the right half-plane Reλ > −δ, where δ > 0.

Lemma 8. Consider (43); P(λ, τ2) and Q(λ, τ2) satisfy the following conditions:

  • (i)

    P(0, τ2) + Q(0, τ2) ≠ 0;

  • (ii)

    P(iw, τ2) + Q(iw, τ2) ≠ 0;

  • (iii)

    limsup {|Q(λ, τ2)/P(λ, τ2) | :|λ | → , Reλ ≥ 0} < 1 for any τ2;

  • (iv)

    F(w)≡|P(iw, τ2)|2−|Q(iw, τ2)|2 for real w, has at most a finite number of real zeros;

  • (v)

    each positive root w(τ2) of F(w, τ2) = 0 is continuous and differentiable at τ2 whenever it exists.

Proof. (i)  P(0, τ2) + Q(0, τ2) = a4 + b4 = (d + βv*)bu(δR0a) ≠ 0. This means λ = 0 is not a characteristic root of (43).

(ii) Consider

()

(iii) Since

()
we have limsup |λ|→,Reλ≥0|Q(λ, τ2)/P(λ, τ2)| < 1 for any τ2 > 0.

(iv) Since

()
It is obvious that property (iv) is satisfied.

(v) The last assertion is valid because F(w, τ2) is a quadratic polynomial in w2 and the fact that ai, bj (i, j = 1,2, 3,4) are all continuous functions of τ2. This completes the proof.

Let z = w2 and denote , , , and ; then (46) becomes
()

On the distribution of positive roots of (46), we have the following results.

Lemma 9. If u0 < 0, then (46) has at least one positive root.

Proof. Since F(w) = w8 + pw6 + qw4 + rw2 + u0 = 0 and F(0) = u0 < 0, lim w→+F(w) = +. Hence, there exists at least an w0 > 0 such that F(w0) = 0.

In the following, we will analyze the case u0 ≥ 0. Let z = yp/4; then (47) can be rewritten as

()
where p1 = −3p2/8 + q, q1 = p3/8 − pq/2 + r, r1 = −3p4/256 + (p2/16)qpr/4 + u0. If q1 = 0, then it is easy to obtain the four roots of (48) as follows
()
where . Thus zi = yi − (p/4) (i = 1,2, 3,4) are the roots of (47). Then we have the following result.

Lemma 10. Suppose that u0 ≥ 0 and q1 = 0.

  • (i)

    If Δ0 < 0, then (47) has no positive real roots.

  • (ii)

    If Δ0 ≥ 0, p1 > 0 and r1 > 0, then (47) has no positive real roots.

Based on Theorem  4.1 in [12] and Lemmas 810, we have the following results.

Theorem 11. (i) If u0 ≥ 0, q1 = 0;

  • (a)

    Δ0 < 0

  • (b)

    Δ0 ≥ 0, p1 > 0, and r1 > 0,

the equation F(w) = 0 has no positive roots. Then system (2) is stable for all τ2 ≥ 0.

(ii) If u0 < 0, the equation F(w) = 0 has at least one positive root and each positive root is simple; then stability switches may occur as τ2 increases. That is, there exists a positive number such that (2) is unstable for all . As τ2 varies from 0 to , at most a finite number of stability switches may occur.

4. Numerical Simulations

In the previous sections, we studied dynamical behaviors of the system (2) and obtained some important results. In this section, we perform a numerical analysis of the model based on Theorem 11.

Example 12. By corresponding to system (2), we consider the following system:

()
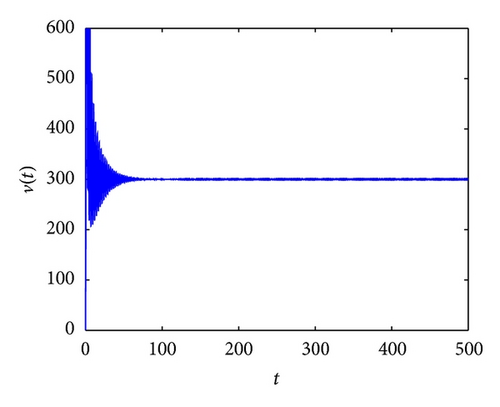
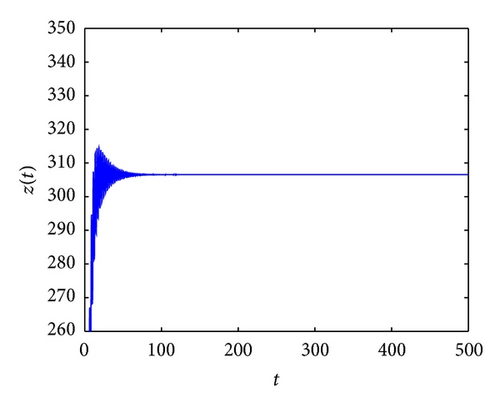
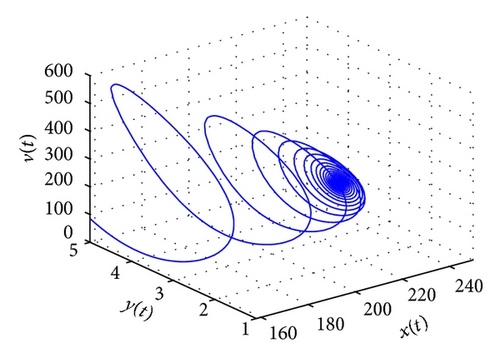
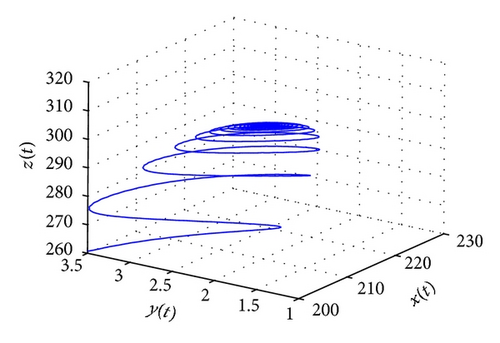
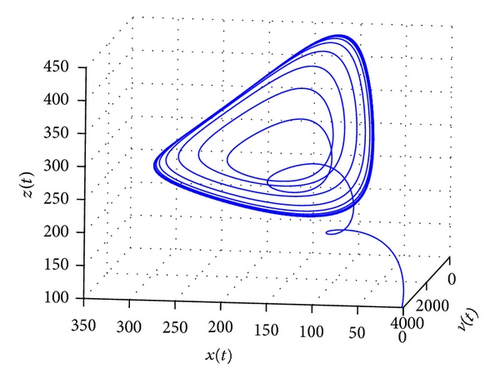
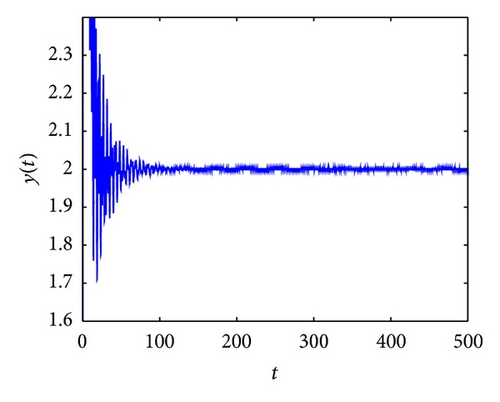
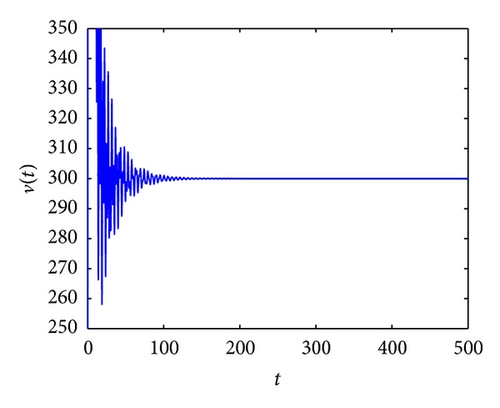
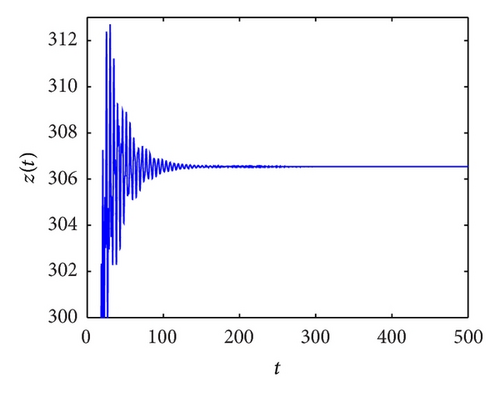
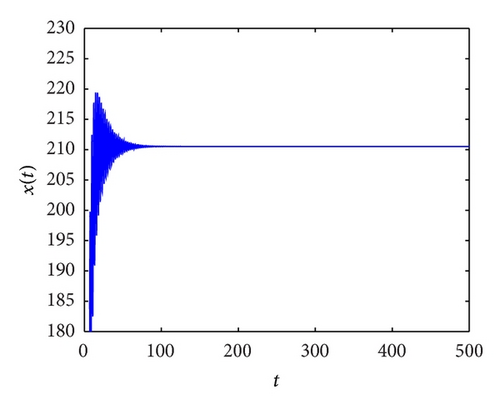
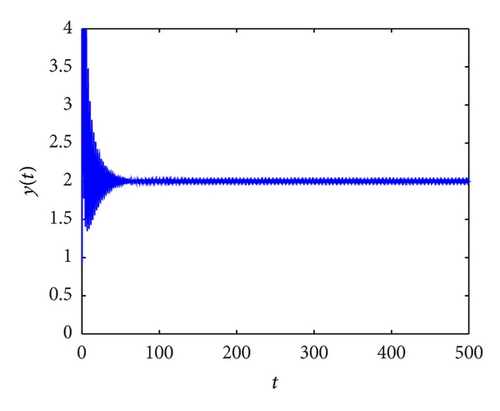
where τ1 = 0. By direct calculation we can get CTL-present infection equilibrium E2 = (210.5263,2.0000,300.0000,306.5395) for system (50).

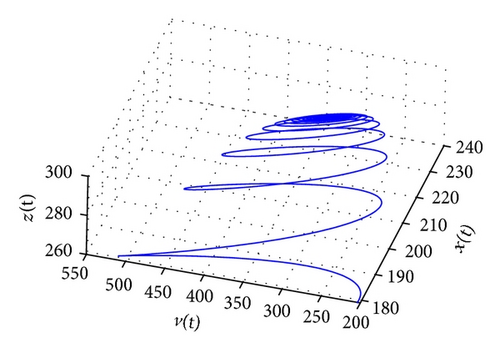
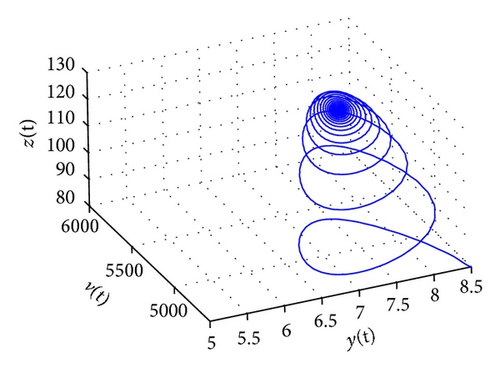
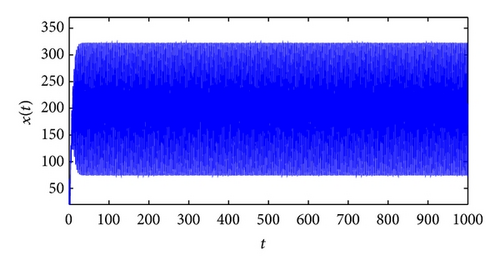
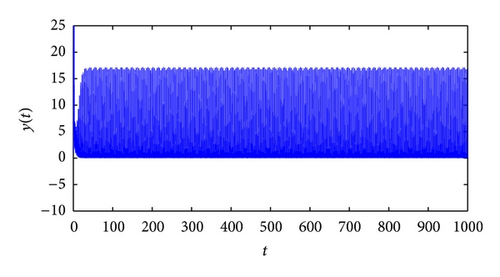
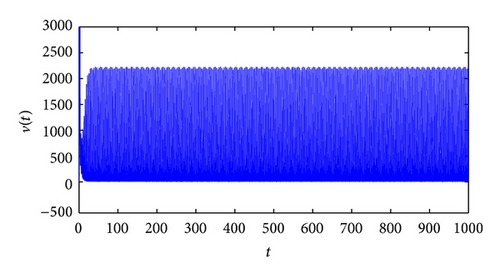
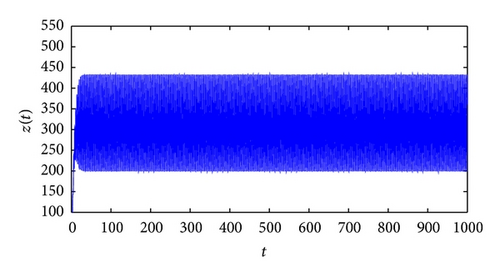
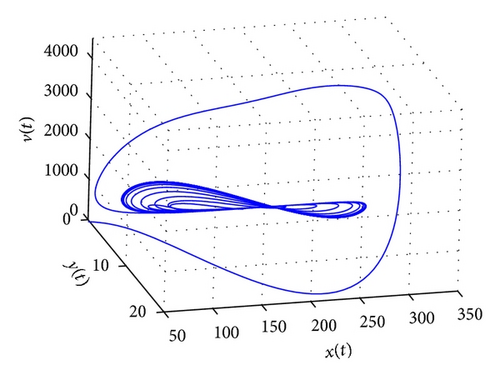
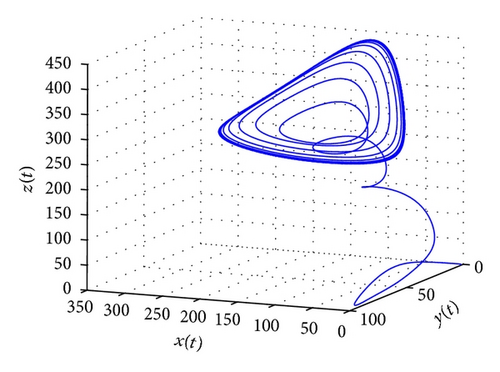
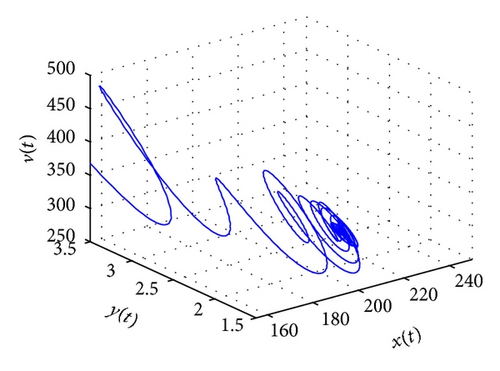
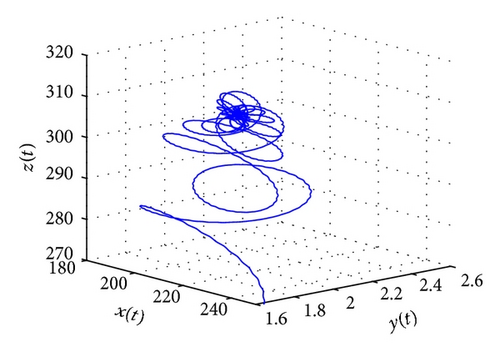
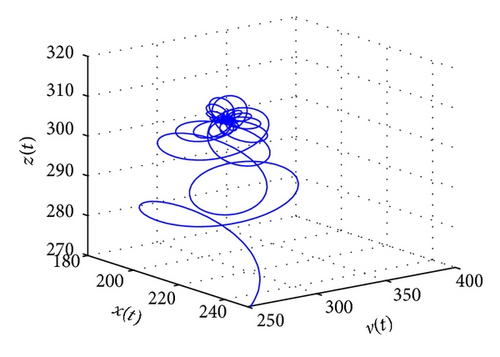
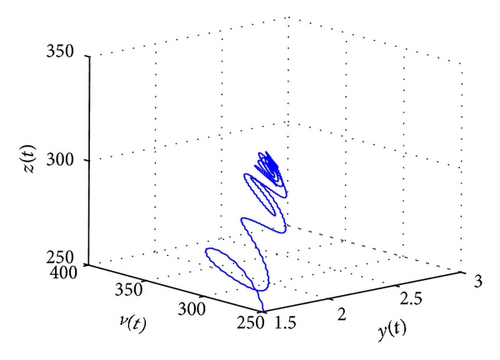
From the parameters given in system (50) and the values of τ2, we can see that there are two critical values of the delay τ2, denoted by and , . Simple numerical simulations show that the CTL-present infection equilibrium of system (50) is globally asymptotically stable for (see Figure 1). In this case, we take . The above CTL-present infection equilibrium E2 of system (50) is unstable for (see Figure 2). In this case, we take . The above CTL-present infection equilibrium E2 of system (50) is globally asymptotically stable for (see Figure 3). In this case, we take . From above analysis we can conclude that Hopf bifurcation occurs when .
Details are in the caption following the image
The time histories and the phase trajectories of system (50) before Hopf bifurcation occurs for τ2 = 0.2145.
Details are in the caption following the image
The time histories and the phase trajectories of system (50) before Hopf bifurcation occurs for τ2 = 0.2145.
Details are in the caption following the image
The time histories and the phase trajectories of system (50) before Hopf bifurcation occurs for τ2 = 0.2145.
Details are in the caption following the image
The time histories and the phase trajectories of system (50) before Hopf bifurcation occurs for τ2 = 0.2145.
Details are in the caption following the image
The time histories and the phase trajectories of system (50) before Hopf bifurcation occurs for τ2 = 0.2145.
Details are in the caption following the image
The time histories and the phase trajectories of system (50) before Hopf bifurcation occurs for τ2 = 0.2145.
Details are in the caption following the image
The time histories and the phase trajectories of system (50) before Hopf bifurcation occurs for τ2 = 0.2145.
Details are in the caption following the image
The time histories and the phase trajectories of system (50) before Hopf bifurcation occurs for τ2 = 0.2145.
Details are in the caption following the image
The time histories and the phase trajectories of the system (50) when Hopf bifurcation occurs for τ2 = 0.57.
Details are in the caption following the image
The time histories and the phase trajectories of the system (50) when Hopf bifurcation occurs for τ2 = 0.57.
Details are in the caption following the image
The time histories and the phase trajectories of the system (50) when Hopf bifurcation occurs for τ2 = 0.57.
Details are in the caption following the image
The time histories and the phase trajectories of the system (50) when Hopf bifurcation occurs for τ2 = 0.57.
Details are in the caption following the image
The time histories and the phase trajectories of the system (50) when Hopf bifurcation occurs for τ2 = 0.57.
Details are in the caption following the image
The time histories and the phase trajectories of the system (50) when Hopf bifurcation occurs for τ2 = 0.57.
Details are in the caption following the image
The time histories and the phase trajectories of the system (50) when Hopf bifurcation occurs for τ2 = 0.57.
Details are in the caption following the image
The time histories and the phase trajectories of the system (50) when Hopf bifurcation occurs for τ2 = 0.57.
Details are in the caption following the image
The time histories and the phase trajectories of the system (2) after Hopf bifurcation occurs for τ2 = 2.55.
Details are in the caption following the image
The time histories and the phase trajectories of the system (2) after Hopf bifurcation occurs for τ2 = 2.55.
Details are in the caption following the image
The time histories and the phase trajectories of the system (2) after Hopf bifurcation occurs for τ2 = 2.55.
Details are in the caption following the image
The time histories and the phase trajectories of the system (2) after Hopf bifurcation occurs for τ2 = 2.55.
Details are in the caption following the image
The time histories and the phase trajectories of the system (2) after Hopf bifurcation occurs for τ2 = 2.55.
Details are in the caption following the image
The time histories and the phase trajectories of the system (2) after Hopf bifurcation occurs for τ2 = 2.55.
Details are in the caption following the image
The time histories and the phase trajectories of the system (2) after Hopf bifurcation occurs for τ2 = 2.55.
Details are in the caption following the image
The time histories and the phase trajectories of the system (2) after Hopf bifurcation occurs for τ2 = 2.55.

5. Conclusions

In this paper, we have discussed HIV infection model with intracellular delay and CTL-response delay. We assume that the production of CTLs depends on the infected cells and CTL cells for some important biological meanings. Dynamical analysis of system (2) shows that intracellular delay τ1 and immune delay τ2 play different roles in the stability of the equilibrium. The results show that when R0 < 1, the infection-free equilibrium is globally asymptotically stable, which means that the viruses are cleared and immune is not active. When 1 < R0 < 1 + βkb/ucd, the CTL-absent infection equilibrium exists and is globally asymptotically stable, which means that the CTL immune response would not be activated and viral infection becomes vanished. When R0 > 1 + βkb/ucd and τ2 = 0, the CTL-present infection equilibrium is globally asymptotically stable. Actually, the intracellular delay does not affect the stability of the system. When R0 > 1 + βkb/ucd and τ1 = 0, system (2) may undergo a stability switch.

Disclosure

The authors declare that they have no financial or personal relationships with other people or organizations that can inappropriately influence their work; there is no professional or other personal interest of any nature or kind in any product, service and/or company that could be construed as influencing the position presented in, or the paper.

    Acknowledgment

    This work was supported by the National Natural Science Foundation of China (Grants nos. 11261056, 11261058, and 11271312).

        The full text of this article hosted at iucr.org is unavailable due to technical difficulties.