Mathematical Modeling and Analysis of the Kinetics of Thermal Inactivation of Enzyme
Abstract
A theoretical model of Illeova et al. (2003) thermal inactivation of urease is discussed. Analytical expressions pertaining to the molar concentrations of the native and denatured enzyme are obtained in terms of second-order reaction rate constant. Simple and closed form of theoretical expression pertains to the temperature are also derived. In this paper, homotopy analysis method (HAM) is used to obtain approximate solutions for a nonlinear ordinary differential equation. The obtained approximate result in comparison with the numerical ones is found to be in satisfactory agreement.
1. Introduction
Urease is a good catalyst for the hydrolysis of urea. Several excellent techniques are available to assess urease activity [1, 2]. In 1926, urease was isolated by Summner from the seeds of jack bean as a pure, crystalline enzyme [3]. These crystals, the first obtained for a known enzyme, played a decisive role in proving the protein nature of enzymes. Approximately 50 years later, jack bean urease was identified as the first nickel metalloenzyme [4]. A method for the determination of mercury (II) ions at trace levels is described. The method is based on the profound inhibitory effect of mercury on the enzyme urease [5]. For unknown reasons some seeds are particularly rich sources of urease, and this enzyme has been extensively studied in seeds of various Leguminosae, Cucurbitaceae, Asteraceae and Pinaceae [6, 7]. Jack bean urease, which is the most widely used plant urease, is a nickel containing oligomeric enzyme exhibiting a high degree of specificity to urea [8]. Numerous papers have been published on the applications of urease in biotechnology, including the determination of urea for analytical and biomedical purposes and analysis of heavy metal content in natural drinking water and surface water [9]. Hirai et al. [10] study the structural change of jack bean urease induced by addition of synchrotron radiation. Lencki et al. [11] discuss the effect of subunit dissociation, denaturation, aggregation, coagulation, and decomposition on enzyme inactivation kinetics. Omar and Beauregard [12] investigate the unfolding of jack bean urease by fluorescence emission spectroscopy.
To our knowledge, no rigorous analytical expressions of molar concentrations of the native enzyme, denatured enzyme, and temperature for thermal inactivation of urease for the parameters k+1, , , , h, TB, and K have been reported. The purpose of this communication is to derive simple approximate analytical expression for the nonsteady-state concentrations for thermal inactivation of urease using Homotopy analysis method.
2. Mathematical Formulation of Analysis and Problems
3. Concentrations of Native Enzyme Form, Denatured Enzyme Form, and Temperature under Nonsteady State Condition
4. Numerical Simulation
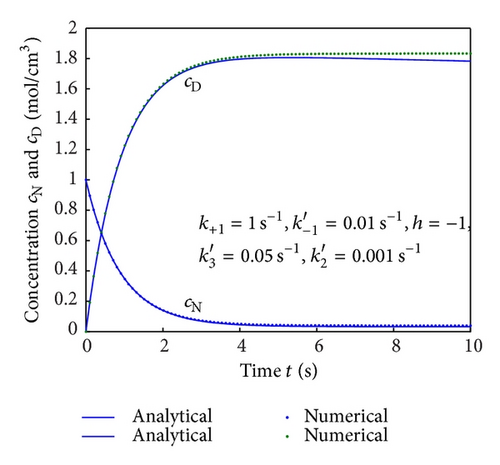
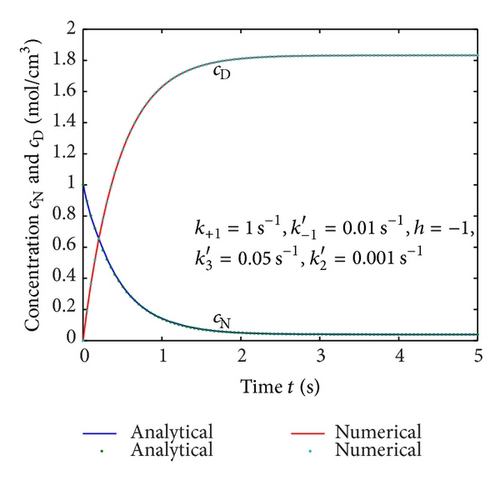
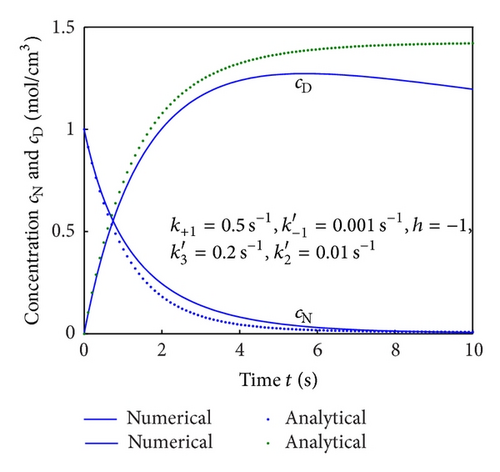
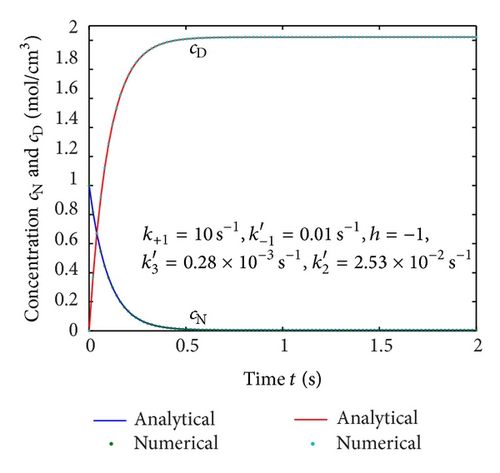
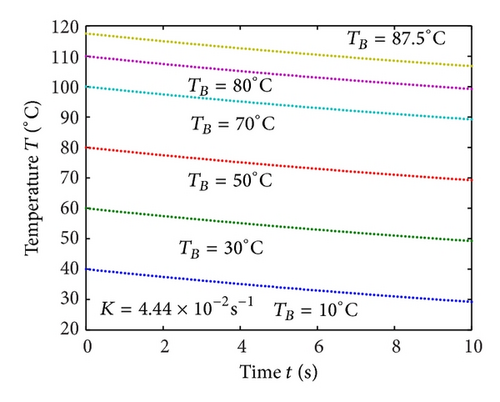
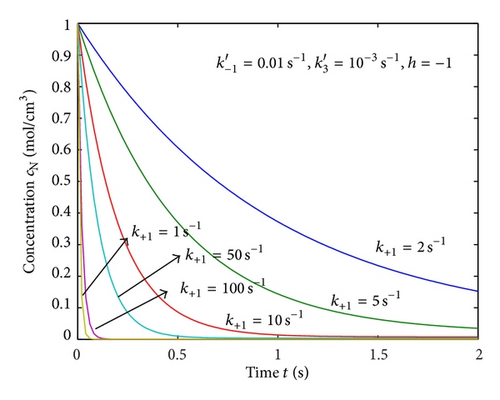
To show the efficiency of the present method, our nonsteady-state result is compared with numerical solution. Equations (4) and (5) are also solved by numerical method using Matlab/Scilab program. The Scilab/Matlab program [19] is also given in Algorithm 1. The numerical values of parameters employed in Illeova et al. [1] and in this study are given in Table 1. The numerical solution is compared with our analytical result in Figures 1(a)–1(e).
| Parameters | Range of parameters in [1] | Value of the parameter in this work | |||||
|---|---|---|---|---|---|---|---|
| Figures 1(a)–1(d) | Figure 1(e) | Figure 2(a) | Figure 2(b) | Figure 2(c) | Figure 3 | ||
| k+1 s−1 | (8.51 ± 0.29) × 10−1 | 1, 10 | 1–100 | 8.80 × 10⁻¹ |
|
0.01–1.5 | |
| (8.36 ± 0.28) × 101 | 0.01 | 0.01 | 1.64–8.64 × 101 | 8.64 × 101 | 0.1 | ||
| (1.74 ± 0.79) × 10−2 | 0.001–0.0253 | — | 2.66 × 10⁻⁴ | ||||
| (0.24 ± 0.04) × 10−3 | 0.00028–0.05 | 10−3 | 0.28 × 10⁻³ | 0.28 × 10⁻³ | 10−3 | ||
| K s−1 | 4.44 × 10⁻² | 4.44 × 10⁻² | |||||
| TB °C | 55–87.5 | 55–87.5 | |||||
-
Algorithm 1: Scilab/Matlab program to find the numerical solution of (2) and (3).
-
function main1
-
options= odeset (‘RelTol’,1e-6,‘Stats’,‘on’);
-
%initial conditions
-
T=100;
-
Xo = [1; 0; T+30];
-
tspan = [0,10];
-
tic
-
[t,X] = ode45(@TestFunction,tspan,Xo,options);
-
toc
-
figure
-
hold on
-
plot(t, X(:,1))
-
plot(t, X(:,2))
-
plot(t, X(:,3),‘.’)
-
legend(‘x1’,‘x2’,‘x3’)
-
ylabel(‘x’)
-
xlabel(‘t’)
-
return
-
function [dx_dt]= TestFunction(t,x)
-
k1=2;k2=0.1;k3=10∧(-3);k4=2.66*10∧(-3);K=4.44*10∧(-2);T=100;
-
dx_dt(1) =-k1*x(1)+k2*x(2)∧2-2*k3*x(1)∧2;
-
dx_dt(2) =2*k1*x(1)-2*(k2+k4)*x(2)∧2;
-
dx_dt(3)=K*(T-x(3));
-
dx_dt = dx_dt’;
-
return
5. Discussions
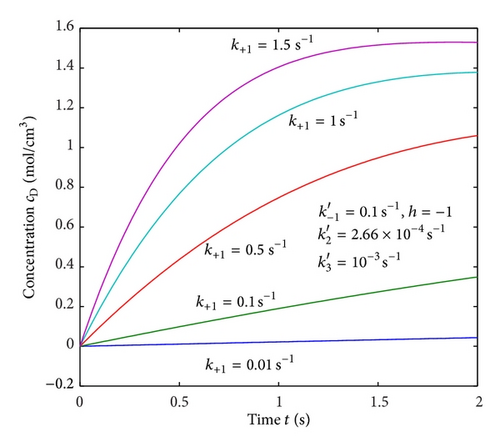
Equations (4) and (5) represent the closed form of an analytical expression of concentrations of native and denatured enzyme for all values of parameters. In Figures 1(a)–1(e), the analytical results are compared with numerical results for various values of parameters and satisfactory agreement is noted. Figures 1(a)–1(d) represent the molar concentrations for various values of rate constant. From the figure, it is inferred that, when time increases the concentration of cN decreases whereas the concentration of cD increases. The time taken to reach the maximum value of cD is the same as the time taken to reach the minimum value of cN. The steady value of cD and cN depends upon the rate constants.
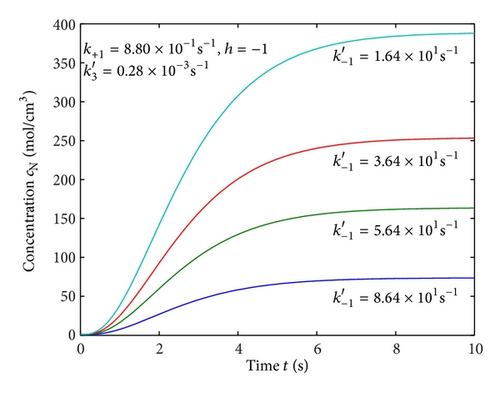
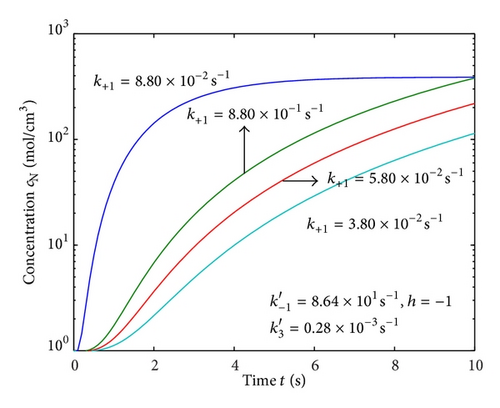
Figures 2(a)–2(c) represent the molar concentration of N versus time t for various values of rate constant k+1 and . From that figure, it is observed that, cN increases when k+1 and increase. Figure 3 represents the molar concentration of D versus time t for various values of parameter k+1. From this figure, it is found that, the value of concentration cD initially increases and reaches the steady state value when t ≥ 5. The concentration cD increases when k+1 increases. The concentration becomes zero when k+1 ≤ 0.01 s−1. Figure 1(e) denotes the representation temperature T versus time t for various values of TB. The value of temperature increases when TB increases. It is almost linear with respect to time t.
6. Conclusion
In this work, we obtained the analytical expression of concentrations in terms of rate constants k+1, , , , bath temperature TB, and coefficient in the enthalpy balance K. The nonlinear ordinary differential equations have been solved analytically. The closed analytical expressions of molar concentrations of cN, cD, and temperature T are obtained using the homotopy analysis method. An agreement with the numerical result is noted. The information gained from this theoretical model can be useful for the kinetic analysis of the experimental results over handling rate constants and molar concentrations.
Nomenclature
-
- cN:
-
- Molar concentration of the native enzyme form (mole/cm3)
-
- cD:
-
- Molar concentration of the denatured enzyme form (mole/cm3)
-
- k+1, k−1, k2, k3:
-
- Rate constants of individual reaction (s−1)
-
- , , :
-
- Modified rate constants (s−1)
-
- K:
-
- Coefficient in the enthalpy balance (s−1)
-
- TB:
-
- Bath temperature (K)
-
- T:
-
- Temperature (K)
-
- t:
-
- Time (s).
Acknowledgments
This work was supported by the Council of Scientific and Industrial Research (CSIR no. 01(2442)/10/EMR-II), the Government of India. The authors are thankful to Dr. R. Murali, the Principal, The Madura College, Madurai, and Mr. S. Natanagopal, the Secretary, Madura College Board, Madurai for their encouragement. It is a pleasure to thank the referees for their valuable suggestions.


