Effect of Fe Concentration on Fe-Doped Anatase TiO2 from GGA + U Calculations
Abstract
To comprehend the photocatalytic mechanisms of anatase Ti1−xFexO2 with various concentrations of Fe, this study performed first principles calculations based on density functional theory with Hubbard U on-site correction to evaluate the crystal structure, impurity formation energy, and electronic structure. We adopted the effective Hubbard U values of 8.47 eV for Ti 3d and 6.4 eV for Fe 3d. The calculations show that higher concentrations of Fe are easily formed in anatase TiO2 due to a reduction in the formation energy. The band gap of Fe-doped TiO2 decreases Fe doping level increases as a result of the overlap among the Fe 3d, Ti 3d, and O 2p states, which enhances photocatalytic activity in the visible light region. Additionally, a broadening of the valence band and Fe impurity states within the band gap might also contribute to the photocatalytic activity.
1. Introduction
The increase in global pollution has led researchers to search for new techniques and materials to promote environmental protection. Since Fujishima and Honda’s report in 1972 [1], the unique properties of TiO2 have attracted considerable attention in the fields of air and water purification, hydrogen production, and dyesensitized solar cells. Anatase TiO2 also has a wide band gap capable of only absorbing ultraviolet (UV) light (≤387 nm). UV light accounts for a small fraction (~5%) of the available solar energy; therefore, the utilization of solar energy is low. To improve the photocatalysis of TiO2, determining how to expand the optical absorption into the visible light region (~45%) has become a topic of considerable interest among researchers.
Considerable research has gone into modifying the band gap of TiO2. One of the most effective methods involves doping TiO2 crystals with impurities including transition metals, such as V [2], Mo [3], Fe [4–6], Co [7, 8], Pt [9], Au [10], and nonmetals such as N [11, 12], F [13], P [14], S [15]. Among these impurity elements, the radius of Fe3+ (0.64 Å) is similar to that of Ti4+ (0.68 Å) and is therefore easily incorporated into the TiO2 crystal [16]. In addition, the Fe3+ dopant can serve as a charge trap, impeding the electron-hole combination rate and enhancing photocatalysis within a range suitable to the concentration of the dopant [17]. Fe is considered an appropriate candidate element and has been widely studied [18–25]. Zhang et al. [18] prepared Fe-doped mesoporous TiO2 thin films and suggested that the doped Fe forms Fe3+ ions, which could play a role as e− or h+ traps, thereby reducing the e−/h+ pair recombination rate. Wang et al. [19] reported that the band gap of Fe-doped TiO2 thin films decreased from 3.29 to 2.83 eV with an increase in the Fe3+ content from 0 to 25 wt%. The decrease in unit cell volume indicates that Fe3+ replaced Ti4+ in the lattice, forming a solid solution. Some experimental results [20, 21] have found that Fe doping in TiO2 could narrow the band gap of TiO2, thereby increasing the efficiency of the photocatalysis in the visible range. Yalçin et al. [22] performed calculations based on density function theory (DFT) to characterize the influence of Fe3+ doping on the electronic and structural properties of TiO2. The results indicate that the visible light activity in Fe3+-doped TiO2 is due to the introduction of additional electronic states within the band gap.
Recently, first-principles calculations were conducted for Fe-doped TiO2, but these have been restricted to a single concentration of Fe [23–25]. To the best of our knowledge, few of these studies have focused on the photocatalytic mechanisms of Fe-doped anatase TiO2 with different Fe concentrations. Additionally, most theoretical calculations have greatly underestimated the band gap of TiO2 due to the adoption of the conventional DFT method, which is known to include an insufficient description of the on-site Coulomb interaction between electrons occupying the Ti 3d orbitals. This study performed first-principles calculations using the generalized gradient approximation + Hubbard U (GGA + U) approach to investigate the crystal structure, formation energy, and electronic structure of anatase Ti1−xFexO2. Various concentrations of Fe, x = 0.0625, 0.125, and 0.1875 (2.08, 4.17, and 6.25 at.%), were analyzed.
2. Calculation Models and Methods
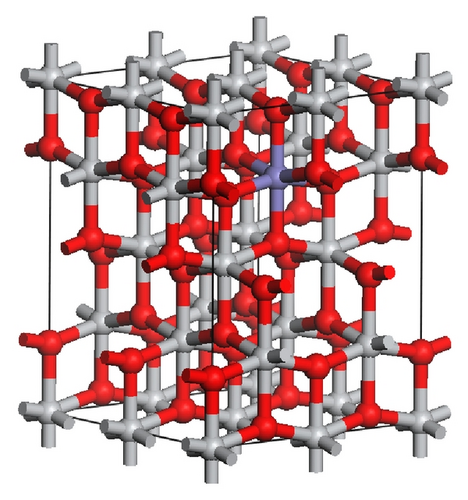
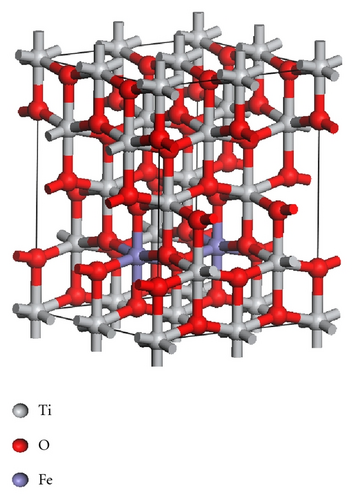
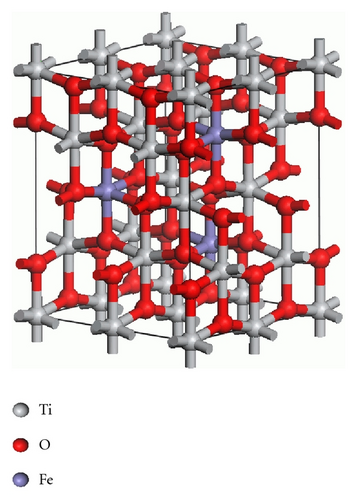
Anatase TiO2 has a tetragonal structure with lattice parameters a = b = 3.776 Å, c = 9.486 Å. To calculate various concentrations of Fe, a 2 × 2 × 1 supercell was constructed with 16 Ti and 32 O atoms, as shown in Figure 1(a). The calculations for the doping system were conducted for the 2 × 2 × 1 supercell containing one, two, and three Fe atoms in the substitutional sites of the Ti atoms, as shown in Figures 1(b)–1(d), which correspond to the Fe concentrations of 2.08, 4.17, and 6.25 at.%, respectively.

3. Results and Discussion
3.1. Structural Optimization
Table 1 summarizes the optimized lattice parameters, average bond lengths, and differences in volume, obtained from structure optimization. The optimized lattice parameters, a = b = 3.778 Å, and c = 9.549 Å, for pure anatase TiO2 are in good agreement with the experimental values of a = b = 3.782 Å and c = 9.502 Å [32], indicating that our calculations are reliable. In anatase TiO2, each Ti atom is bonded to its four nearest and two second nearest oxygen neighbors. Average bond lengths are represented as Ti–O1st and Ti–O2nd. With the same concentration of Fe, all of the Fe–O bond lengths are shorter than those of Ti–O. Therefore, the volume decreases with an increase in Fe concentration, which is consistent with the experimental results [33]. This indicates that Fe doping causes a contraction in the overall volume, which may be the result of the difference in the radii of the ions: 64 pm for Fe3+ and 68 pm for Ti4+.
| Fe (at.%) | Lattice parameters (Å) | Bond lengths (Å) | ΔV (%) | |||||
|---|---|---|---|---|---|---|---|---|
| a | b | c | Ti−O1st | Ti–O2nd | Fe–O1st | Fe–O2nd | ||
| 0.00 | 3.778 | 3.778 | 9.549 | 1.931 | 1.986 | |||
| 2.08 | 3.771 | 3.771 | 9.489 | 1.930 | 1.976 | 1.877 | 1.885 | −1.00 |
| 4.17 | 3.759 | 3.732 | 9.591 | 1.923 | 1.992 | 1.891 | 1.903 | −1.28 |
| 6.25 | 3.761 | 3.761 | 9.376 | 1.929 | 1.974 | 1.882 | 1.876 | −2.67 |
3.2. Hubbard U Parameter
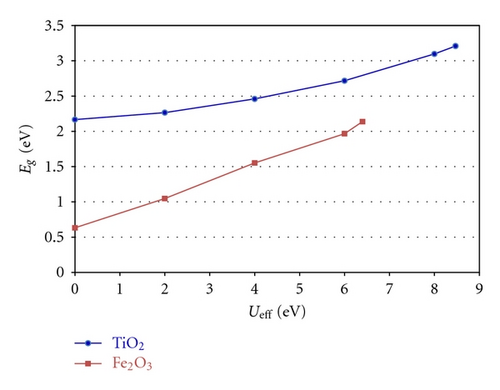
The GGA + U approach uses an intra-atomic electron-electron interaction for on-site correction to describe systems with localized d and f electrons, capable of producing a more optimal band gap. Determining an appropriate Hubbard Ueff parameter is necessary in GGA + U calculations to correctly interpret the intra-atomic electron correlation. As shown in Figure 2, for anatase TiO2, the band gap widens with an increase in the effective Hubbard Ueff of Ti 3d. The band gap was widened by increasing Ueff from 2 to 8 eV. Here, the on-site Coulomb interaction was Ueff = 8.47 eV for Ti 3d using the GGA + U approach and the calculated band gap of pure anatase is 3.21 eV, which is close to the experimental value of 3.2 eV. Using the same method, the Ueff = 6.4 eV of Fe 3d was determined by fitting the band gap of Fe2O3 (2.2 eV).
3.3. Formation Energy
| Fe (at.%) | Formation energy (eV) | |
|---|---|---|
| O-rich | Ti-rich | |
| 2.08 | −3.99 | 5.20 |
| 4.17 | −10.01 | 8.36 |
| 6.25 | −14.13 | 13.43 |
3.4. Electronic Structure
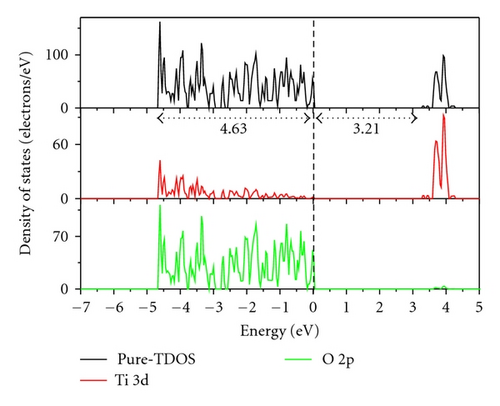
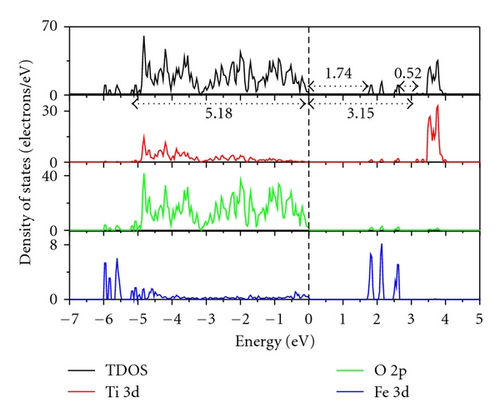
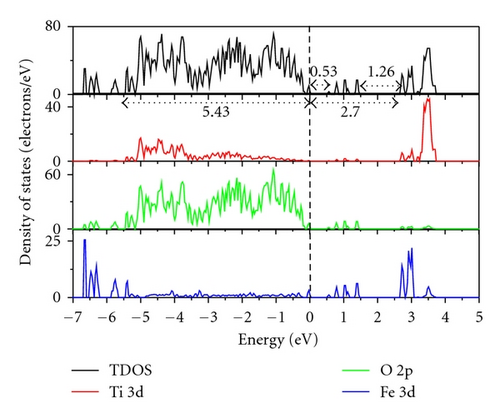
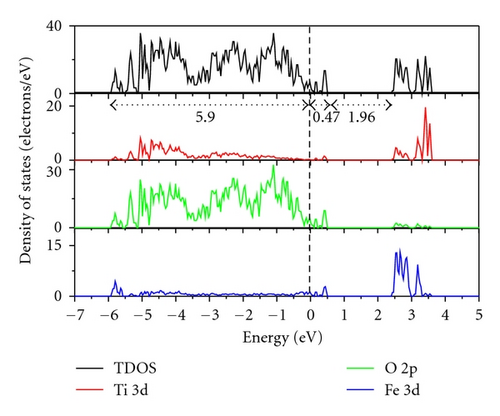
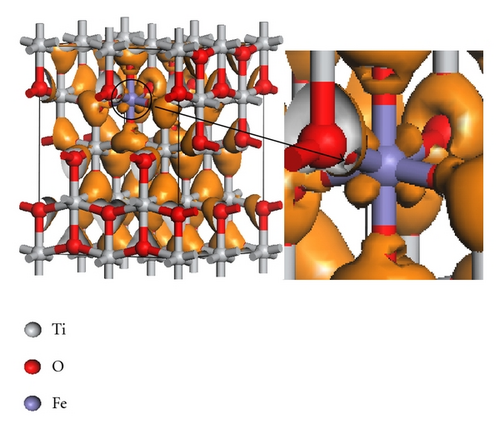
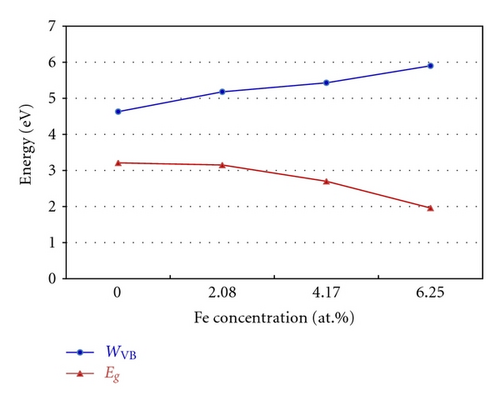
Figure 3 indicates the total density of states (TDOS), and the projected density of states (PDOS) to investigate the electronic properties of Fe-doped anatase TiO2. The zero-point energy is taken as the Fermi level. The band gap (Eg) of pure anatase TiO2 is 3.21 eV, as shown in Figure 3(a), and is consistent with the experimental value of 3.2 eV. In pure anatase TiO2, the valence band (VB) mainly comprises O 2p states with a small number of Ti 3d states, while the conduction band (CB) comprises Ti 3d states with a small number of O 2p states. This indicates that there exists a little covalence bond character between Ti and O atoms. The valence band of TiO2 has a large bandwidth (WVB) of approximately 4.63 eV, showing a strong delocalization among the O 2p electrons. At 2.08 at.% (Fe concentration) from Figure 3(b), we observe Fe 3d impurity states in the band gap ranging from 1.74 eV above the valence band maximum (VBM) to 0.52 eV below the conduction band minimum (CBM). The electrons in the VB can be excited to localized impurity states within the band gap and subsequently to the CB through the absorption of visible light. In addition, the substitutional Fe atom only transfers 3 electrons to the surrounding O atoms, which leads to unfilled O 2p orbitals and an electron remaining in the Fe3+ ion as shown in Figure 4. At 4.17 at.% (Figure 3(c)), the overlap of Fe 3d, Ti 3d, and O 2p bands near the CB results in a decrease in the CBM. Therefore, the band gap of Fe-doped TiO2 at 4.17 at.% narrows to 2.70. From 4.17 at.% to 6.25 at.% (Figure 3(d)), the CBM continuously moves toward the Fermi level and hybridization among Fe 3d, Ti 3d, and O 2p near the Fermi energy level also occur, resulting in a reduced band gap. Figure 5 shows the relationships between Eg and WVB and Fe concentration. Eg decreases with an increase in the Fe doping level, which is similar to other experimental results [18, 19]. It also reveals that the decrease in Eg from 2.08 at.% to 6.25 at.% is more obvious than that from 0 to 2.08 at.%. WVB increases with an increase in Fe concentration due to the contribution from the lower Fe 3d band, which benefits the hole mobility in VB. As a result, the electron transition energy from the valence band to the conduction band decreases as a result of Fe-doping, which may induce a red shift at the edge of the optical absorption range. In addition, the valence band was found to broaden after Fe was incorporated into TiO2 due to the contribution from the lower Fe 3d states. WVB broadens with an increase in Fe concentration. The wider valence band results in an increase in the mobility of the photogenerated electron-hole pair. In this manner, both the narrowing of the band gap and the increased mobility of the photogenerated carriers can improve the photocatalytic activity under visible light.
4. Conclusions
This study used the GGA + U method to investigate the influence of doping concentration on the crystal structure, impurity formation energy, and electronic properties of Fe-doped anatase TiO2. We adopted the effective Hubbard U values, 8.47 eV for Ti 3d and 6.4 eV for Fe 3d, to accurately determine the band gap in the experiments. The calculated results imply that higher concentrations of Fe facilitate the formation of anatase TiO2. In addition, doping anatase TiO2 with Fe can effectively narrow the band gap, thereby increasing photocatalytic activity in the visible light region and the trend of band gap decreases with an increase in Fe concentration. Both the broadening of the valence band and Fe impurity states within the band gap might also enhance photocatalytic activity.
Acknowledgments
This work was supported by the National Science Council in Taiwan (NSC 100-2221-E-131-017), for which the authors are grateful. They also acknowledge the National Center for High-performance Computing for computer time and the use of its facilities.


