Numerical Simulation of Unsteady Compressible Flow in Convergent Channel: Pressure Spectral Analysis
Abstract
This study deals with the numerical solution of a 2D unsteady flow of a compressible viscous fluid in a channel for low inlet airflow velocity. The unsteadiness of the flow is caused by a prescribed periodic motion of a part of the channel wall with large amplitudes, nearly closing the channel during oscillations. The flow is described by the system of Navier-Stokes equations for laminar flows. The numerical solution is implemented using the finite volume method (FVM) and the predictor-corrector Mac-Cormack scheme with Jameson artificial viscosity using a grid of quadrilateral cells. Due to the motion of the grid, the basic system of conservation laws is considered in the arbitrary Lagrangian-Eulerian (ALE) form. The numerical results of unsteady flows in the channel are presented for inlet Mach number M∞ = 0.012, Reynolds number Re∞ = 4481, and the wall motion frequency 100 Hz.
1. Introduction
A current challenging question is a mathematical and physical description of the mechanism for transforming the airflow energy in human vocal tract (convergent channel) into the acoustic energy representing the voice source in humans. The voice source signal travels from the glottis to the mouth, exciting the acoustic supraglottal spaces, and becomes modified by acoustic resonance properties of the vocal tract [1]. The airflow coming from the lungs causes self-oscillations of the vocal folds, and the glottis completely closes in normal phonation regimes, generating acoustic pressure fluctuations. In this study, the movement of the boundary channel is known, harmonically opening and nearly closing in the narrowest cross-section of the channel, making the investigation of the airflow field in the glottal region possible.
Acoustic wave propagation in the vocal tract is usually modeled from incompressible flow models separately using linear acoustic perturbation theory, the wave equation for the potential flow [2], or the Lighthill approach on sound generated aerodynamically [3].
Goal of this work is numerical simulation of compressible viscous flow in 2D convergent channel which involves attributes of real flow causing acoustic perturbations as is “Coandă phenomenon’’ (the tendency of a fluid jet to be attracted to a nearby surface), vortex convection and diffusion, jet flapping, and so forth along with lower call on computer time, due to later extension in 3D channel flow. Particular attention is paid to the analysis of acoustic pressure signal from the channel.
2. Mathematical Model
General Reynolds number in (2.1) is computed from reference variables . The nondimensional dynamic viscosity in the dissipative terms is a function of temperature in the form η = (T/T∞) 3/4. The heat transfer coefficient is expressed as k = ηκ/[Pr(κ − 1)], where Pr = 0.7 is the Prandtl number.
3. Computational Domain and Boundary Conditions
For phonation of vowels, the frequencies of the vocal folds oscillations are in the region from cc 82 Hz for bass up to cc 1170 Hz for soprano in singing voice, and the airflow velocity in the trachea is approximately in the range of 0.3–5.2 ms−1 taking into account the tracheal diameter in humans in the range 14.5–17.6 mm [2].
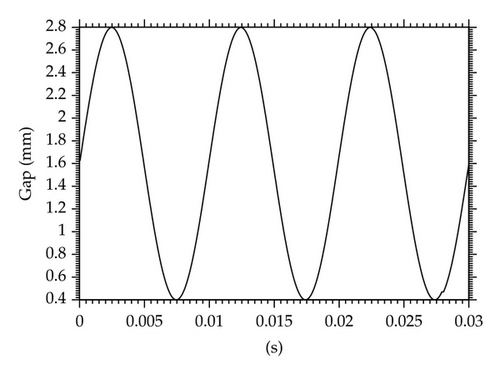
The bounded computational domain D1, used for the numerical solution of flow field in the channel, is shown in Figure 1. The domain is a symmetric channel, the shape of which is inspired by the shape [5] of the trachea (inlet part of the channel), vocal folds, false vocal folds and supraglottal spaces (outlet part). The upper and the lower boundaries are the channel walls. A part of the wall changes its shape between the points A and B according to a given harmonic function of time and axial coordinate (see, e.g., [6]). The gap g(t) is the narrowest part of the channel (in point C). The gap width was oscillating with frequency 100 Hz (typical for normal male voice) between the minimum gmin = 0.4 mm and maximum gmax = 2.8 mm, not closing the channel completely.

- (1)
upstream conditions: , v∞ = 0, ρ∞ = 1, and p∞ is extrapolated from domain D1;
- (2)
downstream conditions: p2 = 1/κ and (ρ, ρu, ρv) are extrapolated from D1;
- (3)
flow on the wall: (u, v) = (uwall, vwall) where (uwall, vwall) is velocity vector of the wall and where T = κp/ρ is the temperature.
The general Reynolds number in (2.1) multiplied with nondimensional value M∞H represents kinematic viscosity scale, and for computation of the real problem, inlet Reynolds number is used.
4. Numerical Solution
The numerical solution uses FVM in conservative cell-centered form on the grid of quadrilateral cells, see, for example, [4].
The bounded domain is divided into mutually disjoint subdomains Di,j (i.e., quadrilateral cells). The system of (2.1) is integrated over the subdomains Di,j using the Green formula and the mean value theorem. In the time-changing domain, the integral form of FVM is derived using the ALE formulation. The ALE method defines homeomorphic mapping of the reference domain Dt=0 at initial time t = 0 to a domain Dt at t > 0 [7].
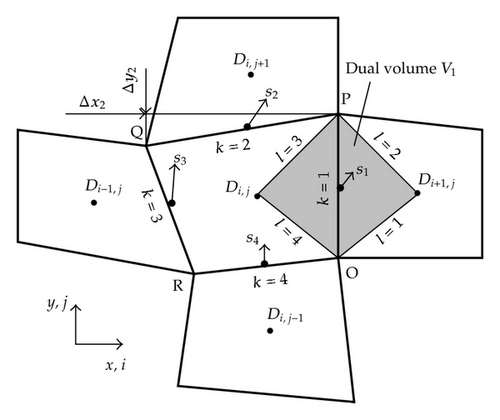
The approximations of the convective terms sWk and the numerical viscous fluxes on the edge k are central. The higher partial derivatives of velocity and temperature in are approximated using dual volumes (see [4]) shown in Figure 2. The inviscid numerical fluxes are approximated by the physical fluxes from the cell on the left side of the current edge in the predictor step and from the cell on the right side of the current edge in the corrector step.
The last term used in the MC scheme is the Jameson artificial dissipation AD(Wi,j) n [8]. Artificial dissipation is used to stabilize computation and also due to velocity gradients in the narrowest width of the channel, where M∞ ≈ 0.5. The vector of conservative variables is computed at a new time level tn+1: .
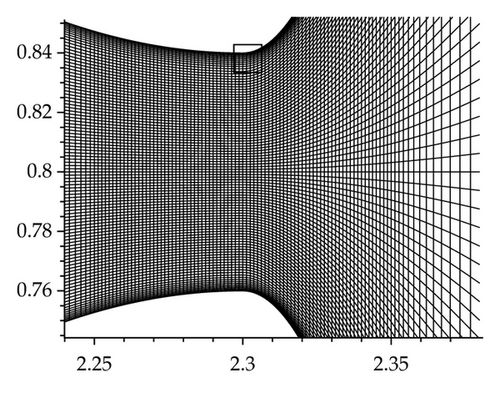
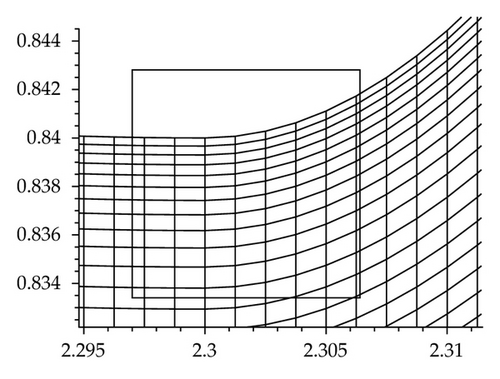
The grid used in the channel has successive refinement cells near the wall. The minimum cell size in y-direction is to capture the boundary layer effects. Figure 3 shows the detail of the grid in domain D1 in the narrowest channel cross-section at the middle position of the gap.
5. Numerical Results
The numerical results were obtained (using a specifically developed program) for the following input data: Mach number M∞ = 0.012 (), Reynolds number Re∞ = 4481, atmospheric pressure p2 = 1/κ ( Pa) at the outlet, and wall oscillation frequency . The computational domain contained 450 × 100 cells in D1.
The computation has been carried out in two stages. First, a steady numerical solution is obtained, when the channel between points A and B has a rigid wall fixed in the middle position of the gap width. Then this solution is used as the initial condition for the unsteady simulation.
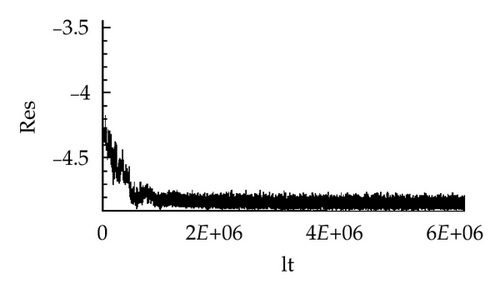
Figure 4 shows the initial condition for unsteady computation of the flow field in domain D1 and the convergence to the steady-state solution computed using the L2 norm of momentum residuals (ρu). The maximum Mach number computed in the flow field Figure 4(a) was Mmax = 0.177 (corresponding to the dimension velocity ). The picture displays nonsymmetric flow developed behind the narrowest channel cross-section. The graph in Figure 4(b) indicates the nonstationary solution of initial condition which is caused probably by eddies separated in the unmovable glottal orifice and floating away.
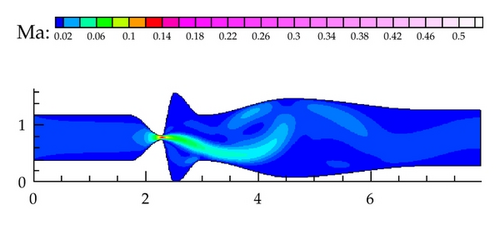
The numerical simulation of the airflow computed in domain D1 over the fourth cycle of the wall oscillation is presented in Figure 5 showing the unsteady flow field in five time instants during one vibration period. Large eddies are developing in supraglottal spaces and a “Coand’’ effect is apparent in the flow field pattern. The absolute maximum of Mach number Mmax = 0.535 () in the flow field during fourth cycle was achieved at time t = 34.2 ms (g = 1.002 mm, opening phase) behind the narrowest channel cross-section. The flow becomes practically periodic after the first period of oscillations.


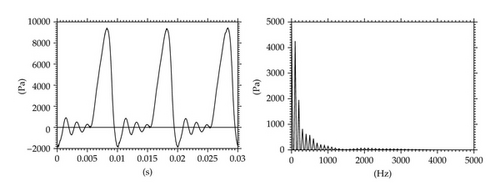
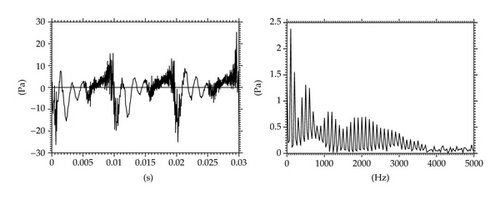
Figure 6 shows three vibration periods of the gap width oscillation (a) and the acoustic pressures signals computed in the gap (b) and at the outlet (c) on the axis of the channel. The acoustic pressure was calculated by subtracting the average values of the pressure signals pac = p − p2. The acoustic pressure time dependent data are transformed to frequency-dependent data (acoustic pressure spectrum) using discrete fourier transformation (DFT) of the signals. The spectrum of the pressure in the glottis, Figure 6(b)-right, shows the dominant fundamental frequency of vocal folds model oscillations Hz and the generated higher harmonics as a consequence of the throttling and nearly closing the glottal gap g(t). Two different regimes are apparent in the acoustic pressure signal at the channel outlet during one vibration period of the glottis in Figure 6(c)-left. Relatively smooth signal containing low frequencies is dominant in the time interval corresponding to the phase of maximum glottal opening, and a very noisy signal containing high frequencies is associated with the phase of minimum glottal opening. Four acoustic resonances of the channel cavity at about , , , and Hz can be identified in the spectrum envelope of the pressure at the channel outlet in Figure 6(c)-right. The first acoustic resonance (see spectrum peak at cc 500 Hz) corresponds to the first eigenfrequency of a simple tube of the length of the complete channel closed at the inlet and open at the outlet (). The acoustic resonances are more damped with increasing frequency, which can be caused by the fluid viscosity as well as by a numerical viscosity implemented in the numerical method (constants magnitude in AD(Wi,j) n).
Remark 5.1. We used several tests on fine and coarse grids in the computational domain. Also the domain has been prolonged in upstream and also in downstream part. Achieved results were approximately the same on fine grid.
Remark 5.2. The mathematical model (2.1) of laminar flow used in this case is debatable. For the first approximation, we supposed unformed turbulent flow at the inlet part of the channel.
Remark 5.3. The validation of computations for this case is not complete because of experiments absence. Semivalidation of the computations is comparison with particle image velocimetry method (PIV) experiment, but we can compare only qualitative behavior of the flow. Full validation of the code for subsonic and transonic flow through a turbine cascade computed in periodic domain is showed, for example, in [10].
6. Discussion and Conclusions
The numerical solution in the channel showed large vortex structures developed in the supraglottal space moving slowly downstream and decaying gradually. It was possible to detect a “Coand phenomenon” in the computed flow field patterns. A similar generation of large-scale vortices, vortex convection and diffusion, jet flapping, and general flow patterns were experimentally obtained in physical models of the vocal folds by using PIV method in [5, 11, 12].
The results show that some numerical results of viscous flow in a symmetric channel using a symmetric grid and scheme can be nonsymmetrical, depending on the geometry and the Reynolds number. This effect was observed also for laminar transonic flow computation [13]. The assumption of the axisymmetry solution for the axisymmetry channels (see [6]) excludes modeling the “Coand” effect and large vortex structures of the size comparable with the cross-section of the channel.
The analysis of the computed pressure revealed basic acoustic characteristics of the channel. This is promising result for future studies for a direct modeling of human voice generated by the flow in vibrating glottis taken into account a real shape of the human vocal tract for phonation and throttling the glottal gap width up to zero.
Acknowledgment
This paper was partially supported by Research Plans MSM 6840770010, GAČR P101/11/0207 and 201/08/0012.


