Magnetohydrodynamic and Slip Effects on the Flow and Mass Transfer over a Microcantilever-Based Sensor
Abstract
Hydromagnetic flow and mass transfer of a viscous incompressible fluid over a microcantilever sensor surface are studied in the presence of slip flow. In addition, chemical reaction at the sensor surface is taken into account. The governing equations for the flow are reduced to a local nonsimilarity form. Resulting equations are solved numerically for various values of flow parameters. Effects of physical quantities on the velocity and concentration profiles are discussed in detail.
1. Introduction
Diagnosis of small molecules is extremely important in biomedical and environmental applications. Recent advances in micro- and nanofabrication techniques have boosted developments of novel sensors for this purpose. In particular, microcantilever-based sensors (Mcs) are distinguished from the others because of their high sensitivity, lower cost, simple procedure, quick response, and real-time sensing characteristics [1, 2]. Microcantilever-based sensors are simple mechanical devices. They are anchored from one end to a fixed support and have various transducer mechanisms such as atomic force microscopy (AFM), mass, temperature, electromagnetic field, surface stress, and medium viscoelasticity [3–10].
Usually, only one surface of the Mcs is coated with a specific receptor, which reacts with the analytes in the solution. As a result of the reaction, adhesion of analytes to surface leads to deflection at the free tip of the Mcs, which can be detected with optical or electrical methods. This motion gives useful information for the diagnosis of biological and chemical agents, drug discovery, and monitoring of complex diseases [2, 11–13].
Microcantilever-based sensors are often mounted inside a fluidic cell to provide faster detection of target analytes and to prevent possible contamination of samples during the analysis [14–16]. However, sensing and detection performance of the Mcs are significantly affected by the surrounding flow conditions. Khaled and Vafai [17] considered hydromagnetic-squeezed flow and heat transfer over a sensor surface and found that both local wall shear stress and local Nusselt number increase with increasing magnetic and squeezing free stream velocity. Mahmood et al. [18] analyzed flow and heat transfer over a porous sensor surface and found that when the channel is squeezed, the skin friction reduces but the heat transfer coefficient increases on the sensor surface. Khaled et al. [19] investigated microcantilever deflections under oscillating flow conditions in the presence of chemical reaction at the receptor surface. Khanafer and Vafai [20] studied geometrical and flow configurations for enhanced microcantilever detection within a fluidic cell. Results of that investigation showed that as the height of the fluidic cell decreases, mass transfer enhances due to an increase in the axial velocity along the microcantilever. Islam et al. [21] tried enhancing microcantilever capability with integrated AC electroosmotic trapping. Khanafer et al. [22] considered fluid-solid interaction of flow and heat transfer characteristics around a flexible microcantilever in a fluidic cell.
The above-mentioned studies are conducted with the no-slip assumption at the solid-liquid interface. Nonetheless, slip flow may exist due to small dimensions of microcantilever and may play an important role in the formation of momentum and mass transfer boundary layers [23]. The velocity slip of liquid on the sensor surface is related to the slip length and the gradient of velocity [24]. In the present paper, we consider the hydromagnetic flow and mass transfer of a viscous incompressible fluid over the Mcs in the presence of slip flow with adhesion of analytes taken into account at the surface of Mcs. The governing equations are converted into the dimensionless system of equations using nonsimilarity variables. The local nonsimilarity solutions are obtained for the velocity and concentration distributions. The results are shown in figures and effects of flow parameters are discussed.
2. Governing Equations
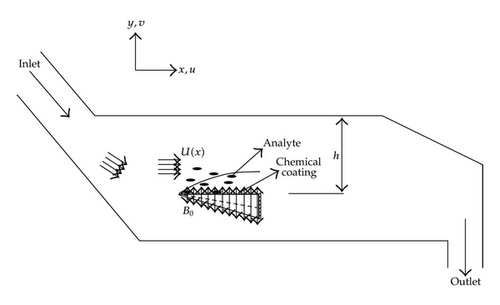
Here M is the dimensionless magnetic parameter, α is the slip parameter, ∧ is the dimensionless reaction rate constant, and Sc is the Schmidt number.
3. Results and Discussions
The nonlinear ordinary differential equation system (2.10)–(2.13) with boundary conditions in (2.14) are solved numerically by applying a finite difference code which implements the three-stage Lobatto IIIA formula that provides continuous solutions of fourth-order accuracy in the problem domain. Description of the numerical method is given in [28, 29]. Results are obtained only for f, θ and their derivatives, which are physically relevant and displayed graphically for various values of problem parameters to see developments in the velocity and concentration fields.
The variation of dimensionless horizontal velocity profiles is shown for various values of the velocity power-law index m in Figure 2 for M = 0 (in the absence of external magnetic field) and α = 0.1. It is clear that the velocity boundary layer thickness over the wedge type sensor (m > 0) is thinner than that of a flat sensor type (m = 0). The effects of the streamwise location on the velocity profiles are also shown. Horizontal velocity decreases with increase of ξ, which is expected.

Figure 3 indicates that an increase in the slip parameter causes a reduction in the boundary layer thickness. Figure 4 is depicted to show the variations in the velocity field for flat and wedge sensor types in the presence of magnetic field. The horizontal velocity increases and hence the boundary layer thickness decreases for an applied magnetic field.

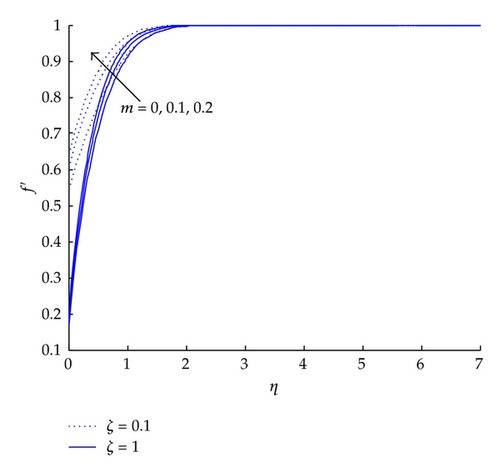
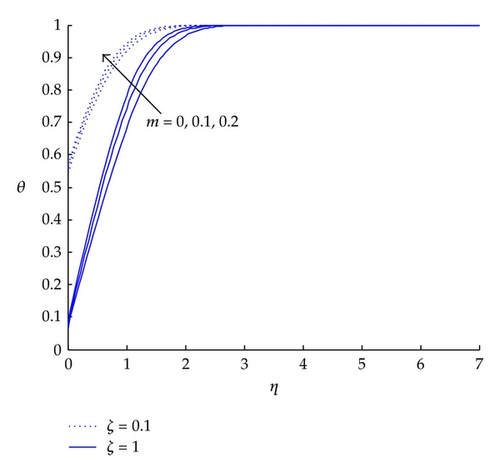
Figure 5 displays concentration profiles of the analytes for different sensor types. It is obvious that surface concentration values increase with increase of m and boundary layer thickness increases along the streamwise direction.
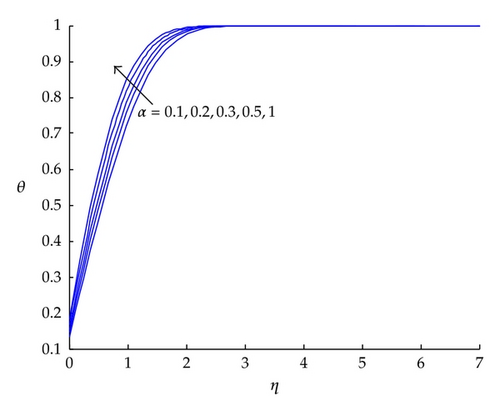
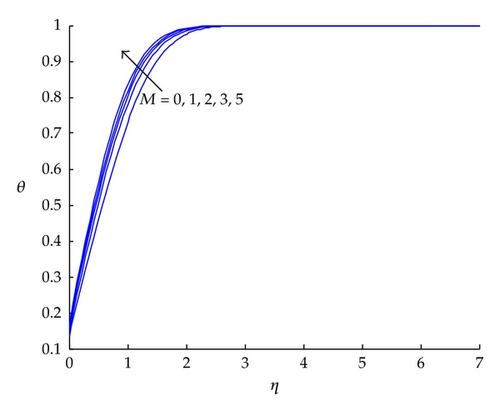
Figures 6 and 7 are plotted to examine the effects of the slip parameter and magnetic parameter on the concentration fields. It can be seen that analyte concentration increases with increase of either α or M in the boundary layer region.
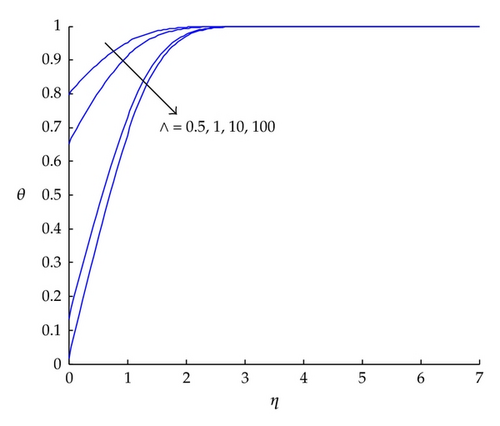
The variation of concentration profiles for different values of dimensionless reaction rate constant is presented in Figure 8. As reaction rate constant ∧ increases, the analyte concentration at the sensor surface decreases. For large values of ∧, reaction becomes faster and consumption (adhesion) of the analytes at the sensor surface increases. Thus, the boundary layer thickness increases with increase of ∧.
Tables 1 and 2 show the dimensionless velocity, concentration, and their gradient values at the sensor surface for various streamwise locations. It is understood that surface velocity f′(0) increases notably with increase of m, M, and α for any streamwise location. In addition to this, the velocity gradient f′′(0) increases with increase of m and M, which is expected. On the other hand, values of f′′(0) decreases with increase of slip parameter α because of the increasing velocity at the sensor surface. Moreover, the surface concentration of analytes θ(0) decreases along the streamwise direction, while concentration gradient first increases to a certain streamwise location and after this location, it decreases for various values of m, M, and α as shown in Tables 1 and 2.
| m = 0.1, M = 0, Sc = 250, α = 0.1, ∧ = 60 | m = 0.3, M = 0, Sc = 250, α = 0.1, ∧ = 60 | |||||||
|---|---|---|---|---|---|---|---|---|
| ξ | f′(0) | f′′(0) | θ(0) | θ′(0) | f′(0) | f′′(0) | θ(0) | θ′(0) |
| 0.1 | 0.6024 | 0.6024 | 0.7669 | 4.6014 | 0.6643 | 0.6643 | 0.7769 | 4.6615 |
| 0.2 | 0.3961 | 0.7922 | 0.5525 | 6.6303 | 0.4755 | 0.9510 | 0.5838 | 7.0058 |
| 0.3 | 0.2878 | 0.8634 | 0.4003 | 7.2058 | 0.3644 | 1.0992 | 0.4423 | 7.9607 |
| 0.4 | 0.2244 | 0.8976 | 0.3011 | 7.2264 | 0.2936 | 1.1744 | 0.3442 | 8.2616 |
| 0.5 | 0.1835 | 0.9173 | 0.2359 | 7.0775 | 0.2452 | 1.2261 | 0.2762 | 8.2857 |
| 0.6 | 0.1550 | 0.9300 | 0.1915 | 6.8934 | 0.2103 | 1.2618 | 0.2278 | 8.2003 |
| 0.7 | 0.1341 | 0.9390 | 0.1599 | 6.7171 | 0.1839 | 1.2876 | 0.1923 | 8.0767 |
| 0.8 | 0.1182 | 0.9457 | 0.1367 | 6.5601 | 0.1636 | 1.3073 | 0.1655 | 7.9450 |
| 0.9 | 0.1057 | 0.9509 | 0.1190 | 6.4238 | 0.1470 | 1.3228 | 0.1448 | 7.8177 |
| 1.0 | 0.0955 | 0.9550 | 0.1051 | 6.3061 | 0.1335 | 1.3353 | 0.1283 | 7.6995 |
| m = 0.1, M = 2, Sc = 250, α = 0.1, ∧ = 60 | m = 0.1, M = 0, Sc = 250, α = 1, ∧ = 60 | |||||||
|---|---|---|---|---|---|---|---|---|
| ξ | f′(0) | f′′(0) | θ(0) | θ′(0) | f′(0) | f′′(0) | θ(0) | θ′(0) |
| 0.1 | 0.6045 | 0.6045 | 0.7672 | 4.6032 | 0.9500 | 0.09500 | 0.8057 | 4.8339 |
| 0.2 | 0.4115 | 0.8230 | 0.5581 | 6.6972 | 0.9020 | 0.1804 | 0.6561 | 7.8732 |
| 0.3 | 0.3237 | 0.9712 | 0.4179 | 7.5229 | 0.8564 | 0.2569 | 0.5429 | 9.7728 |
| 0.4 | 0.2813 | 1.1251 | 0.3313 | 7.9500 | 0.8131 | 0.3252 | 0.4565 | 10.9558 |
| 0.5 | 0.2590 | 1.2951 | 0.2755 | 8.2642 | 0.7722 | 0.3861 | 0.3894 | 11.6806 |
| 0.6 | 0.2465 | 1.4789 | 0.2371 | 8.5352 | 0.7337 | 0.4402 | 0.3363 | 12.1064 |
| 0.7 | 0.2390 | 1.6727 | 0.2090 | 8.7800 | 0.6975 | 0.4883 | 0.2936 | 12.3325 |
| 0.8 | 0.2342 | 1.8736 | 0.1876 | 9.0034 | 0.6637 | 0.5309 | 0.2588 | 12.4244 |
| 0.9 | 0.2310 | 2.0793 | 0.1705 | 9.2084 | 0.6320 | 0.5688 | 0.2301 | 12.4250 |
| 1.0 | 0.2288 | 2.2884 | 0.1566 | 9.3975 | 0.6024 | 0.6024 | 0.2061 | 12.3635 |
4. Concluding Remarks
This paper deals with the steady two-dimensional, incompressible, laminar flow, and mass transfer over a sensor surface, taking into account the effects of the slip condition and applied magnetic field. The governing equations are derived using the boundary layer approximation and reduced to local nonsimilar ones. Resulting equations are solved numerically. Dimensionless velocity and concentration profiles are shown graphically for various flow parameters.
It is found that velocity and concentration increase with increase of velocity power-law index m and dimensionless magnetic parameter M, whereas dimensionless analyte concentration decreases with an increase of reaction rate. Moreover, mass transfer boundary layer thickness decreases with increase of slip parameter α. The surface concentration of analytes θ(0) decreases along the streamwise direction. Finally, concentration gradient first increases until a certain streamwise location and then after this location, it decreases.


