Seasonally Perturbed Prey-Predator Ecological System with the Beddington-DeAngelis Functional Response
Abstract
On the basis of the theories and methods of ecology and ordinary differential equation, a seasonally perturbed prey-predator system with the Beddington-DeAngelis functional response is studied analytically and numerically. Mathematical theoretical works have been pursuing the investigation of uniformly persistent, which depicts the threshold expression of some critical parameters. Numerical analysis indicates that the seasonality has a strong effect on the dynamical complexity and species biomass using bifurcation diagrams and Poincaré sections. The results show that the seasonality in three different parameters can give rise to rich and complex dynamical behaviors. In addition, the largest Lyapunov exponents are computed. This computation further confirms the existence of chaotic behavior and the accuracy of numerical simulation. All these results are expected to be of use in the study of the dynamic complexity of ecosystems.
1. Introduction
Population communities are embedded in periodically varying environments. Therefore, it is appropriate to identify the functional role that seasons play in the behavior of population communities [1]. This seasonal variation can cause changes in the dynamics of an ecological system. The study of ecological systems which are subjected to seasonal perturbations is important for both theoretical and experimental ecologists. This study should also take into account the intrinsic nature of environmental and seasonal perturbations [2]. The basic problem is to understand the relationship between the magnitude of the seasonal variations and the complexity of the system. Numbers of studies have been performed on the interactions between the seasons and the internal biological rhythms of simple prey-predator ecosystems [3–6]. These studies have shown that these interactions can have spectacular consequences, such as multiplicity of attractors, catastrophes, and chaos [7].
In recent decades, it has been demonstrated that complex dynamics can appear in continuous-time models with three or more species [8–12], and specifically that nonlinear dynamics, including cycles, quasicycles, and chaos, can occur in such biological systems. In this context, continuous-time and discrete-time systems [13–21] have been discussed extensively by a number of researchers. The Beddington-DeAngelis functional response is introduced by Beddington [22] and DeAngelis et al. [23], independently. The main difference of this functional response from other functional responses is that it contains an extra term presenting mutual interference by predators [24]. Although a direct link between the predators and preys cannot be established unless quantitative methods are used, the precious works clearly show that the amount of three species are often related, and a change in one species can cause a change in the others, especially predator. Thus, we apply Beddington-DeAngelis functional response to describe their relationship with sufficient accuracy in this paper.
This paper considers a seasonally perturbed prey-predator system with the Beddington-DeAngelis functional response, which can be described by the following differential equations:
2. Mathematical Analysis
Definition 2.1. System (1.1) is said to be uniformly persistent if, for any positive solution (x(t), y(t), z(t)) of system (1.1), there exist positive constants mx, my, mz, Mx, My, Mz, and T > 0 such that mx ≤ x(t) ≤ Mx, my ≤ y(t) ≤ My, and mz ≤ z(t) ≤ Mz for t ≥ T.
Lemma 2.2 (see [26].)If a > 0, b > 0, (dh(t)/dt) ≤ (≥)h(t)(b − ah(t)), and h(0) > 0, then, for any small constant ε > 0, there exists a positive constant T such that h(t) ≤ (b/a) + ε(h(t) ≥ (b/a) − ε), for t ≥ T.
Lemma 2.3 (see [27].)If a > 0, b > 0, (dh(t)/dt) ≤ (≥)b − ah(t), and h(0) > 0, then h(t) ≤ (≥)(b/a) + (h(0) − (b/a))e−at for t ≥ 0.
Now we can obtain the threshold expression of some critical parameters under the condition of all species persistence.
Theorem 2.4. There exist positive constants Mx, My, and Mz for any positive solution (x(t), y(t), and z(t)) of system (1.1) with all sufficiently large t.
Proof. Assume that (x(t), y(t), z(t)) is an arbitrary positive solution of system (1.1), then the first equation of system (1.1) can yield
Defining that V(t) = x(t) + (y(t)/e1) + (z(t)/e2), then
Let 0 < L1 < min {m1(1 − ε2), m2(1 − ε3)}, then
Theorem 2.5. If W1 > 0, W2 > 0 and W3 > 0, then system (1.1) is uniformly persistent.
Proof. From Theorem 2.4, it is obvious that there exist positive constants Mx, My, Mz, and T3 = max {T1, T2} > 0 such that x(t) ≤ Mx, y(t) ≤ My, z(t) ≤ Mz for t ≥ T3.
On the other hand, we get from system (1.1) that
From the second equation of system (1.1), we can obtain that (dy(t)/dt) ≥ ((e1a1βmx/(b1 + k2 + c1My)) − m1(1 + ε2))y(t). It is obvious to know that if W2 = ((e1a1βmx/(b1 + k2 + c1My)) − m1(1 + ε2)) > 0, there are two positive T5 and my such that y(t) ≥ my for t ≥ T5.
From the third equation of system (1.1), we can obtain that (dz(t)/dt) ≥ ((e2a2mx/(b2 + k2 + c2Mz)) − m2(1 + ε3))z(t). It is obvious to know that if W3 = ((e2a2mx/(b2 + k2 + c2My)) − m2(1 + ε3)) > 0, there are two positive constants T6 and mz such that z(t) ≥ mz for t ≥ T6. Let T = max {T3, T4, T5, T6} then we have mx ≤ x(t) ≤ Mx, my ≤ y(t) ≤ My, and mz ≤ z(t) ≤ Mz for t ≥ T. This completes the proof.
By using the theoretical analysis, we obtain the threshold expression of some critical parameters under the condition of all species persistence, which in turn provides a theoretical basis for the numerical simulation.
3. Simulation Analysis and Results
To study complex dynamics of the prey-predator system with seasonality, the solution of the system (1.1) with initial conditions is obtained numerically for the biologically feasible range of parametric values. In order to investigate the interplay among seasonal perturbation and some critical parameters, the diagrams as a function of k2 and ω are obtained for three different cases: φ = 0, π/2, π. All other parameters are fixed as follows: a1 = 0.8, a2 = 0.6, b1 = 0.25, b2 = 2.5, e1 = 0.45, e2 = 0.35, c1 = 0.25, c2 = 0.55, m1 = 0.1, m2 = 0.15, r1 = 0.8, k1 = 30, β = 0.35, ε1 = 0.5, ε2 = 0.1, and ε3 = 0.5.
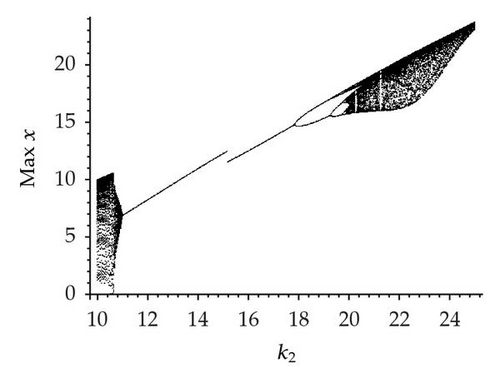
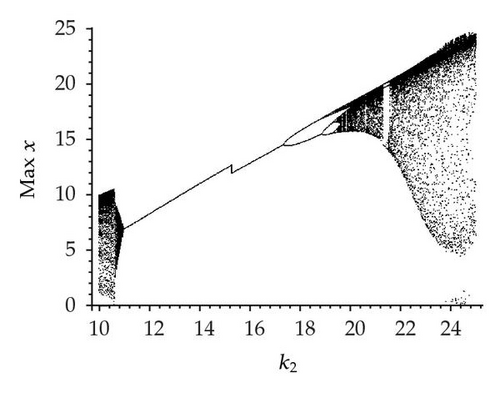
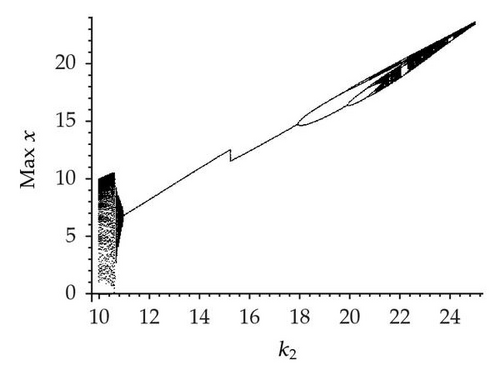
Let us investigate the critical parameter k2. Figure 1 shows the bifurcation diagram and the corresponding largest Lyapunov exponents as a function of k2 in the range 10 ≤ k2 ≤ 25 for φ = 0, π/2, π and ω = 0.3. It is evident from Figure 1 that the system produces complex dynamics for 10 ≤ k2 ≤ 25 when φ = 0, π/2 and π, such as chaotic band, period-doubling bifurcation, and chaotic band with wide or narrow periodic windows. Nonetheless, it is interesting to notice that the prey x biomass level increases with increase of k2, but it can be found that when φ = π/2, the prey x biomass level is relatively high. Comparison of Figures 1(a), 1(b), and 1(c) suggests that seasonality may still give a region of periodic solutions for k2. The evidence for the cascade of periodic doubling leading to chaos can be seen in Figure 1 for 11 ≤ k2 ≤ 20, 11 ≤ k2 ≤ 19.5, and 11 ≤ k2 ≤ 21.5. However, Figure 1(a) shows chaotic bands with a narrow periodic window, and Figures 1(b) and 1(c) show chaotic bands with wide or narrow periodic windows. It is obvious that the seasonal disturbance not only enhances the prey x biomass level, but also changes the complex dynamics when φ = π/2.
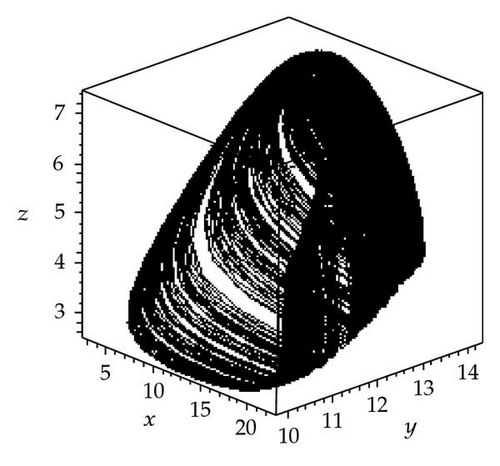
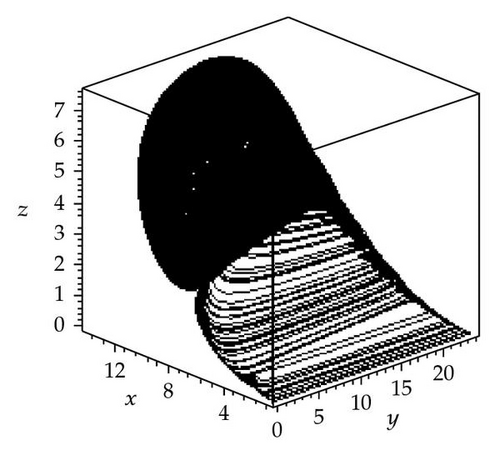
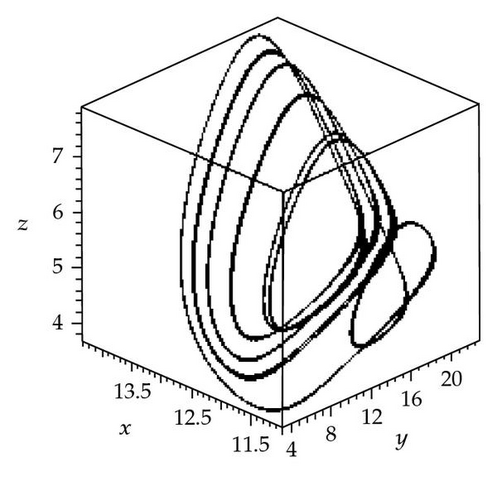
To investigate more carefully the effect of synchronous variation in the intrinsic growth rate and death rate, three strange attractors are plotted for k2 = 24 and three different values of the synchronous variation parameter: φ = 0, π/2, π. Figure 2 shows that when φ is 0 or (π/2), system (1.1) has a chaotic attractor at k2 = 24, but when φ = π, system (1.1) has a periodic attractor at k2 = 24. It can be observed from Figure 2 that seasonality in the intrinsic growth rate and death rate can change the chaotic behavior of the system at various values of the synchronous variation φ.
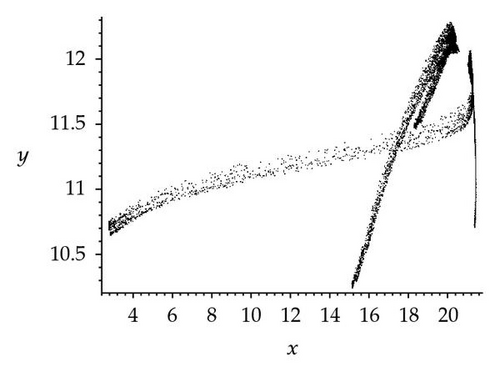
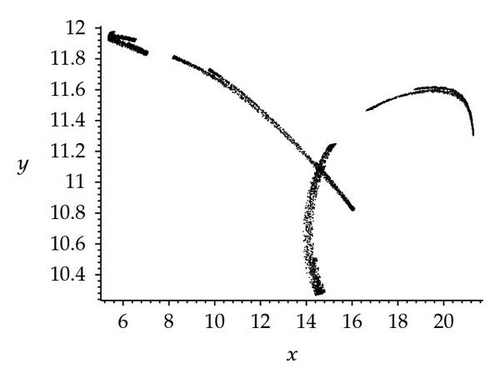
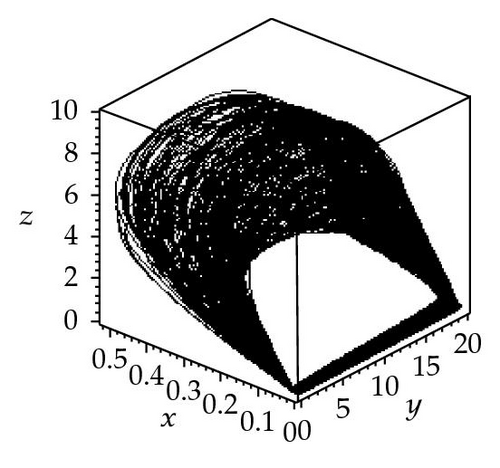
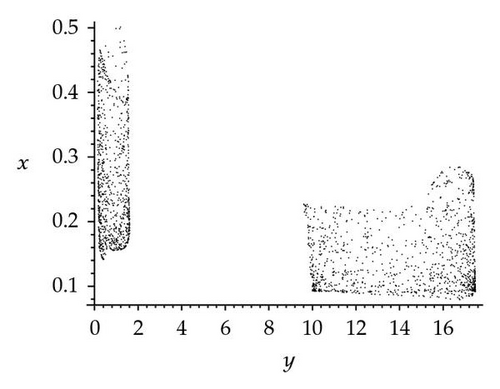
For further analysis of the effects of seasonality, three chaotic attractors as well as a Poincaré section (the Poincaré section is a classical technique for analyzing dynamic systems [27, 28]) have been obtained for k2 = 23 and three different values of synchronous variation: φ = 0, π/2, π. In this paper, the plane (z = 6) was chosen, and values of y were plotted against x. The resulting attractors and Poincaré section are shown in Figure 3. Figure 3(a) shows a chaotic attractor at φ = 0, and Figure 3(b) shows a Poincaré section for the chaotic attractor shown in (a). Three wide strips can be seen in Figure 3(b). Figure 3(c) shows a chaotic attractor at φ = π/2, and Figure 3(d) shows a Poincaré section for the chaotic attractor shown in (c). One wide strip can be seen in Figure 3(d). Figure 3(e) shows a chaotic attractor at φ = π, and Figure 3(f) shows a Poincaré section for the chaotic attractor shown in (e). Four wide strips can be seen in Figure 3(f). By comparison of the three Poincaré sections, it is apparent that the three chaotic attractors have different structures in the three different cases φ = 0, π/2, π. However, they might be better described as stranger chaotic attractors and fractals. These results show that seasonal perturbation can change chaotic attractor structure. In a word, seasonal perturbation is sufficient to change the chaotic attractor trajectory in system (1.1).
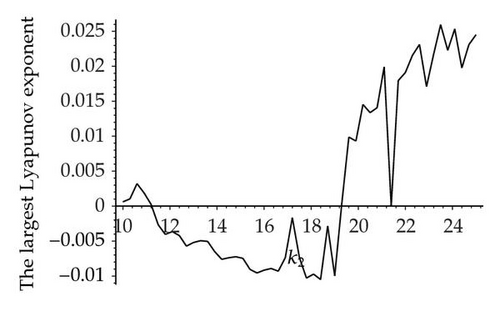
Moreover, convincing evidence for deterministic chaos has come from several recent experiments [29–34]. The results of chaos studies have confirmed the importance of detecting and exploring chaos. Here, the largest Lyapunov exponents are considered because they have proved to offer the most useful diagnostics for a chaotic system [35–40]. The Lyapunov exponents take into account the average exponential rates of divergence or convergence of nearby orbits in phase space [29]. For a chaotic attractor, the values of the largest Lyapunov exponent must be positive; if they are always negative, chaos cannot be observed, and a stable state or a period attractor will instead appear. In the bifurcation diagram for resource x shown in Figure 1(b), the corresponding largest Lyapunov exponent 10 ≤ k2 ≤ 25 can be calculated for the system described by (1.1), which is shown in Figure 1(d). It should be stressed that the result is consistent with Figure 1(b), which shows the accuracy and effectiveness of numerical simulation. Moreover, using the simulation of the largest Lyapunov exponents, the existence of chaotic behavior in system (1.1) can be further confirmed.
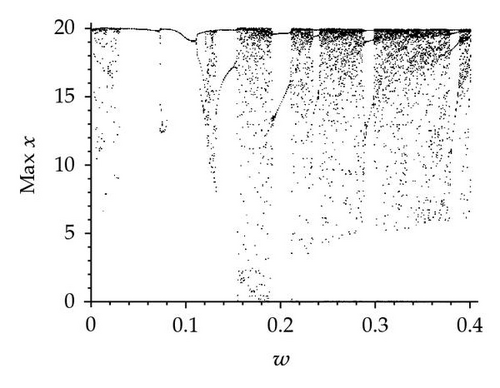
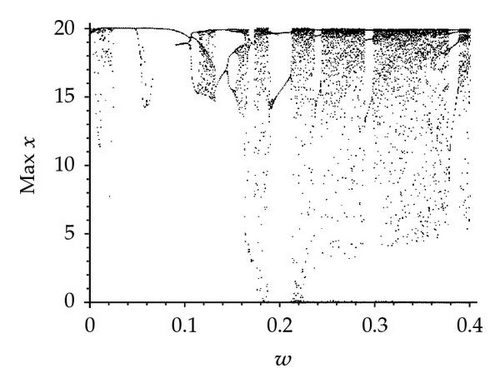
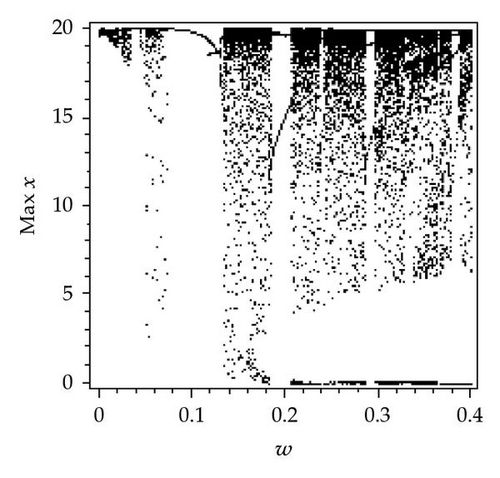
The other critical parameter to be investigated is ω. Figure 4 depicts the local long-term dynamics maxima for φ = 0, π/2, π and the range 0 ≤ ω ≤ 0.4 and k2 = 20. As ω increases from 0 to 0.14, Figure 4(a) shows that the system has rich dynamics, including periodic windows, period doubling, chaos, and a chaotic crisis. However, only chaos, chaotic crisis, and periodic windows are observed in Figures 4(b) and 4(c). Figure 4(b) shows that when ω is slightly increased beyond 0.14, the size of the chaotic attractor abruptly changes, constituting a type of attractor crisis. As ω continues to increase, a cascade of period-doubling bifurcation occurs, the period-2 attractor changes to a period-4 attractor, then a period-8 attractor and period-doubling bifurcation finally leads system (1.1) into chaos. However, only chaos and periodic windows are observed in Figures 4(a) and 4(c). In the range (0.18, 0.4), the solution is chaotic with intermittent periodic windows. Similar behavior is observed in Figures 4(a) and 4(c). Hence, it is obvious that the seasonality has a strong effect on the dynamical behaviors of system (1.1) with the synchronous variation φ varying.
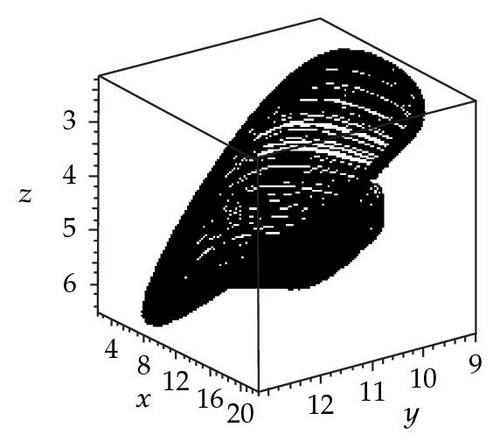
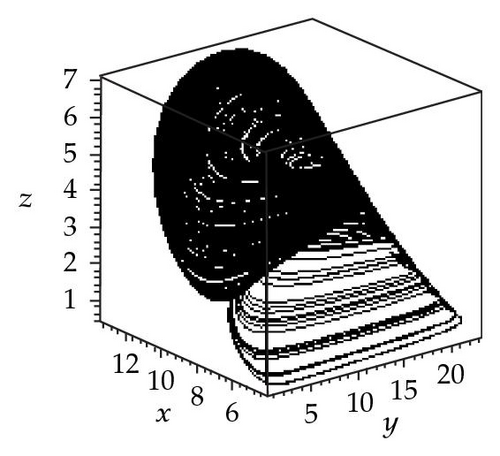
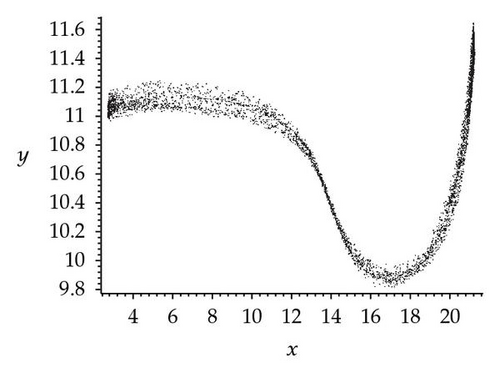
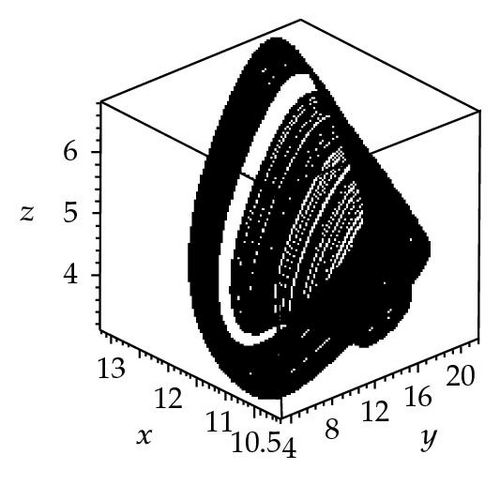
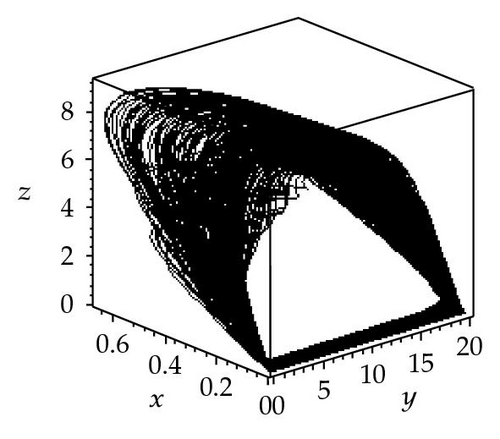
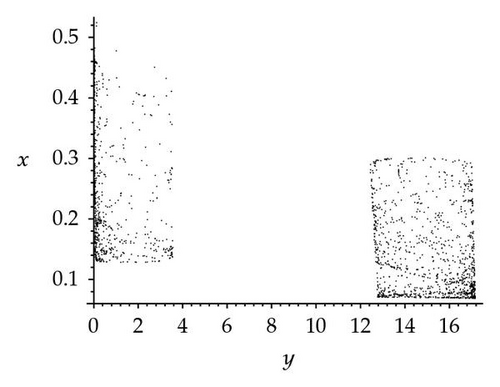
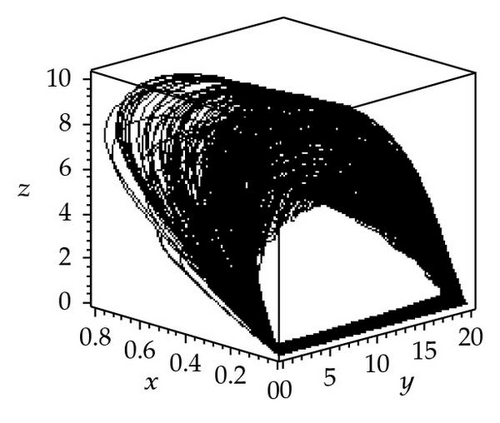
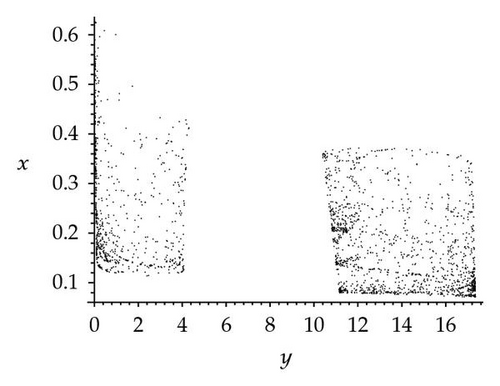
In order to study the effect of seasonality, three chaotic attractors as well as a Poincaré section have been obtained for ω = 0.26 and three different values of the synchronous variation parameter: φ = 0, π/2, π and the plane (z = 5). The attractors and Poincaré sections are shown in Figure 5. Figure 5(a) shows a chaotic attractor at φ = 0, and Figure 5(b) shows a Poincaré section for the chaotic attractor shown in (a). Two wide point regions can be seen in Figure 5(b). Figure 5(c) shows a chaotic attractor at φ = π/2, and Figure 5(d) shows a Poincaré section for the chaotic attractor shown in (c). Two point regions which are wider than in the Poincaré section shown in (b) can be seen in Figure 5(d). Figure 5(e) shows a chaotic attractor at φ = π, and Figure 5(f) shows a Poincaré section for the chaotic attractor shown in (e). Two point regions which are narrower than in the other two Poincaré sections can be seen in Figure 5(f). By comparison of the three Poincaré sections, it is apparent that the three chaotic attractors have different structures in the three different cases φ = 0, π/2, π. However, they are all fractals. These results show that the angular frequency of the fluctuations caused by seasonality can change chaotic attractor structure with the synchronous variation φ varying.
Based on the above analysis, it can be seen that the seasonal disturbance can enhance the prey x biomass level for φ = π/2, in which result is agreed with some results in reality. Further, it is also interesting to point out that the seasonality in three different parameters can come into rich and complex dynamical behaviors, but these dynamical behaviors are different. Moreover, the use of mathematical model with seasonality is considered to investigate some biological problems, and the numerical simulation provides an approximation of the real biological system behaviors; hence, these results can promote the study of ecological dynamics.
4. Conclusions and Remarks
In this paper, a prey-predator model with Beddington-DeAngelis functional response and seasonal perturbation has been studied analytically and numerically. Mathematical theoretical works have been pursuing the investigation of uniformly persistent, which depicts the threshold expression of some critical parameters and in turn provides a theoretical basis for the numerical simulation. Numerical analysis indicates that the seasonality has a strong effect on the dynamical complexity and species biomass using bifurcation diagrams and Poincaré sections. Bifurcation diagrams show that the seasonality in three different parameters can give rise to rich and complex dynamical behaviors, including periodic, period-doubling, period-halving, chaotic crises, and chaos. By comparing the Poincaré sections of various chaotic attractors, it can be determined that these chaotic attractors have different structures with the seasonality in three different parameters. Using numerical simulation of the largest Lyapunov exponents, the existence of chaotic behavior in system (1.1) and the accuracy and effectiveness of numerical simulation can be further confirmed. All these results are expected to be of use in the study of the dynamic complexity of ecosystems.
Acknowledgments
This work was supported by the National Natural Science Foundation of China (Grant no. 30970305 and Grant no. 31170338) and also by the Zhejiang Provincial Natural Science Foundation of China (Grant no. Y505365).


