
Polarization Holography in 3-Indoly-Benzylfulgimide/PMMA Film
Abstract
The photochromic and photoanisotropic properties of materials can be used in ordinary and polarization holographic recording respectively. Fulgides are well known as thermally irreversible organic photochromic compounds. And it is found that there exists photoinduced anisotropy in fulgide-doped polymeric films. In this report, a 3-indoly-benzylfulgimide/PMMA film was studied as a holographic storage media. First, the spectra and dynamics of photochromic and photoanisotropic properties of the sample are measured or calculated. Second, the diffraction efficiency (DE) dynamics at 633 nm of four kinds of different polarization holograms recorded in this sample are measured. The maximum DE value about 1% was gotten. Third, the DE spectra and DE dynamics are theoretically calculated in detail, and a good correlation of theoretically derived DE dynamic curves and the measured experimental curves was found. From the DE spectra, it is known that at the wavelengths less than 450 nm or greater than 700 nm, the nondestructive reading can be realized. The DWPS obtained in the experiments are same with the theortically deduced ones, which shows that in the orthogonal polarization holography, the polarization state of the diffracted light is orthogonal to that of the reconstruction light, which is very important to increase the SNR of the holographic storage. And all these results are applied and proved to be correct in high-density holographic image storage experiment. The area density of 2 × 108 bits/cm2 was obtained, and the encoded data was retrieved without error.
1. Introduction
Holographic optical storage becomes an important research aspect in optical storage field for its high data storage capacity and data transmission rate. Fulgides are well known as thermally irreversible organic photochromic compounds [1], which can be used as rewritable ordinary holographic recording material. But up to now, a few researches have been done on the holographic storage application of fulgide materials [2–9]. And we found that there exists photo-induced anisotropy in fulgide-doped polymeric films [10], which can be used in polarization holography application.
Here, the diffracted wave polarization states (DWPS) and the diffraction efficiencies (DE) of ordinary holograms and polarization holograms recorded in a 3-indoly-benzylfulgimide/PMMA film are studied in detail. First, the photochromic and photoanisotropic properties of the sample is given, and the DE dynamics at 633 nm of parallel linearly, parallel circularly, orthogonal linearly, and orthogonal circularly polarization holograms, each of which read by four kinds of different polarized lights, are measured. Second, the DE formula and DWPS of parallel linearly, parallel circularly, orthogonal linearly, and orthogonal circularly polarization holograms in photochromic and photoanisotropic thin films are theoretically deduced; Third, using the formula deduced before, from the properties of the sample, the DE spectra and dynamics at 633 nm of four kinds of different polarization recorded holograms are theoretically calculated and compared with the experimental curves, and the DWPS obtained in the experiments are compared with the theortically deduced ones. At last, all these results have been applied in high-density holographic image storage experiment.
2. Material and Measurement Experiments
2.1. Material
The fulgide material studied here is 3-indoly-benzylfulgimide, which was synthesized by the Stobbe condensation routine [11]. The target compound of 3 mg was dissolved in a 0.l mL 10% (by weight) PMMA-cyclohexanone solution. Then, the solution was coated on a 1-mm thick K9 glass plane with a spin coater and dried in air. The thickness of the film is about 10 μm. The photochromic or photoanisotropic properties of fulgides are due to a reversible photochromic (photoisomerization) reaction that occurs between one of the colorless E-form (bleached state) and the C-form (colored state). These are the two spectrally separated photochromic forms, whose molecular formulas are shown in Figure 1.

When the colored state is irradiated by a linearly polarized 650 nm laser, the film returns to the bleached state and photo-induced anisotropy is produced during this process. The mechanism of photo-induced anisotropy in the fulgide film is the following [10]: anisotropic absorbing molecules of fulgide are immobilized randomly in the PMMA polymeric matrix, which shows isotropic characteristic at the initial state; when the sample is irradiated by linearly polarized light photoselection of molecules take place. Molecules with long axes parallel to the exiting light polarization direction absorb the light strongly and turn to the other form very quickly, whereas those with long axes perpendicularly orientated to exiting light polarization have low absorption and stay at the initial form. As a result, special orientation of two form molecules is induced and the sample shows optical anisotropy properties macroscopically. The angular distributions of molecules in anisotropy inducing progress are shown in Figure 2. So, under the irradiation of circularly polarized light, the sample shows also optical isotropy.

2.1.1. Spectra of Photochromic and Photoanisotropy Properties of the Sample
The absorption of the C-form (AC(λ)) and E-form film (AE(λ)) were measured using a UV-VIS-IR spectrophotometer (UV-3101PC, Shimadzu Inc., Japan), which were shown in Figure 3(a). And the measurement of the photo-induced dichroism is performed by measuring the transmission spectra of the film for testing light polarized parallel (T//(λ)) and perpendicular (T⊥(λ)) to the polarization direction of the exciting beam after the C-form film is excited by the linearly polarized 650 nm laser (shown in Figure 4(a)).


2.1.2. Dynamics of Photochromic and Photoanisotropy Properties of the Sample
The transmission growing up kinetics of the sample at 633 nm were measured on the parallel and perpendicular directions to exciting beam polarization, when the C-form sample was being excited with 314 mW/cm2 and 157 mW/cm2 intensity linearly polarized 633 nm He-Ne lasers (IW), respectively, and an 1 mW/cm2 633 nm laser beam is used as the testing beam (IT), the optical setup and the results are shown in Figures 5 and 6(a). From Figure 6(a), it can be seen that the photochromic reaction of fulgide material is an optical cumulating progress, which just depending on the Exposure, so it is enough to consider just one exciting beam intensity condition for the analysis.


Based on (2)~(5), using numerical calculation method, the experimental curves were simulated (shown as the dash lines in Figure 6(b)), and the best fitting values γ// = 0.00289 cm2/mJ, γ⊥ = 0.0012 cm2/mJ were obtained. Because of the anisotropy of the molecules σC,E, the α and γ values of the sample are variable with the directions at same location, here just the total average values of that of all the molecules on two special directions are obtained, which are enough for calculation of the DE kinetics, and the detail process of it will not been analyzed here. In the numerical calculations, the intensity Gaussian beam distribution of the He-Ne laser beam also has been considered, which was divided as many homogenous intensity circles. Then we can calculate the photoanisotropic transmission curves of uniformity light, which is shown in the Figure 6(c).
2.2. Experiment Measurement of Polarization Hologram Diffraction Kinetics
2.2.1. Measurement Setup
The system configuration for measuring the real-time hologram first-order diffraction kinetics of the Fulgide film is schematically illustrated in Figure 7. A He-Ne laser (Melles Griot Inc., USA, 25-LHP-928, 632.8 nm, 35 mW, vertical linear polarized) is used to generate recording beams (object beam IO and reference beam IR) and readout beam (reconstruction beam IC), and a laser of diode LD (Power Technology Inc., USA, IQ2A18, 405 nm, 10 mW, vertical linear polarized) is used as the erasing light (IE) source. The He-Ne laser beam splitted into the IO, IR, and IC after beam splitter BS1 and polarization beam splitter PBS, in which IR and IC are phase conjugated (counterpropagated) beams. The diffracted light ID of IC, diffracted by the dynamic holographic grating established by the interference between the IO and IR, will be phase conjugated with the IO, whose power was real time detected by a digital power meter “D” (United Detector Technology company, USA, 11A Photometer/Radiometer, 254~1100 nm Imax = 10 mW, resolution is 0.01 nW) and a digital oscilloscope “O’’ (Tektronix company, USA, TDS3032, 300 MHz, 2.5 GS/s, 1 mV) after reflected by the BS2 (R47%). The IO and IR are symmetrically incident on the sample (Fulgide film), whose intersection angle 2θ = 16.5°, so the recorded grating is a nonincline grating. Shutter S1 and S2 controls the exposure time of red and purple beams. The continuously adjustable attenuators A1~A3 are used to adjust the intensities of the waves, in this experiment IO = IR = 78.6 mW/cm2 and IC = 0.786 mW/cm2 (i.e., IO : IR : IC = 100 : 100 : 1). This insures that the subreflection gratings formed by IO and IC as well as IR and IC can be ignored. The quarter-wave plates Q1~Q4 and the polarizer P are used to change the polarization states of the waves; here four different polarization recording: parallel linearly polarization recording, parallel circularly polarization recording, orthogonal linearly polarization recording, and orthogonal circularly polarization recording were studied, every one was constructed by horizontal, vertical, left circular, and right circular polarized four kinds of lights like shown in Table 1.
| Polarisation of object light | Polarisation of reference light | Polarisation of reconstruction light | Polarization states of diffracted lights | +1-order diffraction efficiencies | ||
|---|---|---|---|---|---|---|
| +1 | −1 | Amplitude hologram ηA,+1 | Phase hologram ηP,+1 | |||
 |
 |
 |
 |
 |
||
 |
 |
 |
 |
 |
||
 |
 |
 |
 |
 |
||
 |
 |
 |
 |
 |
||
| 0 | 0 | |||||

2.2.2. Measurement Results
In four kinds of polarization recording, and different polarization reading, the diffracted wave polarization states (DWPS) obtained in the experiments are shown in Table 1 and the measured kinetic first-order diffraction efficiency (DE) curves η+1 ~ t are shown in Figure 8. From them, the curves of the conditions when IC has same polarization state with IR were compared in Figure 9(a). The theoretical analysis of the results will be given in Section 3. It can be seen that there exists an optimal exposure about 2 × 78.6 mW/cm2 × 3.75 s ≈ 590 mJ/cm2.


3. Theoretical Analysis
3.1. Background
For isotropy recording materials, only when the object light and reference light have components with same polarization state, there the intensity grating exists and the holograms can be recorded, called ordinary holograph. But for photo-anisotropy materials, even if the and have orthogonal polarization states, the holograms also can be recorded, because that at this time although the intensity of the superposed light is a constant, but its polarization state changes with the phase difference between and . Photo-anisotropy materials can record the polarization state of exciting beam, so the holographic gratings can be recorded, called polarization holography, in which not only the intensity and phase signals of can be stored (the photo-anisotropy is depending on the exposure), but also its polarization state can be stored.
The holographic recording progress is a reaction progress between the exciting interference light and the material. So, first the properties of the exciting interference light will be analyzed and then the reaction of the sample with the light will be studied.
3.1.1. The Properties of Exiting Interference Pattern of Object Light and Reference Light


(A) Parallel Polarization State It is known that in the interference field of two coherent waves and with the same polarization, the polarization state is constant and same with before , but the intensity is periodically modulated corresponding to Δφ as I1 = O2 + R2 + 2 · O · R · cos Δφ. At the condition that the amplitudes of and are same, that is, O = R = A, the interference field distribution of two special examples of it are drawn in Figures 11(a) and 11(c), including the parallel linearly polarization and parallel circularly polarization.


(B) Orthogonal Polarization State In the interference field of two coherent waves with orthogonal polarization, that is, , the intensity is constant I2 = O2 + R2, but the polarization state is periodically modulated; here two special examples of which are analyzed, including the orthogonal linearly polarization and orthogonal circularly polarization.
(B1) Orthogonal Linearly Polarization Suppose and are, respectively, horizontal and vertical linearly polarized, so:
(B2) Orthogonal Circularly Polarization Suppose and are, respectively, right and left circularly polarized, so:
3.1.2. Analysis of the Properties of Different Kinds of Polarization Holograms and Their DWPS and DE
Under the irradiation of the interference field, the photochromic reaction will be induced in the fulgide sample, so the space modulation of the distribution of E-form and C-form molecules will be caused by the intensity modulation of optical field; photo-anisotropy will be induced during the photochromic reaction under the irradiation of noncircularly polarized light, so the space modulation of the orientations (tropism) of E-form and C-form molecules will be caused by the polarization state modulation of optical field.
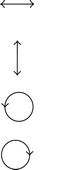
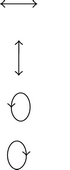
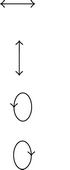
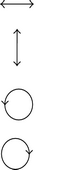
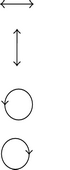
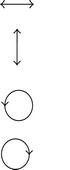
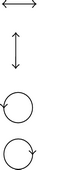
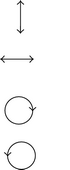
Here, we just consider four kinds of polarization holographic storage, including the parallel linearly, parallel circularly, orthogonal linearly, and orthogonal circularly polarized holograms. Figure 11 is a single sketch map showing the space modulation of the distributions and orientations (optical axis) of E-form and C-form molecules in these four kinds of polarization holographic storage under the linearity recording condition when O = R = A. The arrows and ellipses on the horizontal line indicate the periodical distributions of intensity magnitudes and polarization states of the recording field corresponding to the different phase differences Δφ along the x-axis. The rectangle frames under them indicate the distribution and orientation of the molecules under the corresponding light irradiations, where the black and white colors indicate the C-form and E-form molecules, respectively, the arrows indicate the direction of induced optical axes, and the star flower (*) means the sample is isotropy at the place.
From Figure 11, it can be seen that in the parallel circularly polarized hologram just ordinary hologram exits, and in the orthogonal polarized condition, just polarization hologram exits, but in the parallel linearly polarized holography, the ordinary hologram and polarization hologram will be recorded together.
The underside, the Jones matrixes of four kinds of polarization hologram, and their DWPS and DE are analyzed under linearly recording condition. The DE are calculated using the diffraction theory of two-dimensional grating, because the thickness of the fulgide film is very small (10 μm); the recorded hologram can be considered as plane hologram.
For simplify, the condition when O = R = 1 is chosen and analysed here. And the 45° contrarotated coordinate system is defined as (X,Y), shown in Figure 12(a). In Figure 12(b), the photoanisotropic amplitude transmission curves are shown. The (τe − τo) indicate the photo-induced anisotropy of the sample under the irradiation of linearly polarized light at some exposure, (ne − no) indicate the corresponding birefringence, τM = (τe + τo)/2 indicate the amplitude transmission of the sample for nonpolarized light or circularly polarized light at this time (at the area of light strips in the interference field), τm indicates the amplitude transmission of the sample before the illumination of light (at the area of dark strips in the interference field, isotropy), τE and τC indicate the amplitude transmission of the E-form and C-form sample, respectively, nM, nm, nE, and nC indicate the corresponding refractive index of the sample, Ψi = k0 · ni · d (i = e, o, M, m, E, C), and it is defined that τ0ij = (τi + τj)/2, τ1ij = (τi − τj)/2, Ψ0ij = (Ψi + Ψj)/2, Ψ1ij = (Ψi − Ψj)/2(i, j = e, o, M, m, E, C). In the Figure 12(b), the linearity recording area is given, that is, the linearity recording area of the increasing curve of τe, where it is insured that the light amplitude transmission changing of the sample has the direct ratio with the exposure no matter using what kind of polarization holographic recording and reading.


(1) Parallel Linearly Polarization Recording From Figure 11, it can be seen that the photo-induced optical axis is along the y-axis, so
If (vertical linearly polarized) itself is used as , the and the DWPS are the same as (shown in Table 1). If a horizontal polarized light is used as , the and the DWPS are the same as (shown in Table 1). But at other stations the diffracted lights are the superposed light of the diffracted lights of vertical and horizontal polarized light components of ; when reconstruct with circularly polarized light, the diffracted light will be ellipse polarized, whose long axes are along the vertical direction, and DE is the average value of that of horizontal and vertical polarized lights. For the phase recording material, τx = τy = τ0, using the same method the DWPS and DE of it can be deduced, in which four typical ones are written in Table 1.
At the nonlinearly recording condition, the grating of the amplitude and refractive index will no longer be a single sine function distributing, but will be a superposition of a lot of different sine function distribution
(2) Parallel Circularly Polarization Recording From Figure 11, it can be seen that the sample is isotropy at this condition, so
Under the linearity recording condition,
(3) Orthogonal Linearly Polarization Recording For the orthogonal linearly polarization hologram, the superposed light is elliptically polarized light, whose long axes have α = ±π/4 angle between the x-axis, that is, along the X, Y axes. So first the Jones vector of the interference field Equation (7) is turned into X, Y coordinate
The optical anisotropy induced by elliptically polarized light should have direct ratio with the intensity difference between X, Y two directions I3X − I3Y = 2A2cos Δφ. So, the amplitude transmission Jones matrix of the holograph can be written as
And then the Jones matrix of the holograph is turned into usually used x, y coordinate:
At the nonlinearly recording condition, (τe − τo) and (ne − no) will not have direct ration with the exposure, but the anisotropy distribution will not change, so the diffraction efficiency equations at the linearly recording condition also can be used.
(4) Orthogonal Circularly Polarization Recording From Section 3.1.1, it can be seen that the superposed light field of two orthogonal circularly polarized lights (the same intensity) is a linearly polarized light, and the intensity will not change with Δφ, so every where in the sample its amplitude transmission matrix in the coordinate of the its main axes should be
The optical axis of the superposed light is changing with Δφ, which has Δφ/2 angle with the X-axis to counter-clockwise direction, so the angle with the x-axis is α = Δφ/2 + π/4. So, the Jones matrix of the recording material in the x, y coordinate will be
3.1.3. DWPS and DE Formulas of Different Kinds of Hologram
In Table 1, the DWPS and DE of parallel linearly, parallel circularly, orthogonal linearly and orthogonal circularly polarization holographs at the linearly, recording condition are summarized, when reconstructed with linearly polarized lights and circularly polarized lights. Usually the holograms are mixed hologram, whose DE approximately equals to the summation of that of the amplitude grating and phase grating: η1 = ηa1 + ηp1.
It can be seen that the DWPS obtained in the experiments are the same as the theortically deduced ones. And in the orthogonal polarization holography, if reconstructed with the reference light, the polarization state of the diffracted light is orthogonal to that of the reconstruction light, which is very important to increase the SNR of the holographic storage. Because that the polarization state of the scattered noise light is almost the same as that of the reconstruction light, which can be filtered by using the polarizer and quarter-wave plate.
3.2. Theoretical Calculations of DE of Fulgide Film
In this section, the DE spectra and DE dynamic curves at 633 nm of different kinds of holograms recorded in the sample will be calculated from the properties of the sample written in Section 2, by using the theory written in Section 3.1. In Section 2, it is given that for fulgide materials the photochromic and photo-induced anisotropy phenomenon are optical accumulating progresses, so the holographic recording progress is also an accumulating progress, which just depending on the exposure (average exposure ), so it is enough to consider just one exciting beam intensity condition. For the simplicity, the object refractive ratio (ORR) is chosen as 1 : 1, that is, .
3.2.1. Theoretical Calculation of DE(633 nm) ~ Curves on the Exposure of Uniformity Beams
(1) The Calculation of DE in the Parallel Polarization Recording Condition For parallel polarization recording condition, the optical intensity distribution should be
(a) The Calculation of DE of the Amplitude Gratings (ηA) The amplitude transmission changing curves on the phase difference τ ~ Δφ at t will be
(b) The Calculation of DE of the Phase Gratings (ηP) From the T(t) ~ Δφ, the A(t) ~ Δφ curves can be calculated
(c) The Calculation of DE of the Mixed Gratings (ηtotal) The ηtotal can be calculated by submitting the ηA and ηP: η+1 = ηA,+1 + ηP,+1.
(d) The Calculation Results of DE of Fulgide Film in Parallel Polarization Recording For example, in the parallel linearly polarization recording parallel polarization reading condition (), when I0 = 50 mW/cm2, from the T// ~ E curve shown in Figure 6(c), the T//(t) ~ Δφ of the holographic grating at different recording times t can be calculated, from which the τ//(t) ~ Δφ can be obtained, which is shown in Figure 13.
Every τ//~Δφ curve was spread into Thaler progression, that is was simulated with (30), then the τn (n = 0,1, …, 10) on the direction of the exiting beam polarization at different t were obtained; for example, in the Figure 14 two typical amplitude transmission grating curves (sine distribution and negative triangle wave function) at different t and their simulated curves are given. So, the (n = 0,1, …, 10) curves can be got, from which the curves can be calculated, from which the first-order DE (ηA,±1) is chosen and shown in Figure 15 as dash line 2. It can be seen that even if the ORR = 1 : 1, because the nonlinear recording the DE will also drop down. The optimal exposure is about 1 J/cm2, and at the uniformity light recording condition, the maximum ηA,±1 is 2%. From the T//(t) ~ Δφ curves, the A//(t) ~ Δφ curves can be calculated. After every A//(t) ~ Δφ curve is spread into Thaler progression, the Ai (i = 0,1, …, 10) on the direction of the exiting beam polarization at different t can be obtained. In Section 2, it is given that Δn(633 nm)/ΔA(633 nm) = 0.00994. So after the Ai multiplexed with 0.00994, the ni,// (i = 0,1, …, 10) at different t can be got, from which the can be calculated, which is shown in Figure 16. The DE of the mixed holograph ηtotal can be obtained by submitting that of the amplitude grating and phase grating, shown in Figure 16. It can be seen that at the uniformity light recording condition, the optimal exposure is about 1 J/cm2, and, the maximum η±1 is about 3.56%.It can be seen that ηA,±1 and ηP,±1 nearly has direct ratio in parallel linearly recording hologrpahy, the decreasing rate of ηP,±1 is a little bit slower than that of ηA,±1, which is ignored in other conditions in parallel polarization recording, and just the ηA,±1 is calculated as before and ηtotal is took as 1.89 times of the ηA,±1.
Using the same method shown before, from T⊥ ~E curve shown in Figure 6(c), the curves for the , which has perpendicular polarization to that of the exciting beams (), are calculated, from which the ηA,±1 is shown in Figure 15. Comparing with the condition of , just the changing rate is slow down. When reconstruct with circularly polarized light, the diffracted lights are the superposed light of the diffracted lights of vertical and horizontal polarized light component of the , so it will be ellipse polarized lights, whose long axes are along the vertical direction and the DE are the average values of that of the vertical and horizontal polarized lights, which is shown in Figure 15.
In the parallel circularly polarization holograph (ORR = 1 : 1), the T distribution is the same for any kinds of polarization state lights, so the DE are also the same. Using the same method shown before, from the T(t) ~ Δφ curves of parallel circularly recording condition shown in (28), the curves of parallel circularly recording holograms are calculated and shown in Figure 15.


(2) The Calculation of DE in the Orthogonal Polarization Recording Condition From Section 3.1, it is known that in orthogonal polarization recording condition at nonlinear recording area, the DE equations of the linearly recording area shown in Table 1 also can be used. From Figure 6(c), the τe ~ E and τo ~ E curves of sample under uniformity light irradiation can be calculated. Then from them using the DE formulas, the curves of the orthogonal linearly polarization holography and orthogonal circularly polarization holography can be calculated, which are shown in Figure 17.
It can be seen that the optimal exposure is 1.2 J/cm2, and the maximum amplitude grating DE are, respectively, 0.4% and 1.6%. The decreasing rates are quicker than parallel polarization holography. In Section 2, it is given that in this sample ΔnB(633 nm)/ΔAD(633 nm) = 0.006115. The ηP,+1, the same as the condition in parallel polarization holography, nearly has direct ratio with the ηA,+1, the ηtatol in mixing holograph is about 1.28 times of ηA,+1.

3.2.2. The Calculation of DE ~ Curves on the Exposure of the Gaussian Beams
Because in experiment, the writing and reading beams are 633 nm He-Ne Gaussian beams, so this condition was considered in the calculation below. The light pattern is divided into many intensity homogenous circles, whose intensities and areas are Ii (i = 1 ⋯ n) and Si (i = 1 ⋯ n), respectively. Using Ii (i = 1 ⋯ n), from the curves calculated in Section 3.2.1, the DE of every circle at different time ηi,t (i = 1 ⋯ n) can be calculated. When read by the original , the diffracted light power PD,t can be got by submitting that of all the circles PD,i,t = ηi,t · Ii · Si, and then by dividing by the power of (PC), the total DE of the sample for the Gaussian reading beam ηtotal,Gaussian,t = PD,t/PC can be obtained. The calculated DE ~ t curves of different kinds of polarization haplographies recorded in this sample, when the writing beams are 633 nm He-Ne Gaussian beams, whose average intensities are 78.6 mW/cm2 (same with the experiment values) and the original is used as , are shown in Figure 9(b).
It can be seen that the maximum values’ ratio of the measured values is basically coincide with the theoretically analyzed one. Only for parallel linearly polarization hologram, in the orthogonal linearly polarization reconstruction condition (), the diffraction efficiency is lower than parallel linearly polarization reconstruction condition (). It is because that, in calculation the affection of is not considered, which can be proved to be very small when the IC = IO/100 = IR/100 comparing to the affection of nonlinear absorption of the film, whose detail calculation progress will not be given here, where it also can be deduced that the reading beam affection is larger in condition than in condition.
And the theoretical results are larger than the experimental results, and the reaction is quicker (optimal exposures are about 590 mJ/cm2 and 430 mJ/cm2, respectively, in experimental results and theoretical results); this may be caused by: (1) the sample is not homogeneous, the density is different at different area, (2) the incidence angles of beams θ in the experiment are about 8.2°, so the intensities of them on the sample plane will be cos θ ≈ 0.9898 times of the values used in calculation, (3) the photoreaction rate constants used in calculation is a little bit larger than real ones.
And it can be seen that no matter during the ordinary holograph recording process in photochromic media, or during the polarization holograph recording process in photo-induced anisotropy media, there exits an overshooting peak in the diffraction efficiency, which then decays to a lower permanent level or also to zero. From the theoretical analyses, it can be deduced that it is caused by the diminishing of fringe contrast mainly caused by the nonlinear saturation effects of photoisomerization process and photo-induced anisotropy process. In experiment, there also exit the diminishing of fringe contrast caused by a photochemically active readout beam and unequal intensities of object and reference waves. It can be theoretically calculated that the effects of them show very smaller than that of the nonlinear saturation effects, which will not be given here.
3.2.3. The DE Spectra of Different Kinds of Holography in Fulgide Film
Suppose that the holographic recording is a linearity recording, from the spectra of ΔA, Δn, ΔAD, and ΔnB, shown in Figures 3(b) and 4(b), using the DE formulas of different kinds of polarization holographies, shown in Table 1, the DE spectra of the ordinary holograms (i.e., parallel circularly polarization recording) and polarization holograms (orthogonal linearly and orthogonal circularly polarization recording) can be calculated, which are shown in Figure 18, where the solid line, dot dash lines and dash lines indicate the ηtotal, ηA, and ηP, respectively. It can be seen that at 450 nm and 700 nm the diffraction efficiencies are higher, while the absorption is very small, where the recorded information can be read out without any photochromic reaction, that is, the nondestructive reconstruction can be realized.


4. Application in Holographic Image Storage
4.1. Holographic Image Storage Setup
The property difference of different polarization holograms have be seen in real image holographic storage, whose optical set up is shown in Figure 19. The same as the measurement set up, the 633 nm He-Ne laser (3 mW, random polarized) and 405 nm diode laser are used as recording and erasing light sources, respectively; shutter S1 and S2 used to control their exposure times; quarter-wave plates Q1~Q3 and attenuators A1~A2 are used to change the polarization states and intensities of the recording (object light O and reference light R), reading (C) and diffracted (D) waves. We know that in the orthogonal polarization holography, when C-beam has the same polarization state with R-beam, the D-beam has orthogonal polarization with C-beam, while the scattering noise has similar polarization with C-beam. So using the Q3 and polarizer P in front of L3, the scattering noise can be filtered in orthogonal polarization holography. Located on the front focus plane of Fourier transformation lens L3, spatial light modulator (SLM) loads the encoded data image from computer PC1. And the diaphragm D1, located on the special frequency spectrum plane of 4 f system composed of L3 and L4, is used to filter high-order diffractive waves of grating structure of SLM, so on the back focus plane of L4 the object image (OI) without grating structure can be obtained. In the R-beam path, lens L6 and L7 comprise another 4 f system, and rotatable mirror M2 and the sample, located separately on the focus planes of L6 and L7, are used to realize angle multiplexing. L5 and L8 compose another 4 f system, L5 performs the Fourier transformation of the object image (OI) at the position of the Fulgide film (sample), and Lens L8 performs the inverse Fourier transform at the plane of the CCD camera to yield the diffracted image. Four different polarization recordings like listed in Table 1 are stored with this set up.

4.2. Holographic Image Storage Results
Figure 20 shows the comparison of retrieval diffractive images with different polarization recording waves on the fulgide film, when reconstruction beams have same polarization state with reference beams. It can be seen that these results are same with the measured results shown above. When the intensities of recording wave and readout wave are certain, parallel linear polarization recording obtains the highest diffraction efficiency as well as high scattering noise; parallel circular polarization recording obtains high diffraction efficiency and scattering noise; orthogonal linear polarization recording obtains low scattering noise and diffraction efficiency; orthogonal circular polarization recording obtains higher diffraction efficiency and high signal-to-noise ratio. So, orthogonal circular polarization recording is chosen as the method of polarization holographic data storage on the fulgide film and Fourier transformation holographic method is chosen to get high storage density.


Figure 21 shows the experimental results of orthogonal circular polarization holographic optical data storage on Fulgide film by Fourier transformation holographic method. The images are separately stored file, encoded binary monochromic image, retrieval diffractive image, decoded result, retrieved file, and measurement of size of holographic image. The retrieval diffractive image that is clear is processed by decoding procedure, and the obtained retrieved file is the same as the stored file. In the experiment, data size of each stored holography is 81×61 bits, and the size of holography is 60 μm×42 μm. So the storage area density of 2 × 108 bits/cm2 is obtained. The nonhomogeneity and flaws of the surface of sample, uncoaxiality of optical elements and uncertainty of adjustment brings out some distortion of the diffractive image and error codes that can be reduced to the minimum by designing reasonable encoding and decoding procedures.


5. Conclusions
From the analysis of diffracted wave polarization states in the different kinds of polarization holograms, it can be seen that in the orthogonal polarization holography, if reconstructed with the reference light, the polarization state of the diffracted light is orthogonal to that of the reconstruction light, which is very important to increase the SNR of the holographic storage.
From the dynamic curve calculation of the film, it can be seen that, the decrease of the diffraction efficiencies at the high exposure is caused by the nonlinear recording of the sample, and the effect of the reading beam is very small. The maximum values of the diffraction efficiencies at 633 nm of the parallel linearly, parallel circularly, orthogonal linearly, and orthogonal circularly polarized holograms recorded in 3-indoly-benzylfulgimide/PMMA film are 3.56%, 3.026%, 0.49%, and 1.96%, respectively. In the condition of the Gaussian beam, the experimentally measured values are smaller than the theoretical calculated ones, but the ratio between the diffraction efficiencies of different kinds of polarization holographs is nearly the same as the calculated ones. The maximum measured diffraction efficiency of the parallel linearly polarization hologram is 1%.
From the diffraction efficiency spectrum, it can be seen that at the wavelengths less than 450 nm or greater than 700 nm the nondestructive reading can be realized.
The results obtained in holographic image storage proved that the results obtained in calculation and measurement experiment are correct. In Fourier transformation orthogonal circular polarization recording, high SNR and high density of 2 × 108 bits/cm2 are obtained.
Acknowledgments
This research is supported by the Natural Science Foundations of China, under Grant no. 60867001, College Science Foundations of Inner Mongolia, China, under Grant no. NJZZ07007, and the Open Foundations of Key Laboratory of Photochemical Conversion and Optoelectronic Materials, TIPC, CAS, China.