Nona-Arginine Facilitates Delivery of Quantum Dots into Cells via Multiple Pathways
Abstract
Semiconductor quantum dots (QDs) have recently been used to deliver and monitor biomolecules, such as drugs and proteins. However, QDs alone have a low efficiency of transport across the plasma membrane. In order to increase the efficiency, we used synthetic nona-arginine (SR9), a cell-penetrating peptide, to facilitate uptake. We found that SR9 increased the cellular uptake of QDs in a noncovalent binding manner between QDs and SR9. Further, we investigated mechanisms of QD/SR9 cellular internalization. Low temperature and metabolic inhibitors markedly inhibited the uptake of QD/SR9, indicating that internalization is an energy-dependent process. Results from both the pathway inhibitors and the RNA interference (RNAi) technique suggest that cellular uptake of QD/SR9 is predominantly a lipid raft-dependent process mediated by macropinocytosis. However, involvement of clathrin and caveolin-1 proteins in transducing QD/SR9 across the membrane cannot be completely ruled out.
1. Introduction
Fluorescent semiconductor quantum dots (QDs) have been used to deliver and monitor biomolecules into cells in the past few years [1–3]. Advantages of QDs over traditional dyes and proteins (e.g., green and red fluorescent proteins) include their unique physical and chemical properties, namely, photostability, high quantum yield, narrow emission peak, exceptional resistance to degradation, broad size-dependent photoluminescence, and multiplexing potential [4]. Although QDs can be engulfed by living cells, the use of cell-penetrating peptides can increase uptake efficiency [5].
The study of the uptake mechanism of QDs is just beginning. Using specific inhibitors, Ruan et al. identified macropinocytosis, actin filaments, and microtubules as required for internalization and intracellular transport of streptavidin-coated QD/Tat-biotin in HeLa cells [6]. Zhang and Monteiro-Riviere demonstrated that carboxylic QDs were internalized by lipid raft-dependent endocytosis in human epidermal keratinocytes, and these pathways were primarily regulated by the G-protein-coupled receptor associated pathway and low-density lipoprotein receptor/scavenger receptor [7].
Cell-penetrating peptides (CPPs), also known as protein transduction domains (PTDs) or membrane transduction peptides (MTPs), have been used to transduce biologically active proteins, siRNA, and drugs across plasma membranes [8, 9]. The advantages of CPPs include ease of preparation, lack of toxicity to the cell, and high efficiency of transduction [10]. CPPs can enter cells with a half-time of 1.8 minutes, corresponding to a first-order rate constant k of 0.007 sec−1 [11]. Among the basic CPPs, the cellular uptake of polyarginine tends to be more efficient than that of polylysine, polyhistidine, or polyornithine [12]. The highest translocation efficiencies were achieved by using octa-arginine or nona-arginine peptides [12]. The synthetic nona-arginine (SR9) peptide has been shown to effectively deliver not only covalently fused proteins but also noncovalently bound protein into different types of animal and plant cells [9, 13].
The mechanism of cellular entry of CPPs has been the focus of numerous studies. Early reports suggested that CPPs delivery of molecules into cells was independent of endocytosis, energy, receptors, or active transporters [14–16]. However, it was later found that fixing cells may have artificially transduced molecules across plasma membranes [17]. More recent studies using live cell imaging suggested the involvement of macropinocytosis [18, 19].
The goals of this study were to determine (1) whether SR9 can noncovalently facilitate QD uptake and (2) the internalization mechanisms for uptake of QD/SR9 complex. We treated A549 cells with QDs alone or QD/SR9 complex to determine the efficiency of QD/SR9 uptake. Inhibitors and siRNA were used to identify molecules and processes that contribute to the uptake.
2. Materials and Methods
2.1. Quantum Dots
CdSe/ZnS quantum dots (Adirondack Green, 520 nm) were purchased from Evident Technologies (Troy, NK, USA). These quantum dots have a polyethylene glycol (PEG) lipid surface coated with carboxyl terminal groups. The emission and excitation peak wavelengths are 520 nm and 505 nm, respectively. The hydrodynamic diameter is 25 nm.
2.2. Nona-Arginines (SR9)
Nona-arginines were synthesized by solid-phase peptide synthesis (Sigma-Aldrich, Saint Louis, MO, USA). The synthetic peptides were purified by high performance liquid chromatography (HPLC) using a reverse phase column. The purity of SR9 was ~99%.
2.3. Chemicals
Fetal bovine serum, Ham’s F-12 medium with L-glutamine, trypsin-EDTA (1x), penicillin-streptomycin, sucrose, sodium azide, sodium fluoride, and chlorpromazine were purchased from Fisher Scientific (Pittsburgh, PA, USA). Nystatin, filipin, 5-(N-ethyl-N-isopropyl) amiloride (EIPA), cytochalasin D (Cyt D), antimycin A, and monodansylcadaverine (MDC) were purchased from Sigma-Aldrich.
2.4. Cell Culture
The human bronchoalveolar carcinoma-derived cell line (A549) was purchased from ATCC (Manassas, VA, USA). Cells were maintained in Ham’s F-12 medium supplemented with 10% fetal bovine serum, 100 units/mL penicillin, and 100 μg/mL streptomycin and grown at 37°C in a 5% CO2 humidified environment. A549 cells were seeded into 35 mm glass-bottom tissue culture plates (MatTek, Ashland, MA, USA) at an initial confluency of 20% and allowed to attach for 48 hours.
2.5. Gel Retardation Assay
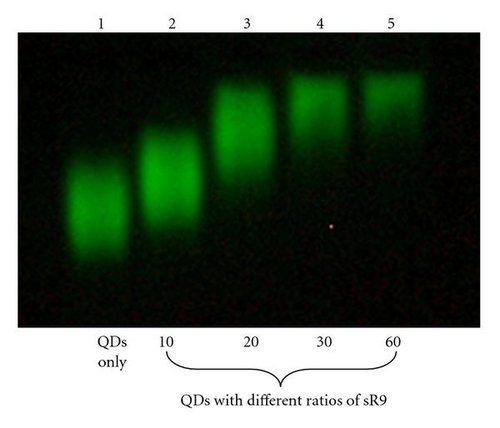
The QD and SR9 mixtures were prepared at different molecular ratios (1 : 10, 1 : 20, 1 : 30, and 1 : 60) and then incubated for 20 min at room temperature to allow noncovalent complexes to form. These complexes were analyzed by electrophoresis in a 0.6% agarose gel in 0.5% TAE buffer at 130 voltages for 60 min. The complexes were visualized by UV light.
2.6. QD Uptake with SR9 at Different Molecular Ratios
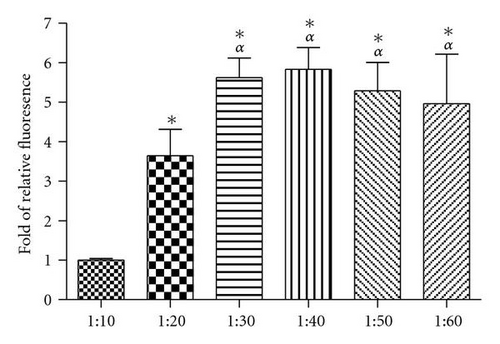
To determine the optimal QD/SR9 ratio for efficient delivery, A549 cells were incubated with QD/SR9 at different molecular ratios (1 : 10 to 1 : 60). The cells were washed with ice-cold phosphate buffered saline (PBS) six times to remove unbound QD/SR9. Fluorescent images were then obtained and quantified.
2.7. Cytotoxicity Measurement
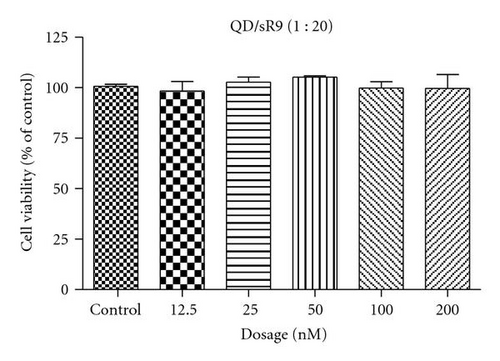
To determine the cytotoxicity of QD/SR9, A549 cells were treated with QD/SR9 (1 : 20) at 12.5, 25, 50, 100, and 200 nM QD concentrations for 24 hours. Untreated cells served as a control group. The MTS assay (Cell Titer 96 Aqueous One Solution Assay, Promega, Madison, WI, USA) was used to determine cytotoxicity. Absorbance was measured at 490 nm using a microplate reader (FLOUstar, BMG Labtechnologies, Durham, NC, USA).
2.8. Noncovalent Binding and Internalization of QDs and SR9
QDs were premixed with SR9 peptides at the molecular ratio of 1 : 20 at room temperature for 20 min. immediately upon removal of medium, the cells were treated with the QD/SR9 mixture at a final QD concentration of 150 nM for a designated period of time. After treatment, cells were washed six times with ice-cold PBS. Phenol red-free medium (2 mL) (Invitrogen, Carlsbad, CA, USA) was added for fluorescent image studies.
2.9. Uptake Studies
Energy Inhibition To determine whether uptake of QD/SR9 is energy dependent, cells were incubated with QD/SR9 under varying metabolic conditions. In temperature studies, cells were treated at either 37°C or 4°C. In the low temperature group, the cells were preincubated at 4°C for 30 min and then treated with QD/SR9 at 4°C for another 1-hour. Cells maintained at 37°C comprised the control group. In metabolic inhibition experiments, cells were incubated in the absence or presence of a mixture of metabolic inhibitors (0.15% sodium azide, 15 mM sodium fluoride, and 2 μg/mL antimycin A). Cells were pretreated with a mixture of metabolic inhibitors for 1 hour followed by addition of QD/SR9 to the cells and then incubated for another 1 hour.
Clathrin-Dependant Pathway Inhibition To disrupt clathrin-dependent endocytosis, hypertonic challenge, chlorpromazine, and MDC were used. Cells were pretreated with 0.45 M sucrose, 10 μM chlorpromazine, or 25 μg/mL MDC for 30 min. QD/SR9 was then added to the cells followed by 1 hour incubation.
Caveolin-Dependant Pathway Inhibition To inhibit caveolin-dependent endocytosis, filipin and nystatin were used to deplete cholesterol. Cells were preincubated with 3 μg/ml filipin and 20 μg/ml nystatin for 30 min before treatment with QD/SR9 for another 1 hour.
Macropinocytosis Pathway Inhibition EIPA (30 μM) or Cyt D (1 μg/mL) was used to block macropinocytosis. Cells were pretreated with the inhibitor for 30 min before treatment with QD/SR9 for another 1 hour.
2.10. Small Interfering RNA (siRNA) Transfection
Due to potential nonspecific effects and toxicity of pharmacological inhibitors, clathrin heavy chain and caveolin-1 siRNA (Sigma-Aldrich) were used to depress expression of critical components of the clathrin and caveolar pathways. The sense and antisense sequences of these siRNA were as follows.
-
5′-CCCUAAACACCUCAACGAU-3′ (sense)
-
5′-AUCGUUGAGGUGUUUAGGG-3′ (antisense).
-
5′- CAUUAUGACCGGGCUCAUA-3′ (sense)
-
5′-UAUGAGCCCGGUCAUAAUG-3′ (antisense).
Transfection of siRNA into the A549 cells was performed at a ~30% cell confluence. siRNA was complexed with Lipofectamine 2000 reagent according to the manufacturer’s instructions (Invitrogen). Western blot and QD/SR9 uptake studies were conducted 3 days after transfection.
2.11. Western Blot Analysis
A549 cells were lysed in a buffer comprised of 150 mM sodium chloride, 1.0% Triton X-100, and 50 mM Tris, pH 8.0, containing 1% protease inhibitor cocktail (Sigma-Aldrich). The protein concentration was quantified by the Bradford procedure (BioRad, Hercules, CA, USA). Ten μg total cell protein was electrophoresed on 8% (clathrin-heavy chain) or 12% (caveolin-1) SDS-PAGE, followed by electrotransfer to a nitrocellulose membrane. Clathrin-heavy chain was detected using a mouse monoclonal antibody at a dilution of 1 : 200 and goat antimouse IgG-HRP secondary antibody (Santa Cruz, CA, USA). Caveolin-1 protein was detected using a rabbit monoclonal antibody at a dilution of 1 : 1000 and goat antirabbit IgG-HRP secondary antibody (Cell Signaling, Danvers, MA, USA). The blots were probed with the ECL Western blot detection system according to the manufacturer’s instructions (Thermo Fisher Scientific, Rockford, IL, USA). The ImageJ software (NIH) was used for quantitative analysis of the Western blot.
2.12. Epifluorescent Microscopy
After treatment with QD/SR9, cells were viewed with an Olympus IX51 inverted microscope at 600X total magnification using a UPLFLN 60X NA 1.25 objective (Olympus, Center Valley, PA, USA). QD filter set (EX 435/40, EM 519-700) was used for QDs (Semrock, Rochester, NY, USA). Images were captured with a Hamamatsu ORCA285 CCD camera. Z series images of the entire cell volume were taken at 0.3 μm internals. Images were analyzed using SlideBook software (Intelligent Imaging Innovations, Denver, CO, USA).
2.13. Statistical Analyses
Data were expressed as the mean ± standard deviation from three independent experiments. Fluorescent intensity was quantified using SlideBook software. The mean fluorescence intensity (after background subtraction) of a single plane in Z series was recorded. One-tailed unpaired Student’s t-test was used for significance testing, using P = .05.
3. Results
3.1. Formation of QD/SR9 Noncovalent Binding
To test whether SR9 peptide stably associated with QDs, QDs were mixed with SR9 at various molecular ratios (1 : 10, 1 : 20, 1 : 30, and 1 : 60). These mixtures were separated by electrophoresis in a 0.6% agarose gel (Figure 1). QD mobility decreased as the amount of SR9 increased. This indicated the formation of noncovalent QD/SR9 complexes.
3.2. Molecular Ratio of QD and SR9 Affects QD Uptake
To determine the optimal ratio for cellular uptake, A549 cells were incubated with QDs (150 nM) preincubated with SR9 at different molecular ratios. QD uptake was increased as the ratio of SR9 increased from 1 : 10 to 1 : 30 (P’s < .01) (Figure 2). However, there was no increase in the amount of internalization at ratios above 1 : 30. Although the uptake reaches the highest level at 1 : 30, good imaging quality can be obtained at 1 : 20. Further, in the future we intend to use this system to carry cargoes which requires binding sites on quantum dots. Accordingly, we chose to use 1 : 20 as the ratio between QDs and SR9.
3.3. Time-Dependent Uptake
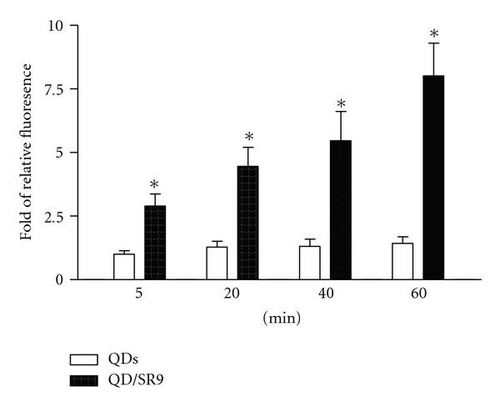
To determine the optimal dosing time, A549 cells were incubated with QD/SR9 (1 : 20) for 5 min, 20 min, 40 min, 1 hour, and 3 hours. Compared to the 5-minute group, the uptake of QD/SR9 was increased by 1.67 ± 0.37-fold in 20 min (P’s < .01) (Figure 3). The uptake was near maximal at 1-hour. Accordingly, the 1 hour uptake time point was used in subsequent experiments.

3.4. Cytotoxicity of QD/SR9
To assess the cytotoxicity of QD/SR9 complex, A549 cells were exposed to QD/SR9 (1 : 20) complex at various QD concentrations for 24 hours. No cytotoxicity of QD/SR9 was observed at concentrations up to 200 nM (Figure 4).
3.5. Cellular Uptake of QDs Facilitated by SR9 Peptide
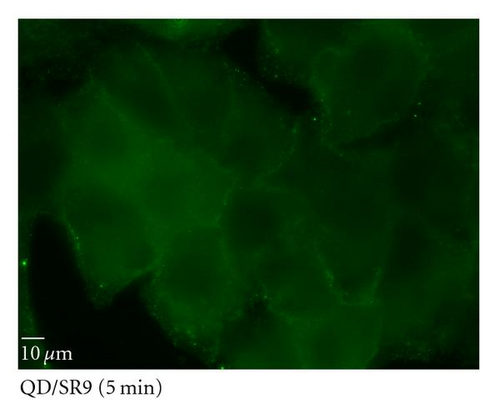
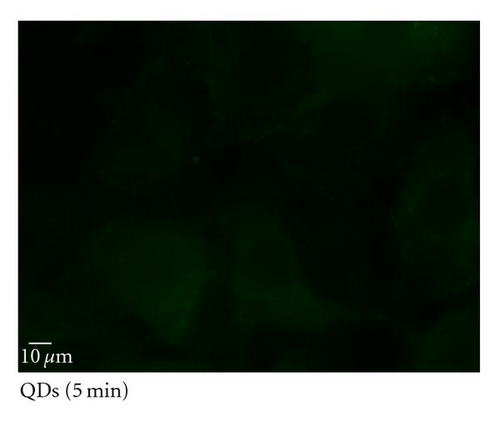
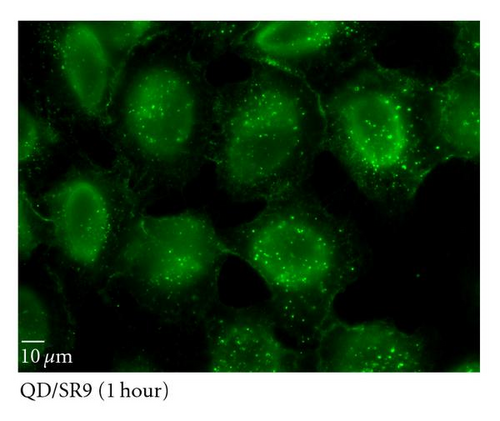
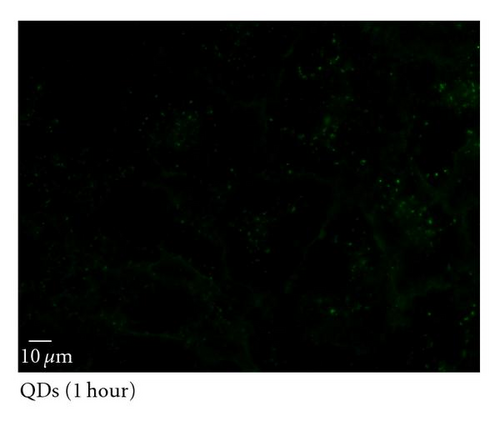
To determine the ability of SR9 peptide to facilitate QD delivery, A549 cells were treated with 150 nM QDs alone or 150 nM QDs premixed with SR9 at a ratio of 1 : 20. After incubation of 5 min, 20 min, 40 min, and 60 min, QDs-treated cells were observed under an epifluorescence microscope. Images taken using the same exposure time show that enhanced uptake of the QD/SR9 complex was observed compared to QD alone (Figures 5(b)–5(e)). Quantitation of fluorescence intensities shows that compared with QD alone in five minutes, the uptake of QD/SR9 increased by 3–8-folds (Figure 5(a)).
3.6. Mechanism of QD/SR9 Internalization
Endocytosis, an essential cellular process for internalizing extracellular materials, utilizes several distinct pathways. To determine the mechanism of SR9-mediated QD delivery, a series of inhibition studies were carried out.
3.6.1. Energy-Dependent Studies
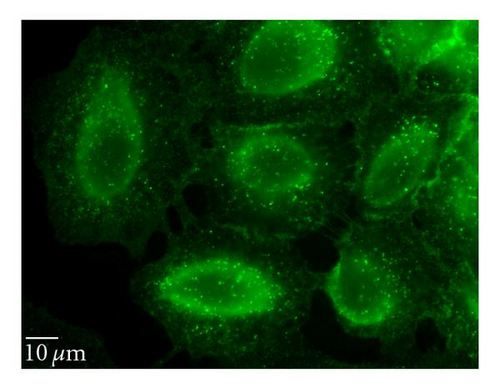
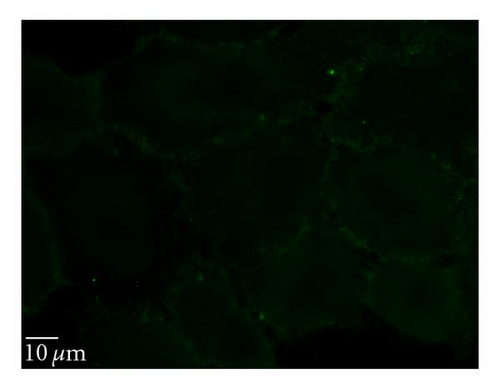
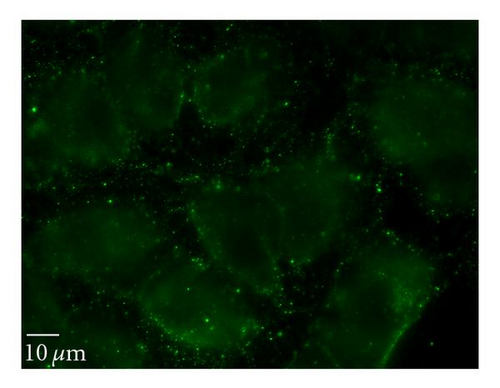
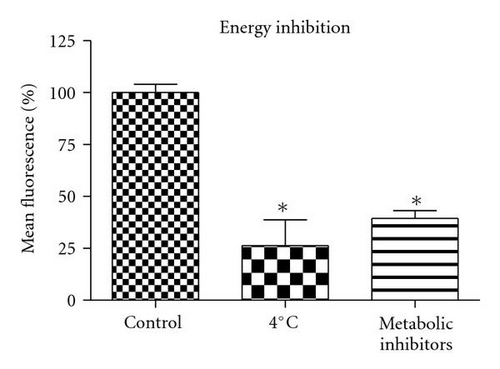
To determine whether uptake of QD/SR9 is mediated by energy-dependent endocytosis, we used low temperature or a mixture of metabolic inhibitors to deplete intracellular energy (Figure 6). In the low temperature study, the cells were incubated with QD/SR9 at 37°C or 4°C. As shown in Figures 6(a) and 6(b), QD/SR9 internalization was significantly impeded at 4°C; the fluorescence intensity at 4°C was 73 ± 11.5% lower than that at 37°C (P < .01) (Figure 6(d)). In the metabolic inhibition study, A549 cells were incubated with QD/SR9 in the presence or absence of a mixture of metabolic inhibitors (0.15% sodium azide, 15 mM sodium fluoride, and 2 μg/mL antimycin A). These metabolic inhibitors strongly inhibited the uptake of QD/SR9 (Figures 6(a) and 6(c)). The fluorescent intensity in the presence of metabolic inhibitors was 61 ± 5.7% lower than that in the control group (P < .01) (Figure 6(d)).
3.6.2. Clathrin-Dependent Pathway
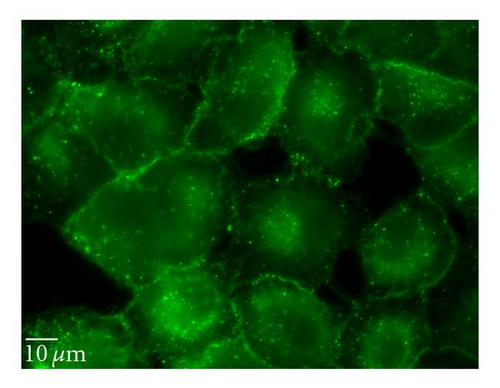
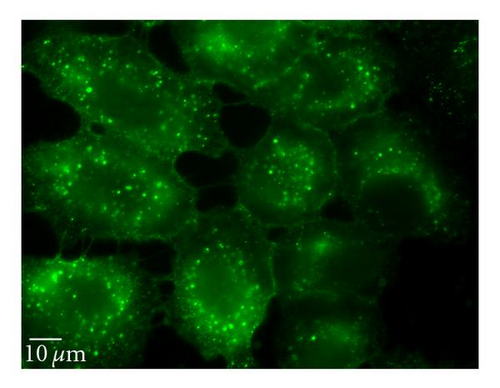
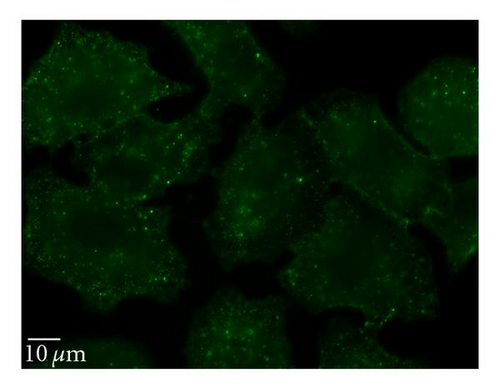
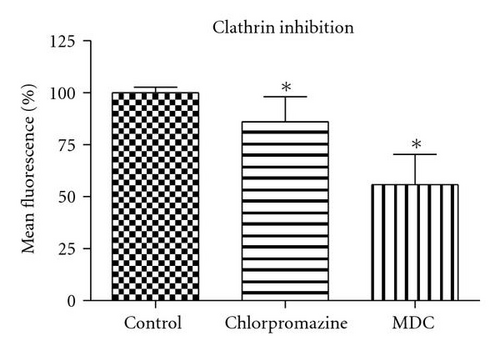
To perturb the clathin-dependent uptake pathway, three methods were used: monodansylcadaverine (MDC), hypertonic sucrose, and chlorpromazine. The inhibitory activity of MDC is attributed to the stabilization of nascent clathrin-coated vesicles, which limits new clathrin-coated vesicle production [20]. The underlying mechanism of hypertonic sucrose involves the dispersion of clathrin lattices on the plasma membrane [21]. Chlorpromazine is a cationic amphipathic drug that relocates clathrin and adaptor protein complex-2 (AP-2) from the plasma membrane to the endosomal membrane [22]. MDC reduced the uptake of QD/SR9 by 44 ± 13.0% (P < .01) while hypertonic medium decreased uptake by 59% (P < .01; data not shown). In contrast, chlorpromazine only slightly reduced uptake by 14 ± 12.1% (P > .05) (Figure 7).
3.6.3. Lipid Raft/Caveolin-Dependent Pathway
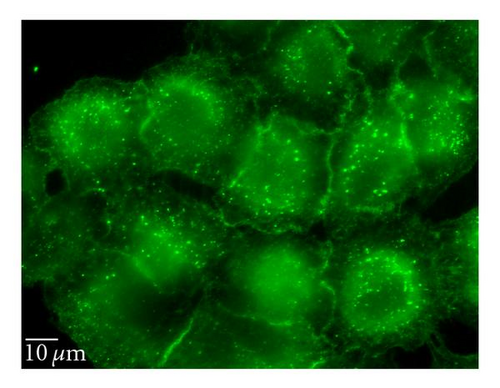
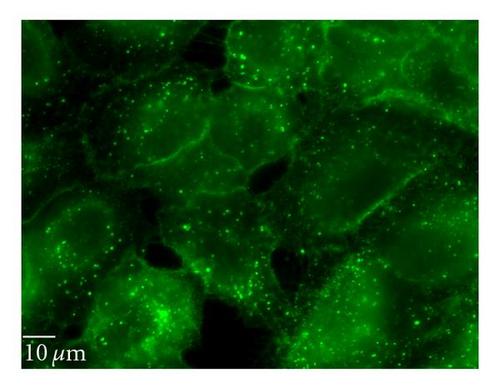
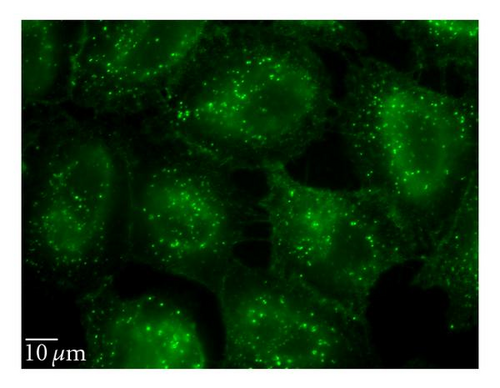
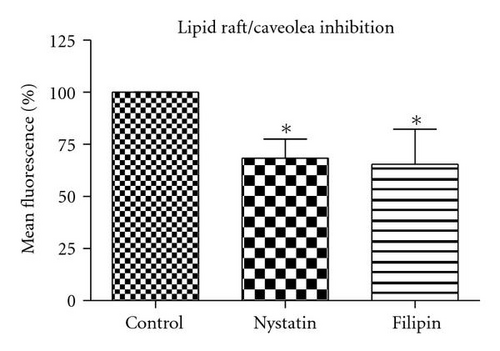
Nystatin and filipin, lipid raft inhibitors, are used to block the caveolin-dependent endocytic pathway [23, 24]. Treatment of cells with these two inhibitors reduced the QD/SR9 internalization by 32 ± 8.6% and 35 ± 15.5%, respectively, (P’s < .01) (Figure 8), indicating that a lipid raft-dependent process is involved in QD/SR9 internalization.
3.6.4. Macropinocytosis Pathway
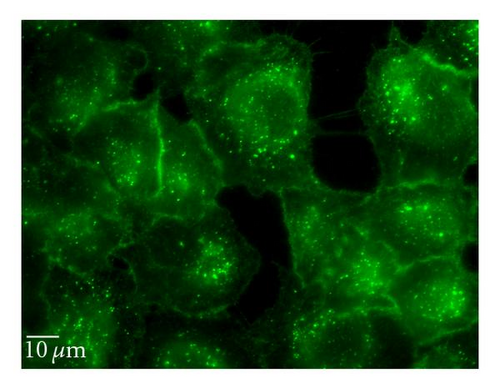
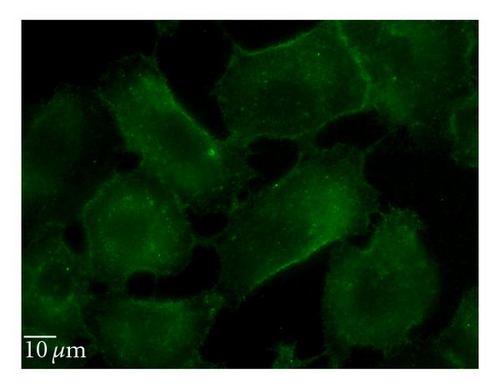
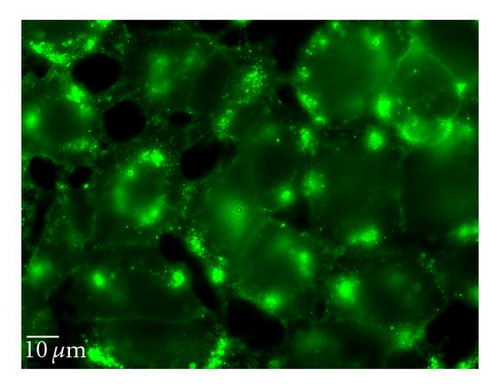
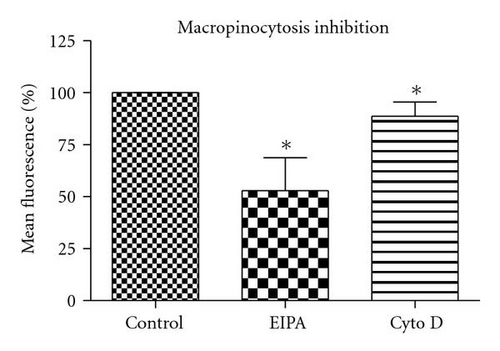
5-(N-ethyl-N-isopropyl) amiloride (EIPA) is an inhibitor of the Na+/H+ exchange that is required for macropinocytosis [25]. Cytochalasin D (Cyt D) is an F-actin depolymerizing drug that caps the barbed, faster-growing ends of actin filaments [26]. EIPA reduced the uptake of QD/SR9 by 47 ± 14.3% (P < .01) (Figure 9). To confirm the effective concentration of Cyt D, we used Alexa 568—phalloidin to stain actin of Cyt D-treated and control cells. Actin was depolymerized in A549cells by 1 μg/mL Cyt D (data not shown). Cyt D significantly reduced the uptake of QDs (P < .01) (Figure 9). Condensed green fluorescent agglomerates were observed around the cellular surface following treatment with Cyt D (Figure 9(c)).
3.7. siRNA Knockdown
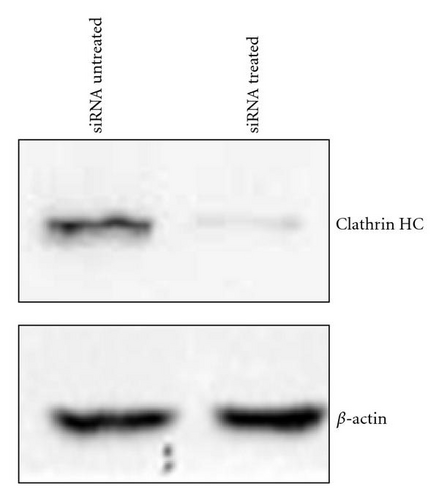
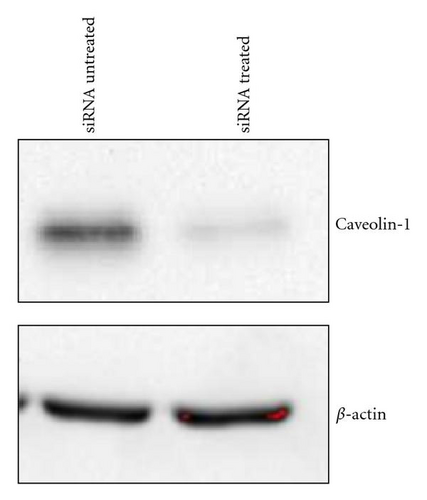
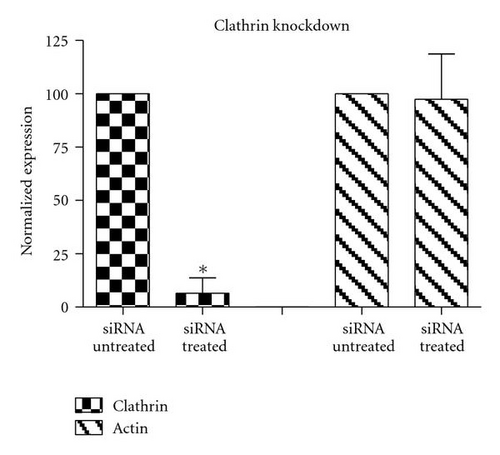
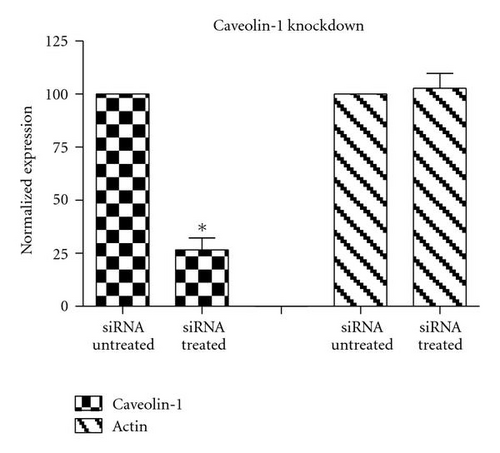
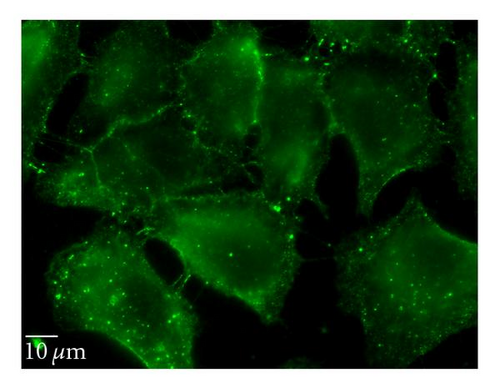
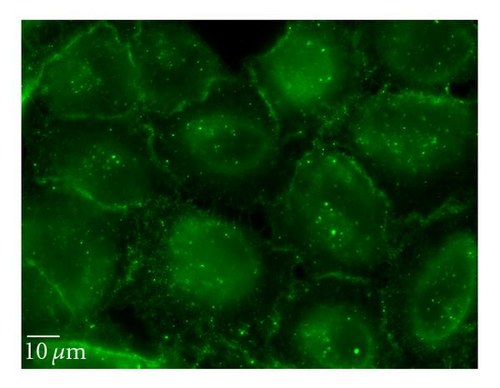
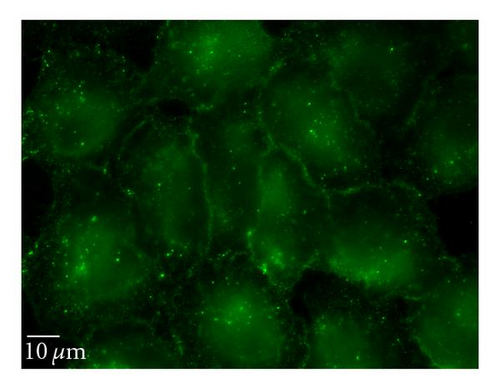
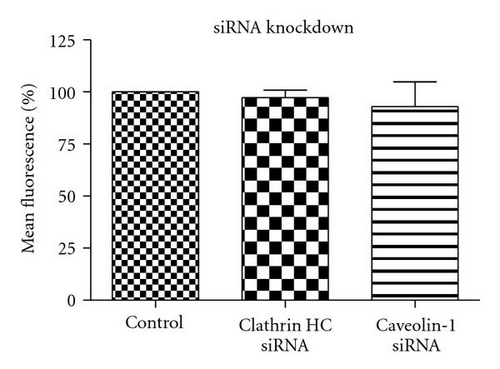
To complement the use of pharmacological inhibitors, we used the RNAi techniques to eliminate expression of specific components of the various uptake mechanisms. Clathrin HC and caveolin-1 siRNA were used to knock down clathrin-dependent and caveolin-depedent pathways, respectively. The Western blot experiments demonstrated the results of the knockdown treatment (Figure 10). The protein expression of clathrin and caveolin-1 was reduced by 93 ± 7.2% and 73 ± 5.7%, respectively, (P’s < .01). Following clathrin HC or caveolin-1 protein knockdown, the uptake of QD/SR9 was not significantly affected (Figure 11).
4. Discussion
Quantum dots are an emerging class of fluorescent probes for cellular imaging. In comparison with organic dyes and fluorescent proteins, QDs have unique properties, including high quantum yield and photostability, which make them better suited for delivering and monitoring biomolecules. The efficiency of internalizing QDs can be improved by incorporating cell-penetrating peptides [5]. Accordingly, our goals were to test whether nona-arginine (SR9) facilitates QD uptake and to determine the mechanism of this uptake. Data from this study demonstrate that QDs are internalized into A549 cells within 5 min with the aid of SR9; without SR9, QD uptake is minimal (Figure 5). The enhancement of internalization by basic protein transducers is thought to reflect an electrostatic interaction between cationic nona-arginine and the negatively charged polar heads of the phospholipids of the plasma membrane [18]. Our study demonstrates that SR9 can significantly increase QD uptake.
QD/SR9 internalization was dramatically blocked by either low temperature or a mixture of metabolic inhibitors. This indicates that the uptake of QD/SR9 is highly energy-dependent and supports the notion that endocytosis is the major uptake process. Since endocytosis encompasses numerous pathways, our subsequent studies were designed to further elucidate the specific mechanism of uptake.
Clathrin-dependent endocytosis is a well-characterized endocytic pathway. To determine the role of clathrin-mediated uptake of QD/SR9, we used three different inhibitors. Treating cells with hypertonic sucrose significantly reduced QD/SR9 uptake. Although this kind of inhibition is considered evidence of clathrin-dependent endocytosis, recent studies have suggested that it also interferes with other internalization pathways, including caveolin-dependent endocytosis and macropinocytosis [27]. Accordingly, the effects of two additional inhibitors, MDC and chlorpromazine, were determined. MDC significantly impeded QD/SR9 internalization. Though MDC is considered as a clathrin pathway inhibitor, it is also a macropinocytosis inhibitor via suppression of the transglutaminase family that activates Rho GTPases, the key regulators of actin assembly and dynamics [27]. Thus, MDC might block actin-dependent pathways such as macropinocytosis. Chlorpromazine had only a small effect on uptake. Due to the varying results and possible off-target effects of the inhibitor studies, we used siRNA to knock down clathrin heavy chain. The Western blot analysis indicated that near complete clathrin protein (93 ± 5.7%) expression was suppressed. The almost complete loss of clathrin did not affect the QD fluorescence intensity inside cells relative to control levels. Together, our data suggest that clathrin-mediated endocytosis is not required for QD/SR9 internalization. However, because clathrin protein was not completely eliminated, we cannot rule out that clathrin is involved in QD/SR9 uptake.
Nystatin and filipin are polyene antibiotics that accumulate cholesterol and thereby sequester lipid from cell membranes. Nystatin and filipin are highly selective inhibitors of the lipid raft-dependent pathway because of this lipid sequestering [23, 24]. Both inhibitors hindered the uptake of QD/SR9, suggesting that the internalization was lipid raft dependent. Cholesterol depletion could result in blockage of several lipid raft-dependent endocytic pathways, including caveolae-dependent and macropinocytic pathways [24]. For further clarification, caveolin-1 siRNA was used to knockdown caveolin-1 expression. The Western blot analysis and live cell imaging indicated that internalization of QD/SR9 was not reduced while caveolin-1 protein was knocked down by 73 ± 7.2%. These findings suggest that QD/SR9 internalization is a lipid raft-dependent process that is not mainly caveolin-mediated. Because caveolin-1 protein was not completely knock down, we cannot rule out that caveolin-1 was involved in QD/SR9 uptake.
Macropinocytosis is a rapid, lipid raft-dependent, and receptor-independent form of endocytosis. Macropinocytosis includes three essential steps: actin cytoskeleton-driven ruffle formation, closure of the ruffle into a vesicle, and dissociation of actin filaments from the vesicle [28]. The fluorescent intensities in cells treated with two macropinocytosis inhibitors, EIPA and Cyt D, were significantly reduced compared to the control cells. It is worth noting that in Cyt D-treated cells, QD/SR9 was densely localized around cellular surfaces, not in cytosol, leading to overestimate of QD/SR9 internalization. This is similar with the observation of Nakase et al. that cellular R8 peptide was predominantly localized in cellular boundaries with very little punctuate staining in Cyt D-treated cells [29]. Ruan et al. made a similar observation with Cyt D-treated cells [6]. It is unclear how the dense aggregates affect quantitation. In summary the uptake of QD/SR9 is lipid raft-dependent macropinocytosis.
Collectively, our data show that SR9 facilitates a rapid energy-dependent cellular entry of QDs. The internalization involves lipid raft and depends on macropinocytosis. Other pathways such as RhoA-dependent and CDC42-dependent endocytic pathways may also deserve attention [30, 31].
Acknowledgments
The authors thank Robert S. Aronstam for technical editing and Chuan-Chin Huang and Hsiu Jen Wang for technical support. This work was supported by Award No. R15EB009530 from the National Institute of Biomedical Imaging and Bioengineering (to Y.-w. Huang) and the National Science Council (NSC 97-2621-B-259-003-MY3 to H.-J. Lee), Taiwan.


