A Numerical Study of the Impact of Radial Baffles in Solid Bowl Centrifuges Using Computational Fluid Dynamics
Abstract
Centrifugal separation equipment, such as solid bowl centrifuges, is used to carry out an effective separation of fine particles from industrial fluids. Knowledge of the streams and sedimentation behavior inside solid bowl centrifuges is necessary to determine the geometry and the process parameters that lead to an optimal performance. Regarding a given industrial centrifuge geometry, a grid was built to calculate numerically the multiphase flow of water, air, and particles with a computational fluid dynamics (CFD) software. The effect of internal radial baffles on the multiphase flow was investigated. The results show that the baffles are helpful for the acceleration of the fluid, but they disturb the axial boundary layer, making it irregular, and originate a secondary circulating flow which hinders the sedimentation of small particles.
1. Introduction
Solid-liquid separation is an important operation, especially in industrial postprocessing. Centrifuges can be used to separate fine solid particles from industrial fluids to increment its service life. Some examples are the cleaning of coolant lubricants in metal, glass, and ceramics processing as well as the maintenance of chemical surface treatment baths. Among other centrifugal devices as decanters and disk stack separators, which are more complex, solid bowl centrifuges can be used to reach the mandatory clarifying purity.
Generally, there are two different models to describe the flow field established in a solid bowl centrifuge when inflow and outflow are both present [1]. The plug flow model proposes a constant uniform axial velocity across the annular pool from the surface to the bowl wall. On the contrary, the boundary layer model suggests a thin boundary layer moving with high axial velocity towards the weir located at the interface between the liquid and the air core. This flow pattern in a rotating bowl is known especially for fluid flows with a free surface open to the atmosphere and it has been analyzed in tubular centrifuges by Bass [2] and Gösele [3] and in overflow centrifuges by Glinka [4] and Reuter [5]. But the complex flow field and sedimentation process of industrial solid bowl centrifuges have not been amenable to rigorous mathematical analysis. Particularly, the effect of internals such as radial baffle plates, deflectors that divide the centrifuge in radial chambers, has not been investigated yet. These internal radial baffles are used often in this type of centrifuges [6].
Figure 1 represents the centrifuge object of this research, a semicontinuous solid bowl centrifuge with an automatically sludge discharge system. The liquid with impurities enters the centrifuge and reaches the feed accelerator. Then, it leaves the accelerator and impinges on the rotating liquid pool, where the sedimentation occurs. The particles settle on the bowl wall, while the clear liquid leaves through the boreholes at the top of the bowl. After flowing through these boreholes, the clear liquid is collected in an annular chamber, where a skimming pipe drives it out of the machine. During the centrifugation the baffles rotate with the same angular velocity as the bowl in order to accelerate the liquid. Once the maximum solid load at the wall is reached, the bowl slows down, and when the centrifuge stops, the baffles move separately to facilitate the sludge discharge thanks to the scrapers attached at the edge of the baffles.
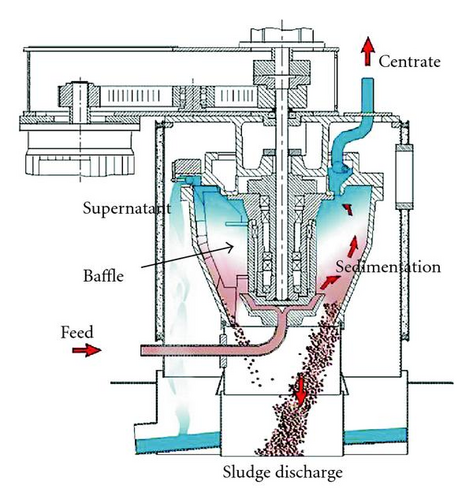
An innovative way to obtain information about the flow inside these devices is to calculate the multiphase flow numerically using computational fluid dynamics (CFD) software. Simulations of the flow in some industrial process equipment have been developed using CFD and even some researchers [7–9] have recently attempted to simulate the flow in centrifuges.
2. Model Description
2.1. Mathematical Formulation of the Fluid
Computational Fluid Dynamics (CFD) solves the governing fluid flow equations and continuity and momentum conservation equations, by means of numerical methods. These partial differential equations are calculated using the finite volume method [10].
The k-ε model developed by Launder and Spalding [15] is a semiempirical model that requires two additional transport equations to model the turbulences, one for the turbulent kinetic energy k, and another one for its rate of dissipation ε. The advantage of this approach is the relatively low computational effort. Its limitation is the assumption that the turbulences are isotropic, which is not strictly true. The k-ε renormalization group model (k-ε RNG) of Yakhot and Orszag [16] is an extension of the standard k-ε model that takes into account the effect of swirl on turbulence, enhancing a higher accuracy for swirling flows. This model is more reliable for a wider class of flows than the standard k-ε model.
2.2. Mathematical Formulation of the Particles
3. Simulation Methodology
3.1. Geometry and Mesh
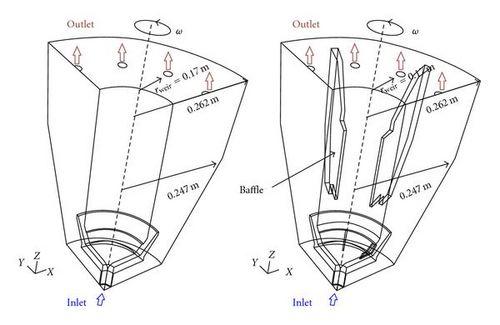
Based on the real geometry of an industrial solid bowl centrifuge (see Figure 1), two different three dimensional geometries, representing one fourth of the bowl, were built and meshed (see Figure 2). Because of the periodically repeating nature of the system only one fourth of the centrifuge has been simulated. The geometry on the left avoids the baffles and it has a simplified geometry at the accelerator. On this geometry, an unstructured mesh with about 200000 tetrahedral cells was created. The geometry on the right takes the exact geometry at the inlet accelerator and the radial baffles dividing the centrifuge in radial compartments into account. The centrifuge has eight baffles attached to the shaft and disposed regularly in the circumferential direction. The baffles are located approximately three centimeters above the inlet accelerator and three centimeters away from the bowl wall. This geometry was meshed with about 780000 tetrahedral cells and refined at the bowl wall and at the radial walls to capture high velocity gradients. To check the results independency on the grid, the simulation was run also using another grid with approximately 20% more cells. The obtained results did not change qualitatively and the small quantitative deviations arise from the different reporting times of the quasi-steady state and not from the grid refinement.
3.2. Boundary Conditions
The liquid enters the centrifuge through the inlet with a given velocity flowing then into an accelerator, which consists of two rotating plates. Side and top walls of the bowl, defined with no-slip condition, rotate with the same angular velocity as the plates. The baffles rotate with this angular velocity to accelerate the fluid. The fluid leaves the centrifuge through boreholes (outlet in Figure 2); there atmospheric pressure was imposed as boundary condition. For the periodic surfaces, a periodic boundary condition was defined. This boundary condition uses the flow conditions at one of the periodic surfaces as its cells were the adjacent cells of the other periodic plane.
3.3. General Solution Method
To simplify the simulation, the air is considered as an incompressible gas. This is a reasonable assumption for the operation conditions of atmospheric pressure and for a non-temperature-dependent problem. The water is defined as an incompressible Newtonian fluid.
The simulations were performed with the commercial software Fluent 6.3.26. The solver used was an unsteady pressure based solver. The Equations (1)–(4) were calculated based on a moving reference frame, which is used to facilitate calculations in rotational systems.
The following simulation settings were chosen according to the recommendations of Fluent 6.3 Documentation, User’s guide (2006). Standard wall functions, most widely used for industrial flows, were applied at the walls. The spatial discretization schemes used for the velocity and the turbulent variables were the default (first order upwind). Pressure was discretized with a pressure staggered option scheme, recommended for high speed rotating flows, and the volume fraction, with the Geo-Reconstruct scheme to obtain a sharp interface between both phases. Pressure and velocity were coupled with the PISO schema because of the transient calculation. The Courant number, a dimensionless number that compares the time step of the calculation to the characteristic time needed by a fluid element to cross a cell, was restricted to a maximum value of two, getting a variable time step between 10−5 and 10−4 s. Simulations performed with a Courant number value of one showed no variation of the results, verifying the independence of the time step used.
The simulation ran on a cluster with 12 parallel processors each 1.5 GHz, for approximately 30 days, until the flow patterns achieved a quasi-steady state and the mass balance was fulfilled. Then, changes in the conditions were made and after some days a new quasi-steady state was reached again.
4. Simulation Results
4.1. Phases Distribution
The simulation results show a rotating water pool at the bowl wall around an air core with a relatively sharp gas-liquid interface for both geometries (see Figure 3). Water is fed axially through the inlet to the accelerator; there the water changes its direction and gains in tangential velocity. Then, a jet of water exits the accelerator and enters the rotating liquid pool. The water exits the centrifuge through the boreholes at the top of the bowl.
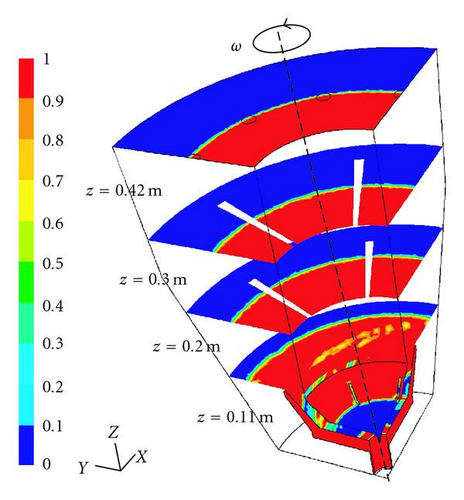
The interface position depends in this case on the position and size of the outlet boreholes. The radius of the interface can change, depending on the operation conditions, in a small radial range corresponding to the size of the holes, between 0.154 m and 0.170 m. As shown in Table 1, the interface radius decreases with an increase in the flow rate and a reduction of the rotation speed, this means that there is more water in the bowl.
| Operation conditions | Interface radius | |
|---|---|---|
| 2550 rpm | 50 l/min | 0.1672 m |
| 2550 rpm | 140 l/min | 0.1657 m |
| 2550 rpm | 150 l/min | 0.1649 m |
| 2000 rpm | 140 l/min | 0.1643 m |
4.2. Flow Patterns
The main flow occurs in the direction of the rotation speed of the bowl; both the liquid pool and the air core rotate. Nevertheless, secondary flows in axial and radial direction appear in different manners for both models. As shown in previous investigations [18], for the model without radial baffles a homogeneous axial boundary layer is formed at the interface between air and liquid with a recirculation layer beneath. In the model with baffles, radial circulations appear disturbing the axial boundary layer.
4.2.1. Tangential Velocity
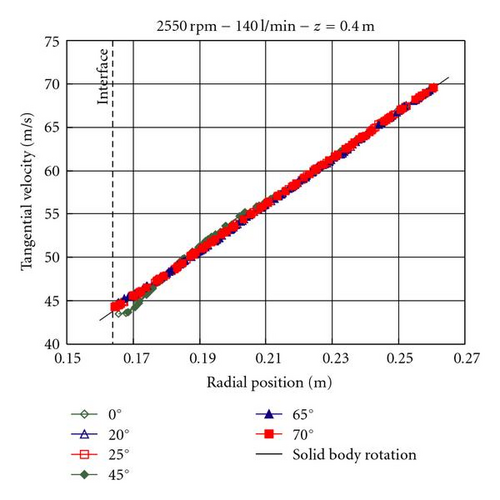
The tangential velocity of the water jet coming from the inlet accelerator is lower than the tangential velocity of the bowl, as shown in Figure 4 at the surface z = 0.11 m. This causes a slowdown of the whole rotating liquid pool. The averaged tangential velocity of the liquid in the geometry without baffles lays approximately 11% underneath the velocity of a solid body rotation (see Figure 5). The deviation from the rigid solid motion decreases for lower flow rates, because less liquid has to be accelerated. The values at the wall have to reach the solid body rotation because of the no-slip boundary condition. Therefore, these values are closer to the solid body rotation as the others. A bend appears at the end of the boundary layer of the grid.
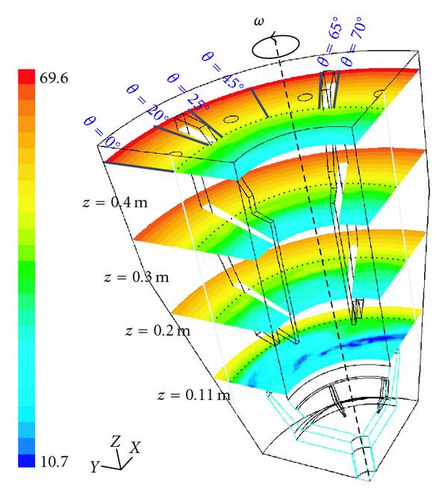
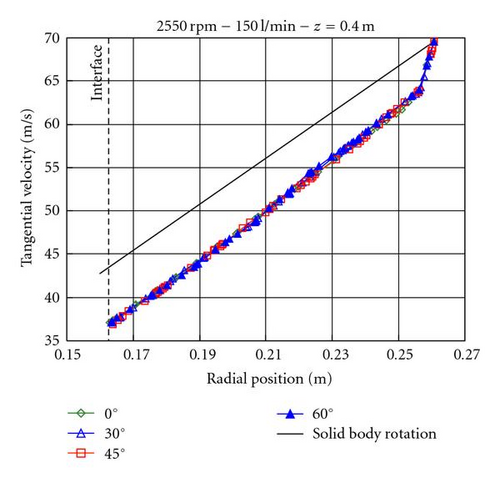
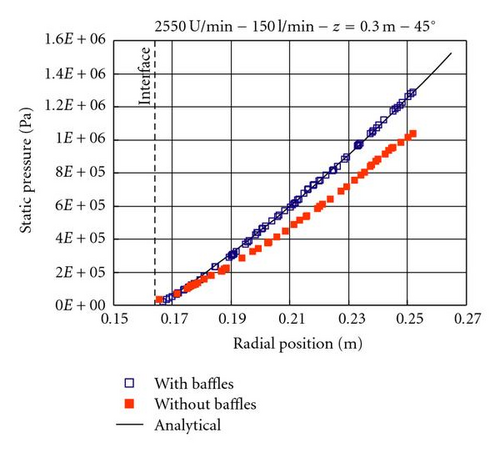
On the contrary, for the geometry with baffles the expected velocity of a solid body rotation is achieved (see Figure 6). Only a slightly deviation appears at the interface for the angular positions 0° and 45°, in the middle between two baffles. This slight deviation even disappears for lower flow rates. Therefore, we can conclude that the slow down on the rotating pool caused by the under accelerated inlet flow is now avoided because of the momentum transmitted by the radial baffles. This way the centrifugal force acting on the particles increases.
4.2.2. Axial Velocity
As expected by the boundary layer model, a boundary layer of fast moving fluid at the gas-liquid interface has been observed in the simulations without radial baffles (see Figure 7). Recirculation layers appear alongside this layer and at the bowl wall, in contrast to the model that only predicts the recirculation at the bowl wall. The velocity values oscillate a little with the angle and will not be exactly zero outside the layers. This boundary layer cannot be clearly seen until the position z = 0.2 m. Backwards, near the impinge point; the layer has not been developed yet. For lower flow rates the thickness of the layer decreases and the axial velocity diminishes.
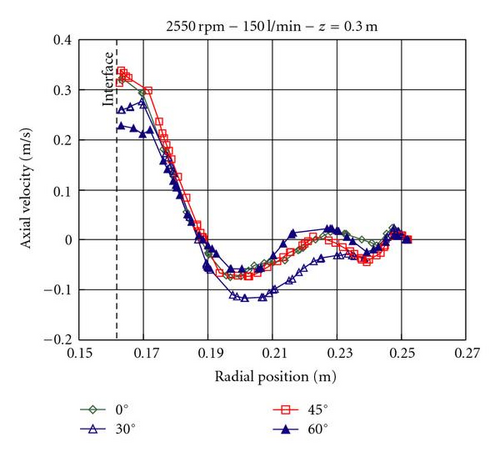
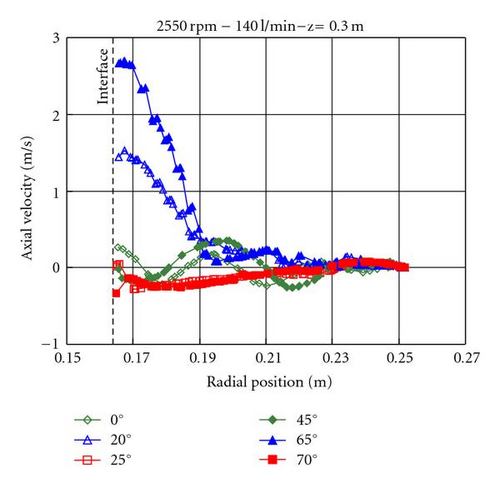
The simulation with baffles showed that these radial elements disturb the boundary layer of fast moving fluid at the gas-liquid interface. Instead, an irregular layer at the interface is formed predominating at the position in front of the walls (see Figure 8). Because of the discontinuity of the boundary layer, the axial velocity values are higher than for a regular layer. This irregular layer becomes more and more regular increasing the height of the centrifuge.
4.2.3. Radial Velocity
In the simulations without baffles, significant radial velocity was only observed at the inlet accelerator and on the jet leaving it. The radial component of velocity was negligible in the remaining domain.
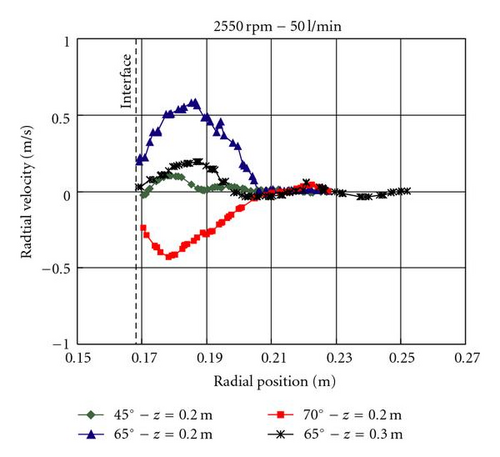
The other effect produced by the radial baffles is a circulating flow between the walls in the same direction as the rotation speed of the centrifuge. Figure 9 shows the radial velocity over the radial position for different angular positions. The radial velocity is positive in front of the radial walls, where the flow is directed to the bowl wall, and it turns negative behind the radial walls, flowing back to the core. In the middle of the walls, there is almost no radial movement and the radial velocity is approximately zero.
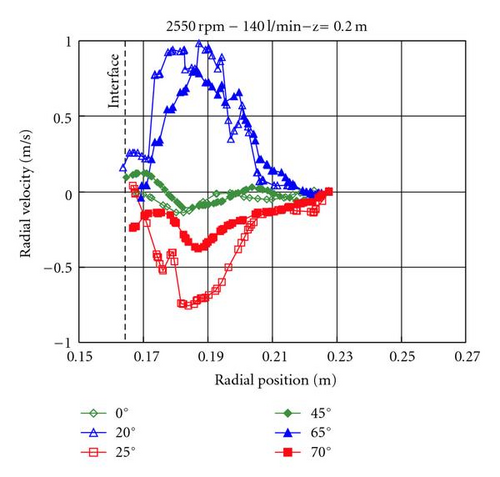
This radial circulation is originated when the water jet coming from the inlet accelerator impinges in the rotating liquid pool with a lower tangential velocity. This liquid impacts against a radial baffle and it is redirected to the bowl wall. For this reason, the intensity of this radial circulation decreases for lower flow rates, where a smaller amount of liquid has to be accelerated and hence a smaller velocity slip regarding the rotating pool is achieved. Figure 10 shows these lower radial velocities for a flow rate of 50 l/min compared to the ones obtained at 140 l/min, as shown in Figure 9. The radial circulations mainly occur in the first half of the centrifuge near the inlet, where the flow is more irregular, and decreases with the height (see Figure 10 where two different z locations are compared). For this reason some authors define an inlet zone with turbulences before the flow inside the centrifuge acquires an ordered form. The relationship between length and radius is too small here, compared with the analysis made by Glinka [4]. Thus, an ordered flow is not achieved.
This secondary flow induced by the baffles hinders the sedimentation of small particles, which get captured in these circulations instead of settling on the bowl wall.
4.3. Pressure Distribution
4.4. Shear Stress
As expected, wall shear stress appears just in the inlet accelerator where the fluid acquires the rotation speed. For both models, the values of the wall shear stress varies in a range between 700–750 Pa approximately. This parameter should be taken into account when agglomerates and shear susceptible materials have to be centrifuged. Some low shear stresses arise in the inlet pipe and at the bottom part of the bowl wall where the fluid impacts, both with a value of approximately 50 Pa.
4.5. Particle Tracks
Once the flow simulation has converged, 30000 particles with different diameters (from 10 μm to 0.5 μm) and 2650 kg/m3 density were released in the region where the water jet coming from the accelerator enters the rotating pool. Their trajectories were traced using (4). Because of the low concentration of the particles in the feed, 0.4 vol. %, the impact of the particles on the continuum phase was neglected.
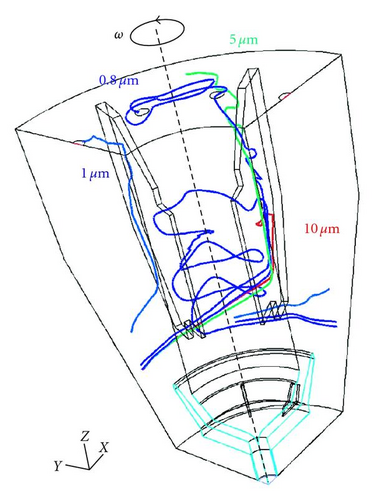
The simulation results show notably different traces depending on the flow existing in the centrifuge. Figure 12 shows particles rotating around the axis, as the tangential movement superposes axial and radial movements for the geometry without the baffles. The particles travel along the axial boundary layer. Then they pass through it and penetrate the layer with slow negative axial velocity moving backwards. Finally they accelerate towards the wall, where the calculation stops. Smaller particles travel longer along the axial layer than the bigger ones and some of them leave the centrifuge following the flow.
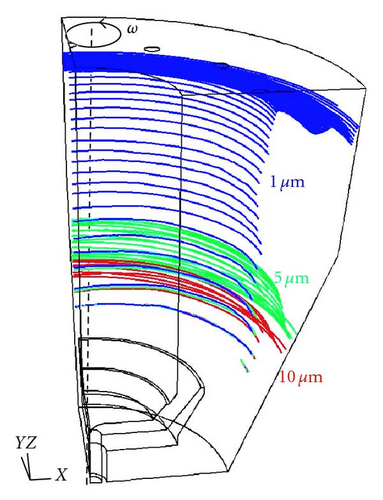
Figure 13 shows the particle traces for the geometry with radial baffles. Here, small particles get captured by the axial flow in front of the walls and the radial circulation between them, which hinders its sedimentation. Some of the particles reach the wall, but the other ones escape through the outlet following the flow. Particle tracks are strongly influenced by the secondary flow, especially for particles in the micron range.
5. Validation
The simulation results have to be compared with experimental results to consider the mathematical formulation and the methodology as valid. Because the experimental investigation of the flow inside a rotating device presents many difficulties, the grade efficiency was used for the validation in this case.
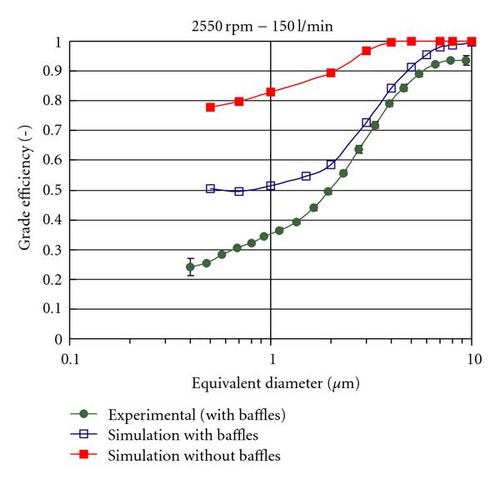
The grade efficiency achieved with the geometry without radial baffles is higher than the experimental values. Thus, these internals have an important effect on the particle traces and have to be considered. The baffles are helpful for the acceleration and should improve the separation efficiency, but they originate a secondary flow which hinders the sedimentation of small particles.
The simulated grade efficiency for the real geometry with radial baffles agrees with the experimental values for particles bigger than 2 μm. Differences appear for particles smaller than 2 μm. On the one hand, small particles penetrate into the air phase because the force at the interface caused by the surface tension is not considered in (4). On the other hand, electrostatic forces and particle-particle interaction forces, which are not taken into account in the current calculation, play a major role for submicron particles.
Particle Accretion Another possibility to validate the simulations is to compare the sediment formed in the experiments with the location of the settled particles in the simulation. The volume of already settled particles is not taken into account in the simulation for the calculation of new particles; no particle-particle interaction was implemented. However, the location where the particles impact at the bowl wall can be a reference to validate the particle tracks, and thus to validate the calculated flow. The particle accretion equation implemented in the software Fluent was used to count the particles settled in each of the faces at the bowl wall
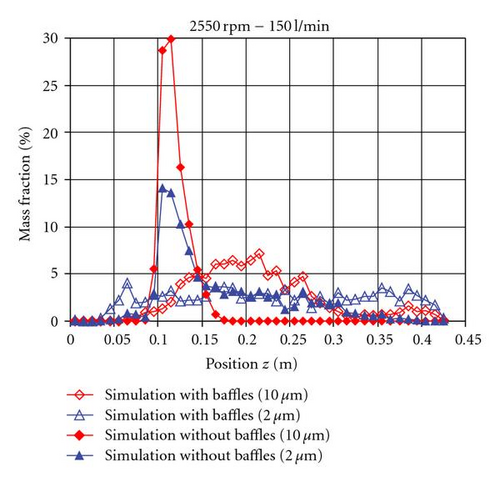
Figure 15 shows the particle accretion for two different particle sizes in both geometries. In the geometry without the baffles, the big particles settle mainly in the lower part of the centrifuge (between 0.1 an 0.15 m in the z direction). Smaller particles extend slightly to higher axial positions. In the geometry with baffles the accumulation of the particles takes place along the whole axial positions of the bowl wall.
In the experiments, a homogeneous sedimentation along the bowl wall was observed, confirming the accretion of the particles calculated with the geometry with baffles. Samples of the sediment at different heights of the centrifuge were taken and analyzed. The particle, size distribution of the samples showed just slightly differences between the different heights. These differences were due to the difficulty of sampling, made just after the experiment before the sediment slips down the bowl wall. This fact corroborates the accumulation of the particles calculated with the geometry with baffles, with just small differences between the particle sizes.
6. Conclusions
CFD simulations of the multiphase flow in a solid bowl centrifuge with radial walls were successfully performed with the software FLUENT. The main flow of water takes place in tangential direction. For the geometry without the baffles the values of the velocity lie underneath the velocity of a solid body rotation. Otherwise, due to the extra acceleration of the radial baffles, the values of tangential velocity in this geometry reach the solid body rotation. Another effect of the baffles is the distortion of the axial boundary layer at the gas-liquid interface, that appears now irregularly and predominating at the angular position in front of the baffles. Furthermore, a circulating flow between the baffles in the same direction as the rotation speed of the centrifuge appears. The radial baffles are helpful for the acceleration and should improve the separation efficiency, but they originate a secondary flow which hinders the sedimentation of small particles. This secondary flow decreases with the height of the centrifuge.
Particles with diameters from 10 μm up to 0.7 μm were tracked using the discrete phase model. Simulated and experimental grade efficiency agrees with each other for particles, bigger than 2 μm. For smaller particles there is no agreement because other forces, neglected in this model, have to be considered. The accretion of the simulated particles was calculated and compared with the sediment of the experiments. The model with the baffles predicts a sediment along the whole bowl wall, in agreement with the sediment observed in the experiments.
Considering the validation of the simulations made by comparing the grade efficiency and the sediment distribution, we can conclude that the simulated flow qualitatively agrees with the real flow occurring inside this industrial centrifuge. This points out that there is an optimization potential regarding the number and the form of the radial baffles, which are needed to achieve a high-separation force but induce secondary flows hindering the settling of small particles.
-
- Aface:
-
- Area, m2
-
- CD:
-
- drag coefficient, dimensionless
-
- d:
-
- diameter, m
-
- F:
-
- volumetric force, N m−3
-
- k:
-
- turbulent kinetic energy, m2 s−2
-
- N:
-
- number of particles
-
- :
-
- mass flow, kg s−1
-
- p:
-
- pressure, Pa (N m−2)
-
- Raccretion:
-
- accretion rate, kg m−2 s−1
-
- Rep:
-
- particle Reynolds number, dimensionless
-
- t:
-
- time, s
-
- v:
-
- velocity, m s−1.
-
- α:
-
- Volume fraction, dimensionless
-
- ε:
-
- turbulent kinetic energy dissipation rate, m2 s−3
-
- ζ:
-
- normally distributed random number, dimensionless
-
- μ:
-
- dynamic viscosity, kg m−1 s−1
-
- ρ:
-
- density, kg m−3
-
- τ:
-
- shear stress tensor, Pa (N m−2)
-
- τe:
-
- eddy characteristic lifetime, s
-
- ϖ:
-
- angular velocity, s−1.
-
- i, j:
-
- Fluid phases
-
- p:
-
- particle
-
- q:
-
- fluid phase
-
- r:
-
- rotational
-
- t:
-
- turbulent
-
- x:
-
- x direction
-
- y:
-
- y direction
-
- z:
-
- z direction.
Acknowledgments
The authors owe special thanks to the cooperation partner “Separatoren-Technik und Anlagenbau GmbH” for very good collaboration and technical support and the AIF as part of the German Ministry of Economy (BMWI) for financial support.


