A Simplified Recombinant PSO
Abstract
Simplified forms of the particle swarm algorithm are very beneficial in contributing to understanding how a particle swarm optimization (PSO) swarm functions. One of these forms, PSO with discrete recombination, is extended and analyzed, demonstrating not just improvements in performance relative to a standard PSO algorithm, but also significantly different behavior, namely, a reduction in bursting patterns due to the removal of stochastic components from the update equations.
1. Introduction
Originally conceived as a modification to the standard PSO algorithm for use on self-reconfigurable adaptive systems used in on-chip hardware processes, PSO with discrete recombination (PSO-DR) introduces several appealing and effective modifications, resulting in a simpler variant of the original [1]. It is one of the more interesting advances in PSO research over the last few years because these simplifications apparently do not degrade performance yet they remove various issues associated with the stochasticity of the PSO acceleration parameters that hinder theoretical analysis of PSO.
Physical creation of hardware-based optimizers is a substantially more intricate undertaking than software implementations, so fast, simple algorithms are desirable in order to minimize complexity. The comparative straightforwardness of PSO to many other evolutionary optimization algorithms makes it a good choice for this purpose, and further modifications were applied by the authors of [1] in order to simplify it even further and to introduce concepts from recombinant evolutionary techniques. The resulting algorithm, which can be implemented using only addition and subtraction operators and a simple 1-bit random number generator, is well suited for dedicated hardware settings.
Despite this rather specific original design specification, PSO-DR has shown to be a robust optimizer in its own right, equalling or surpassing a more common PSO implementation on a few tested benchmarks [1]. In this paper we extend the original work of Peña et al. by considering alternative topologies and parameter settings, running comparisons over a more comprehensive test suite, deriving simplified variants of the algorithm, and subjecting the model to a burst analysis.
The following section introduces PSO-DR (known here as model 1) as originally defined by Peña et al. and summarizes the burst analysis of [2]. Section 3 describes a series of simplifications to PSO-DR (models 2 and 3) which are introduced in this paper. The motivations for these simplifications are explained. Section 4 presents the results of performance experiments of models 1–3, and for comparative purposes, standard PSO. Following this, the paper proceeds with an empirical investigation of bursting patterns in recombinant PSO. The final section together draws together the experimental results of this paper and advances some ideas for the immediate future of PSO research.
2. PSO with Discrete Recombination
The choice of ϕ was based on the observation that ϕ ≈ 4.0 in standard PSO, but, since u1,2 are uniform in [0, 1], the expectation value of ϕu1,2 is 2.0. Furthermore, the multiplication by w = 0.5 can be implemented in hardware by a right shift operation. While optimal efficiency is desirable for hardware implementations, this issue does not concern us to the same degree in this study of (4) and it is one aim of this paper to study PSO-DR for arbitrary parameter values.
PSO bursts differ from the random outliers generated by PSO models which replace velocity by sampling from a distribution with fat tails such as a Richer and Blackwell [5]. In contradistinction to the outliers of these “bare bones" formulations [6], the outliers from bursts occur in sequence, and they are one dimensional. Bursting will therefore produce periods of rectilinear motion where the particle will have a large velocity parallel to a coordinate axis. Furthermore, large bursts may take the particle outside the search space. Although this will not incur any penalty in lost function evaluations if particles that exit the feasible bounds of the problem are not evaluated, as is the common approach to this situation, they are not contributing to the search while in outer space. PSO-DR, which is predicted not to have bursts [2], therefore provides a salient comparison.
3. Simplifying Recombinant PSO
This section details the two new recombinant models that are being proposed in this paper. To begin, an investigation into PSO-DR reveals more interesting properties of the formulation. Performance plots for a sweep through parameter space to find an optimal balance between the inertia weight coefficient w and the ϕ coefficients show that while the optimal region is spread across the parameter space, it also intersects the axis for the w term (see Figure 1 for results on selected functions from Table 1). This demonstrates that the system is able to obtain good optimal results even at w = 0.0 and there is no inertia term in the velocity update equations.
| Equation |
|---|
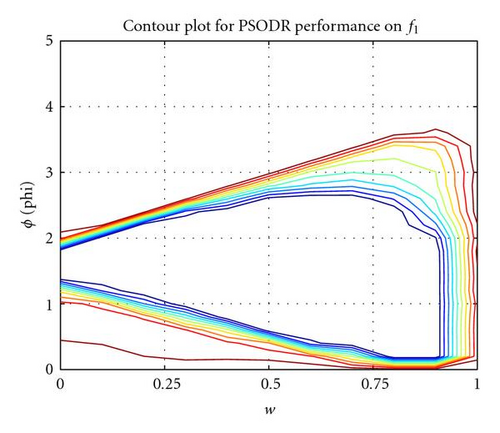
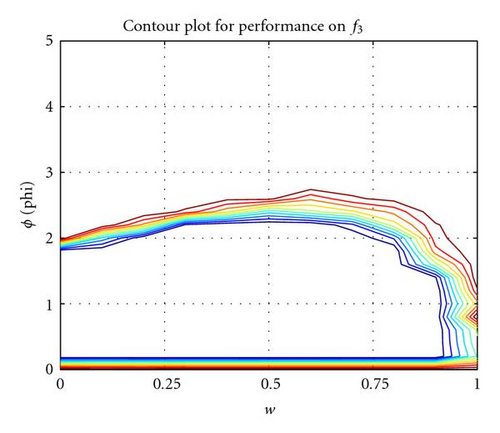
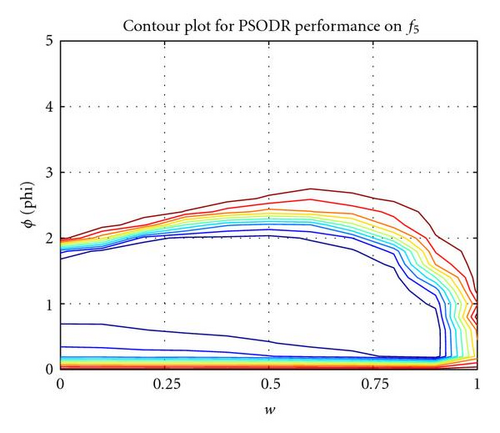
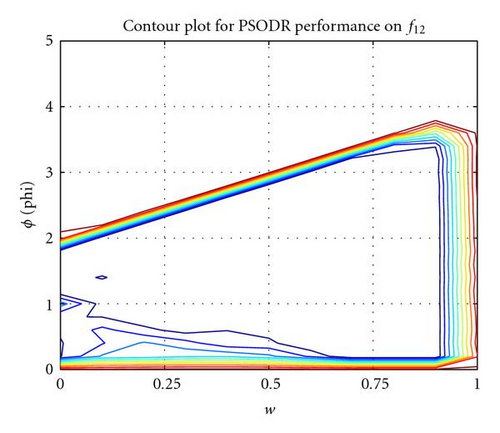
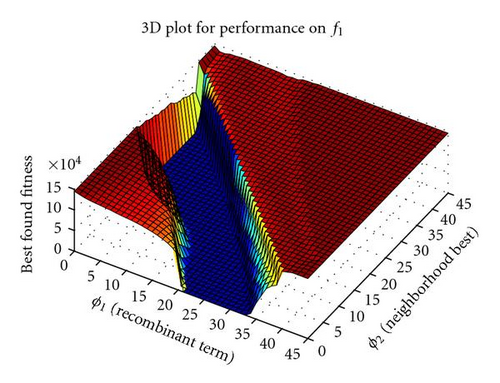
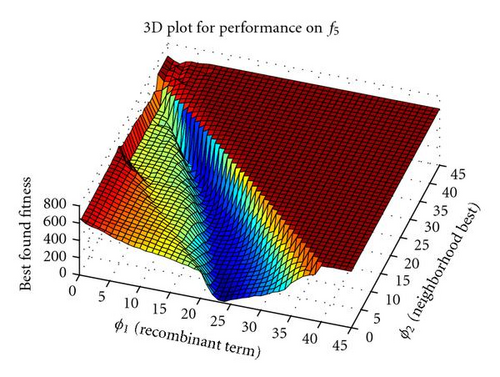
At this point, the two ϕ terms were detached and another sweep through parameter space to find an optimal combination of the recombinant component via its coefficient ϕ1 and the neighborhood best component via its coefficient ϕ2 was performed. Surprisingly, results again showed that the optimal region intersects an axis, this time for the neighborhood term (see Figure 2 for selected results).
The following section presents evidence that PSO-DR3 is a viable alternative to standard PSO by reporting on performance results for all three models of PSO-DR over a number of commonly used test functions.
4. Performance Experiments
Algorithms were tested over a series of 14 benchmark functions chosen for their variety, shown in Tables 1 and 2. Functions f1 − f3 are unimodal functions with a single minimum, f4 − f9 are complex high-dimensional multimodal problems, each containing many local minima and a single global optimum, and f10 − f14 are lower-dimensional multimodal problems with few local minima and a single global optimum apart from f10, which is symmetric about the origin with two global optima.
| Function | Name | D | Feasible bounds |
|---|---|---|---|
| f1 | Sphere/parabola | 30 | (−100,100)D |
| f2 | Schwefel 1.2 | 30 | (−100,100)D |
| f3 | Generalized Rosenbrock | 30 | (−30,30)D |
| f4 | Generalized Schwefel 2.6 | 30 | (−500,500)D |
| f5 | Generalized Rastrigin | 30 | (−5.12,5.12)D |
| f6 | Ackley | 30 | (−32,32)D |
| f7 | Generalized Griewank | 30 | (−600,600)D |
| f8 | Penalized function P8 | 30 | (−50,50)D |
| f9 | Penalized function P16 | 30 | (−50,50)D |
| f10 | Six-hump camel-back | 2 | (−5,5)D |
| f11 | Goldstein-price | 2 | (−2,2)D |
| f12 | Shekel 5 | 4 | (0,10)D |
| f13 | Shekel 7 | 4 | (0,10)D |
| f14 | Shekel 10 | 4 | (0,10)D |
Particles were initialized using the region scaling technique where initialization takes place in an area of the search space known not to contain the global optimum [8]. To avoid initializing the entire swarm directly within a local minimum, as could be possible with f12 − f14 if initialization takes place in the bottom quarter of the search space in each dimension (as is common), an area of initialization composed of the randomly chosen top or bottom quarter of each dimension was defined, into which all particles were placed with uniform distribution. This method ensures that the swarm will not be initialized within the same area for every optimization run, but will still be confined to an area at most 0.25D of the search space, making the chance of initialization directly on or near the global optimum extremely unlikely. In instances where the global optimum was located at the center of the search space (i.e., f1,f2,f5 − f7), the function was shifted by a random vector with maximum magnitude of a tenth of the size of the search space in each dimension for each run to remove any chance of a centrist bias [9].
Results shown for PSO-DR model 2 use the value ϕ≈ 1.6, while those for PSO-DR model 3 use ϕ ≈ 1.2. These values were empirically determined to be optimal for these algorithms; an analytical determination is the subject of current research. Results for both models 2 and 3 are shown for runs using a ring topology, which showed superior performance in testing.
| SPSO | SPSO | PSO-DR | PSO-DR | PSO-DR | PSO-DR | |
|---|---|---|---|---|---|---|
| Ring | Global | M1 Ring | M1 Global | M2 | M3 | |
| f1 | 0.0 ± 0.0 | 0.0 ± 0.0 | 0.0 ± 0.0 | 0.0 ± 0.0 | 0.0 ± 0.0 | 0.0 ± 0.0 |
| 97063±377 | 46897±421 | 59322±125 | 33290±170 | 60063±41 | 75810±322 | |
| f2 | 0.12±0.01 | 0.0 ± 0.0 | 0.01±0.002 | 0.0 ± 0.0 | 3.7E-7±7.5E-8 | 5.14±1.27 |
| — | 297800±928 | — | 168852±1205 | — | — | |
| f3 | 6.18±1.07 | 8.37 ±2.26 | 16.79±0.49 | 0.80±0.29 | 34.57±5.46 | 18.64±4.45 |
| — | — | — | — | — | — | |
| f4 | 3385±40 | 3522±32 | 2697±36 | 3754±48 | 2418±27 | 1830±46 |
| — | — | — | — | — | — | |
| f5 | 163.50±5.64 | 140.16 ±5.87 | 44.64±2.71 | 115.51±7.03 | 35.21±2.13 | 9.88±0.86 |
| — | — | — | — | — | — | |
| f6 | 18.28±0.85 | 12.93±1.59 | 0.68±0.67 | 18.51±0.90 | 0.0 ± 0.0 | 0.0 ± 0.0 |
| — | — | — | — | 287220±2105 | 248160±1945 | |
| f7 | 0.0 ± 0.0 | 0.019±0.004 | 0.0 ± 0.0 | 0.008±0.002 | 0.0 ± 0.0 | 0.0 ± 0.0 |
| 110616±3320 | — | 101526±9227 | — | 81226±6560 | 70348±2954 | |
| f8 | 0.004±0.003 | 0.15±0.05 | 0.0 ± 0.0 | 0.05±0.02 | 0.0 ± 0.0 | 0.0 ± 0.0 |
| — | — | 61370±249 | — | 85101±581 | 95810±655 | |
| f9 | 0.0 ± 0.0 | 0.003±0.001 | 0.0 ± 0.0 | 0.002±0.0007 | 0.0 ± 0.0 | 0.0 ± 0.0 |
| 106163±537 | — | 61793±221 | — | 86031±377 | 92416±437 | |
| f10 | 0.0 ± 0.0 | 0.0 ± 0.0 | 0.0 ± 0.0 | 0.0 ± 0.0 | 0.0 ± 0.0 | 0.0 ± 0.0 |
| 9348±190 | 11808±445 | 44577±7608 | 40015±4483 | 6103±104 | 5918±75 | |
| f11 | 0.0 ± 0.0 | 0.0 ± 0.0 | 0.0 ± 0.0 | 0.0 ± 0.0 | 0.0 ± 0.0 | 0.0 ± 0.0 |
| 8258±104 | 7080±108 | 4772±47 | 3968±27 | 6720±66 | 6846±87 | |
| f12 | 0.59±0.33 | 4.61±0.54 | 0.17±0.17 | 4.34±0.59 | 0.0 ± 0.0 | 0.0 ± 0.0 |
| — | — | — | — | 59958±43 | 16229±855 | |
| f13 | 1.09±0.45 | 4.40±0.60 | 0.0 ± 0.0 | 2.55±0.62 | 8.1E-11±1.8E-11 | 0.0 ± 0.0 |
| — | — | 13433±249 | — | — | 14012±764 | |
| f14 | 0.96±0.45 | 3.24±0.66 | 0.0 ± 0.0 | 3.13±0.66 | 6.6E-11±1.7E-11 | 0.0 ± 0.0 |
| — | — | 12760±1386 | — | — | 121031004± | |
Results for these statistical tests on PSO-DR model 3 and SPSO are shown in Table 4 and confirm that the performance is significantly improved on 3 of the 14 tested functions, equivalent for 10 functions, and worsened for 1 function for PSO-DR model 3 versus SPSO with ring topology. Perhaps the most impressive improvement comes for f5 (Rastrigin), a notoriously difficult multimodal problem that PSO algorithms perform poorly on some problems in high dimensionality.
| Function | p-value | Inverse rank | α′ | Significant |
|---|---|---|---|---|
| f4 | 0 | 14 | 0.003 571 | Yes |
| f5 | 0 | 13 | 0.003 846 | Yes |
| f6 | 0 | 12 | 0.004 167 | Yes |
| f2 | 2.11e-11 | 10 | 0.005 | Yes |
| f3 | 0.0086 | 11 | 0.004 545 | No |
| f13 | 0.02 | 9 | 0.005 556 | No |
| f14 | 0.04 | 8 | 0.00 625 | No |
| f12 | 0.2663 | 6 | 0.08 | No |
| f8 | 0.3215 | 7 | 0.007 143 | No |
| f1 | 1 | 5 | 0.01 | No |
| f7 | 1 | 4 | 0.0125 | No |
| f9 | 1 | 3 | 0.016 667 | No |
| f10 | 1 | 2 | 0.025 | No |
| f11 | 1 | 1 | 0.05 | No |
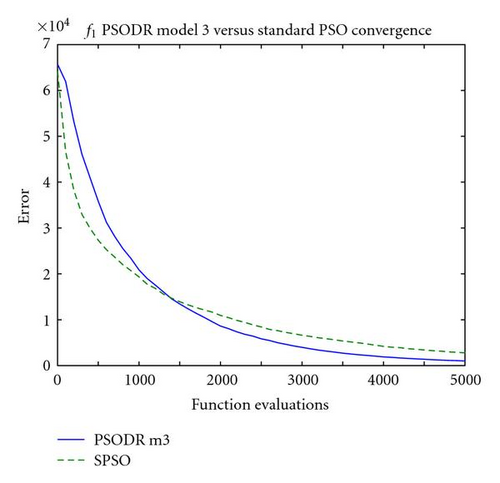
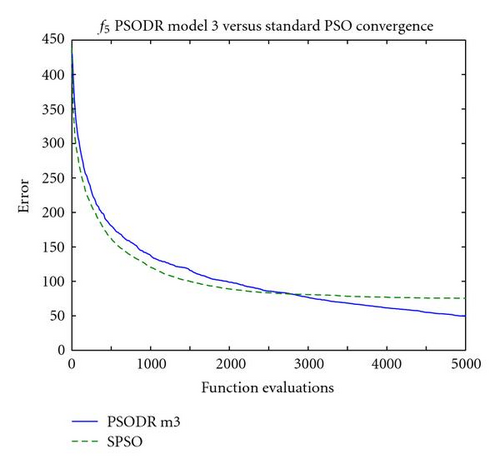
Due to the high number of function evaluations that were performed to obtain these results relative to previous work (where only 30 k–60 k function evaluations might be performed), selected convergence plots are shown in Figure 3. These show that the standard PSO obtains superior results at the very start of the optimization process, up to 5000 function evaluations for the highest observed value (Figure 3(b)). After the point at which this occurs, PSO-DR model 3 surpasses the standard algorithm in performance, and maintains this advantage to the end of the 300 k function evaluations on 7 of the 14 tested problems (f4 − f6,f8,f12 − f14). On problems for which both algorithms attained equal error levels of 0.0 (f1,f7,f9 − f11), the point at which this occurs, that is, when SPSO “catches up" to PSO-DR model 3, can be observed in Table 3. On average, SPSO took 25% more function evaluations to attain the optimum than PSO-DR model 3 on these problems. Finally, for the two problems on which SPSO outperformed PSO-DR model 3 (f2,f3), the same early performance is seen with PSO-DR model 3 surpassing SPSO in performance early in the optimization process; in these cases, SPSO eventually repasses the other algorithm by 50 k function evaluations.
A potential explanation for this behavior lies in the diversity of the swarms at this point in the optimization process. Figure 4 shows the mean Euclidean distance between particles for the corresponding convergence plots of Figure 3. It should be noted that uniform initialization was used in the trials used to generate these plots; relative performance between the algorithms was unaffected, and initializing particle positions uniformly throughout the search space removes an unrelated phenomenon in subspace initialization wherein the swarm expands greatly beyond the relatively small initialization region at the start of the optimization process to explore the search space. Expansion is common in the first few iterations using uniform initialization as well, but this is inherent to the swarm behavior and influenced only by the size of the entire search space.
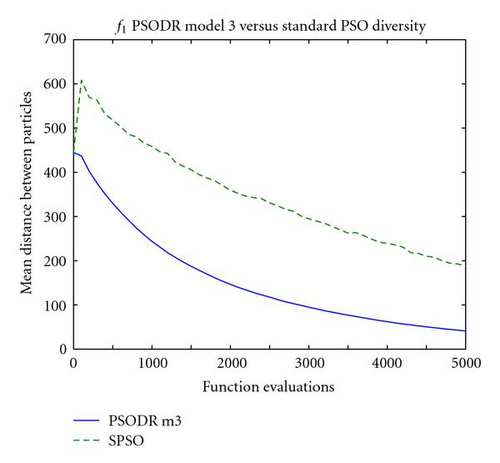
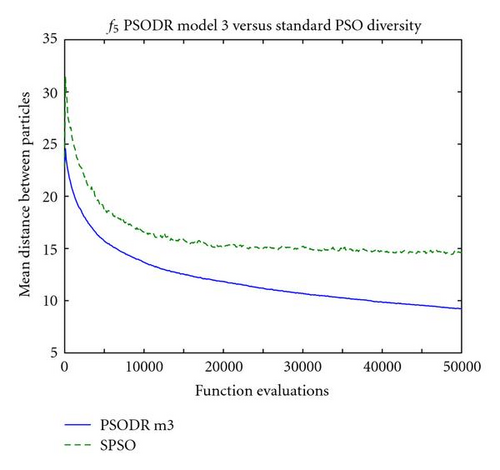
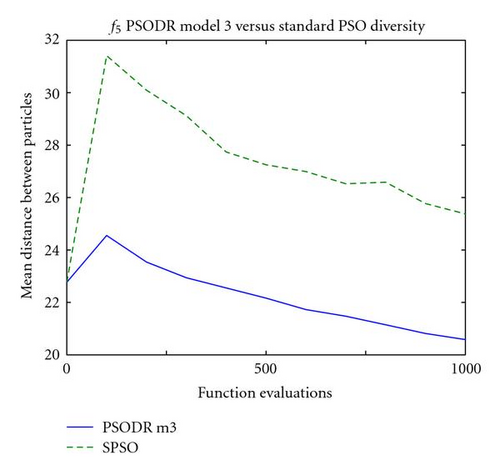
As can be seen in the plots of Figure 4, neither swarm type begins converging immediately following initialization but rather they maintain their diversity or expand slightly. On a comparative basis, the standard PSO swarm expands substantially more than the PSO-DR model 3 swarm; for example Figure 4(c) shows that after the first 100 function evaluations, the mean distance between particles in the standard PSO swarm increases from 23 to 31.5, while the PSO-DR swarm diversity increases only from 23 to 24.5. Similar disparities were observed for all other tested problems.
It is reasonable to gather from these results that the higher swarm diversity for the standard PSO algorithm early in the optimization process demonstrates a wider spread of particle dispersion, and hence an improved probability of finding and starting to explore the basin of attraction for global or good local optima. PSO-DR model 3 expands very little, if at all, early in the optimization process, resulting in delayed acquisition of optimal regions of the search space.
5. Examination of Bursting
Bursts in the velocities of particles are commonly observed using the standard PSO algorithm. These are generated by means of the multiplicative stochasticity of the algorithm [2]. In order to investigate bursting behavior in PSO-DR and SPSO an empirical measure was devised.
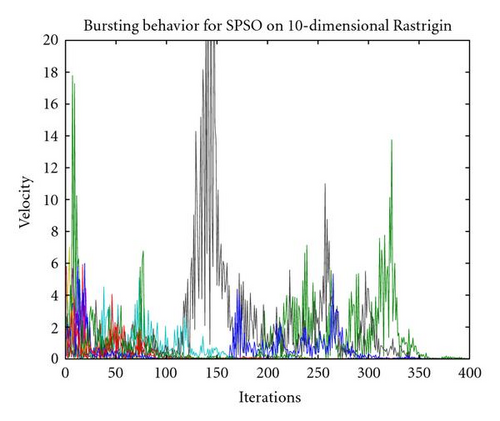
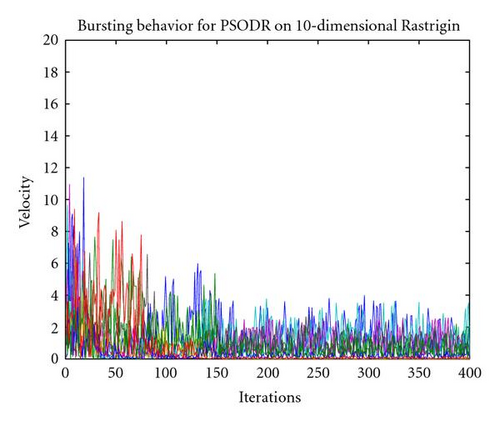
This bursting measure was implemented to highlight when a particle had a velocity in a single dimension that was considerably higher than the next highest dimensional velocity. Bursting patterns of behavior were detected by reporting that every time particle velocity in a single dimension was a set amount λ times higher than velocity in the next highest dimension. Bursting behavior is demonstrated in Figure 6, where the velocity of a single particle in a 10-dimensional problem is shown. On the plot of the multidimensional velocity of the SPSO particle, it can be seen that velocity in a single dimension increases suddenly and dramatically while remaining relatively level and low in all other dimensions. This is an example of a velocity burst. While the figure shows velocity for a single particle on a single run, examination of velocity plots for hundreds of particles over dozens of runs confirmed this to be representative of general particle behavior.
Velocity for a PSO-DR particle is also shown in Figure 6, and demonstrates the absence of bursts. Similarly to the SPSO plot, examination of a large number of plots confirmed this to be representative of general behavior for PSO-DR.
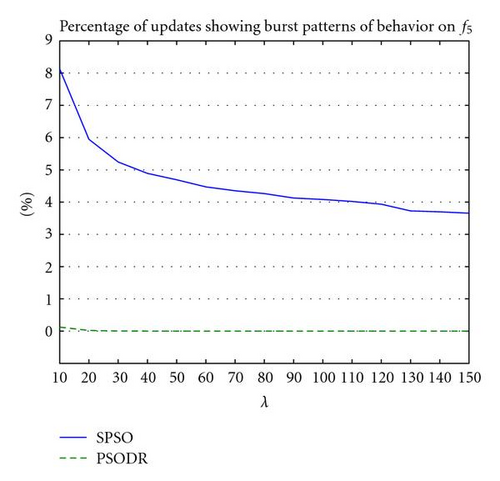
Examination of these empirical analyses show that PSO-DR clearly does not contain bursting behavior on the scale of SPSO while demonstrating equal or superior performance on 13 of the 14 benchmark functions, leading to the hypothesis that bursts are not, in fact, integral to the successful operation of particle swarm algorithms. The fact that a very few bursts do occur with PSO-DR indicates that it is a highly improbable feature of DR dynamics.
Analysis performed on statistics of several functions shows that particle updates involving bursts are far less effective than more common nonbursting updates. For example, results showed that for SPSO on f5 with λ = 100, on average 20.1% of all particle, updates involve an improvement to the particle′s best found position pi, whereas only 1.8% of updates involving bursts result in an improvement to pi. Likewise, on average 0.9% of all particle, updates improve the best found swarm position g, as opposed to only 0.01% for bursting particles. Burst frequencies for values of λ from 10 to 150 are shown in Figure 5.
It is also interesting to note that far fewer total updates result in an improved pi or g for PSO-DR when compared to SPSO, for example, results showed that 20.1% of all updates improve pi for SPSO compared with 0.64% for PSO-DR, and 0.91% improve g for SPSO compared with 0.02% for PSO-DR on f5 for λ = 100.
6. Conclusions
Simplification of the standard PSO algorithm is an important step toward understanding how and why it is an effective optimizer. By removing components of the algorithm and seeing how this affects performance, we are granted insight into what those components contribute to overall particle and swarm behaviors.
There is still much to be done before questions concerning PSO behavior can be completely answered, and it is expected that the next decade of PSO research will be focused on understanding the basic algorithm that powers both the standard implementation and its variants.
In that light, the PSO-DR variant is important not only because of its improved performance on several benchmark functions, but also because its simplified state allows us to examine what happens to the standard algorithm when pieces are modified or removed. Based on the results presented here, it can be argued that large bursts are not generally beneficial or integral to PSO performance, and may possibly be detrimental. Although the presence of particle outliers is demonstrably important for swarm optimization (as demonstrated in bare bones analysis, [6]), bursts, which are sequences of extreme particle positions, occurring along an axis and reaching outside the search space, remain a special feature of velocity-based swarms. This work, which compares standard PSO to a burst-free but comparable optimizer suggests that bursts are disadvantageous in general. (However, in the coincidence that the objective function has a rectangular symmetry aligned with the axes, then bursting may actually be fortuitous.)
Further, the replacement of the direct personal influence operator pi from SPSO with the recombinant term ri derived from its neighborhood in PSO-DR strengthens the case for PSO being mostly reliant on social interaction as opposed to personal experience. This is further supported by the effectiveness of PSO-DR model 3, which lacks a cognitive term altogether. The social behavior occurring inside of a swarm is still a wide-open area in the field, and will hopefully constitute a great deal of the future research devoted to the development of a better understanding of this deceptively simple optimizer.
Another property of PSO-DR resides in attractor jiggling that takes place even at stagnation (no updates to any pi) since ri is never fixed. This jiggling will work against convergence and could propel the swarm onwards. This, and other matters concerning the nature of recombination within PSO, will be the subject of further study.
Acknowledgments
The authors would like to acknowledge the support of EPSRC XPS Project (GR/T11234/01). The authors also wish to thank Jim Kennedy for advice and references.


