QUANTITATIVE PLANAR AND VOLUMETRIC CARDIAC MEASUREMENTS USING 64 MDCT AND 3T MRI VS. STANDARD 2D AND M-MODE ECHOCARDIOGRAPHY: DOES ANESTHETIC PROTOCOL MATTER?
Funding sources: The project was supported by the Clinical and Translational Science Award (CTSA) program, previously through the National Center for Research Resources (NCRR) grant 1UL1RR025011, and now by the NIH National Center for Advancing Translational Sciences (NCATS), grant 9U54TR000021 and Dr. Johnson was supported by the Clinical and Translational Science Award (CTSA) program, through the NIH National Center for Advancing Translational Sciences (NCATS), grant UL1TR000427.
Portions of this study were given as oral presentations for the EVDI conference 2013 in Portugal (volumetric variables) and ACVR conference 2013 in Savannah, GA, USA (planar variables).
Abstract
Cross-sectional imaging of the heart utilizing computed tomography and magnetic resonance imaging (MRI) has been shown to be superior for the evaluation of cardiac morphology and systolic function in humans compared to echocardiography. The purpose of this prospective study was to test the effects of two different anesthetic protocols on cardiac measurements in 10 healthy beagle dogs using 64-multidetector row computed tomographic angiography (64-MDCTA), 3T magnetic resonance (MRI) and standard awake echocardiography. Both anesthetic protocols used propofol for induction and isoflourane for anesthetic maintenance. In addition, protocol A used midazolam/fentanyl and protocol B used dexmedetomedine as premedication and constant rate infusion during the procedure. Significant elevations in systolic and mean blood pressure were present when using protocol B. There was overall good agreement between the variables of cardiac size and systolic function generated from the MDCTA and MRI exams and no significant difference was found when comparing the variables acquired using either anesthetic protocol within each modality. Systolic function variables generated using 64-MDCTA and 3T MRI were only able to predict the left ventricular end diastolic volume as measured during awake echocardiogram when using protocol B and 64-MDCTA. For all other systolic function variables, prediction of awake echocardiographic results was not possible (P = 1). Planar variables acquired using MDCTA or MRI did not allow prediction of the corresponding measurements generated using echocardiography in the awake patients (P = 1). Future studies are needed to validate this approach in a more varied population and clinically affected dogs.
Introduction
In companion animals, the evaluation of cardiac morphology and systolic function has mainly been based on echocardiographic evaluation and cardiac catheterization.1-6 The potential role of magnetic resonance imaging (MRI) in the future of veterinary clinical cardiology has been reviewed critically24 and recent publications have utilized MRI and/or MDCT for functional and morphological cardiac evaluations.15, 23, 25-29 Cross-sectional imaging of the heart utilizing computed tomography (CT) and MRI has been shown to be superior for the evaluation of cardiac morphology and systolic function in humans compared to echocardiography.7-14 Apart from case reports describing congenital or neoplastic morphological abnormalities involving the heart or great vessels in companion animals,15-22 these modalities have rarely been compared for their use in evaluation of cardiac function.23-29 While these cross-sectional exams are generally performed in the awake human patient,30 companion animal patients require anesthesia or heavy sedation at a minimum to undergo these studies. Although different anesthetic protocols have been used,23, 25, 27-29, 31 the effects of specific anesthetic protocols on image quality, systolic function, and cardiac morphologic variables as determined by cross-sectional imaging have not been systematically evaluated. Furthermore, to optimize image quality, a target heart rate of <65 bpm is recommended for multidetector row computed tomographic angiography (MDCTA) in people.32 The canine heart rate varies with many factors, including choice of anesthetic/sedative agents as well as body weight; however, rates between 80 and 150 are commonly seen in awake patients.33
The primary goal of this study was to analyze variables of cardiac morphology and systolic function using 64-MDCTA and MRI at 3 Tesla by comparing two anesthetic protocols for heart rate control and impact on cardiac function in 10 healthy dogs. The secondary goal was to compare the variables of cardiac size and systolic function generated by MDCTA to MRI and to relate those to the current clinical practice of echocardiography in the awake dog. The results were intended to provide baseline recommendations for further cardiac investigations using MDCTA and MRI in dogs. The hypothesis for this study was that parameters acquired using CT and MRI with either anesthetic protocol would be comparable but differ from parameters acquired using echocardiography on the awake dogs.
Material and Methods
Animal Preparation
The University of Wisconsin's Institutional Animal Care and Use Committee approved all procedures. Ten purpose-bred healthy beagle dogs with a mean age of 10.4 (range 7–20) months and mean body weight of 10.7 (range 8.9–12.7) kg were used in this study and underwent awake echocardiography once and then retrospectively EKG-gated MDCTA and MRI under anesthesia on two different days, using a different anesthetic protocol for each of the two anesthetic episodes. The order of MDCTA and MRI was randomized as well as the order of the anesthetic protocols for heart rate regulation for each dog.
A 20G intravenous catheter was placed in the both the right and left cephalic veins; the left was used for anesthesia purposes and the right for contrast administration in all dogs. Anesthetic monitoring included modality specific recording of electrocardiography (using the footpads for the CT exam and the chest for the MRI exam for electrode placement) as well as pulse-oximetry to monitor heart rate, rhythm, and hemoglobin saturation; systolic, diastolic, and mean blood pressure were noninvasively monitored with a cardiac monitor (Cardell® Veterinary Monitor, Model 9401, CAS Medical Systems, Branford, CT, 06405). Short periods of apnea were induced by mild hyperventilation and halting the mechanical ventilator when needed during image acquisition.
Echocardiography
Standard awake auscultation and echocardiographic exam (Vivid 7, GE Health Care, Waukashea, WI, 8 and 5 MHz transducers) was performed by a board-certified veterinary cardiologist (R.L.S.) once, prior to the anesthetic episodes for cross-sectional imaging. The following variables were recorded using M-mode: diastolic and systolic interventricular septal thickness (IVSd, IVSs), left ventricular internal diameter (LVIDd, LIVDs), and left ventricular posterior wall thickness (LVPWd, LVPWs). Additionally, standard single plane 2D B-mode images were used to acquire measurements of the aortic, left atrial and main pulmonary arterial diameter; left atrium to aorta ratio (LA/Ao ratio) and aorta to pulmonary artery (Ao/PA ratio) were calculated from those measurements. Fractional shortening (FS%) was calculated using the following formula: FS = (LVIDd − LVIDs)/LVIDd × 100. End diastolic volume (EDV), end systolic volume (ESV), ejection fraction (EF), and stroke volume (SV) were calculated using the Simpson method.34 Left ventricular mass was calculated from M-mode measurements using the following formula: LVM = 1.04 × ([LVIDd + LVWd + IVSd]3 − [LVIDd]3) − 13.6 g2.
Anesthesia Protocols
All dogs were induced using a propofol bolus to effect (2–6 mg/kg) for each of the two cross-sectional imaging events. The animals were orally intubated, placed in dorsal recumbency in a custom made trough for positioning in CT and MRI and maintained on isoflurane (Vaporizer set at 1–2%) and 100% oxygen using mechanical ventilation to an end-tidal CO2 level between 35 and 40 mmHg. The dogs also received maintenance intravenous Lactated Ringer's Solution (5–10 ml/kg/h; Abbott Laboratories, North Chicago, IL) through the left cephalic catheter. Protocol A used fentanyl (Fentanyl Citrate, West-ward, Eatontown, NJ) 5 μg/kg bolus for premedication followed by 10 μg/kg/h continuous rate infusion (CRI) and midazolam (Midazolam, Hospira, Inc., Lake Forest, IL) 0.2 mg/kg bolus followed by 0.2 mg/kg/h CRI. Protocol B used dexmedetomedine (Dexdomitor, Pfizer Animal Health, New York, New York) 1–2 μg/kg bolus for premedication and 1–2 μg/kg/h CRI.
Cardiac MDCTA
Cardiac exams were performed using a 64-MDCT unit (Discovery CT750 HD, General Electrics Medical Systems, Waukesha, WI). A transverse plane helical exam of the thorax was performed using 1.25 mm slice thickness and reconstruction interval, medium frequency reconstruction kernel, 80 kVp, 200 mA, 0.35 s tube rotation time and a pitch of 0.51, followed by acquisition of a localizer image over the right ventricular outflow tract and the aortic root. Using the semiautomated bolus tracking function a retrospectively EKG-gated cardiac MDCTA was performed using 15 ml iodinated contrast medium (Omnipaque 300, NovaPlus GE Healthcare, Princeton, NJ) followed by a 5 ml saline flush administered from a dual-barrel injector at 2 ml/s and 325 PSI. Contrast injection was timed to mainly opacify the left atrium, left ventricle, coronary arteries, and thoracic aorta. Scan parameters used for the retrospectively gated scan were set to 1.25 mm slice thickness, 0.625 mm spacing between slices, medium frequency reconstruction algorithm, display field of view 12 cm centered over the heart, 80 kVp, 400 mA, 0.35 s tube rotation time, and helical pitch of 0.24.
Cardiac MRI
The exams were performed using a 3 Tesla MRI unit (Discovery MR750, GE Healthcare, Waukesha, WI) using a 32-channel upper torso coil. Insulated EKG leads were placed on the chest wall, as placement of EKG leads on the footpads using noninsulated cables did not produce an EKG trace when the dogs were advanced into the magnet. Localizer scans were acquired in three planes. Then the following sequences were acquired: EKG-gated cine transverse plane, approximate three chamber, approximate four chamber, short axis cine balanced steady-state free precession (SSFP; time to repetition [TR] 3.3–4.1 ms, TE 45 ms, 45° flip angle, 224 × 224 matrix, FOV 230–310 × 184–207 mm, pPOV 0.6–0.8, VPS 12–18, ETL 1, NEX 1, BW 125, 6 mm slice thickness).
After the last cross-sectional imaging modality per day was completed, the animals were recovered; after the last episode, the dogs were humanely euthanized according to institutional protocol requirements.
Image Analysis
Evaluation of the MDCTA and MRI studies was performed using semiautomated software (OsiriX 5.6 64-bit35 and ReportCARDTM 4.4.6, GE Healthcare, respectively) by a board-certified veterinary radiologist (R.D.) under guidance of a human radiologist specialized in cardiovascular imaging (C.J.F.). The exams were randomized for evaluation and the reviewer was blinded to the anesthetic protocol used for each study. Short axis, approximate three- and four-chamber views of the MDCTA images were generated at 1.25 mm slice thickness using open source software35 to mirror the plane alignment generated in the MRI exams. All studies were inspected for diagnostic image quality to apply measurements by evaluating for adequate contrast, border definition, and presence or absence of artifacts.
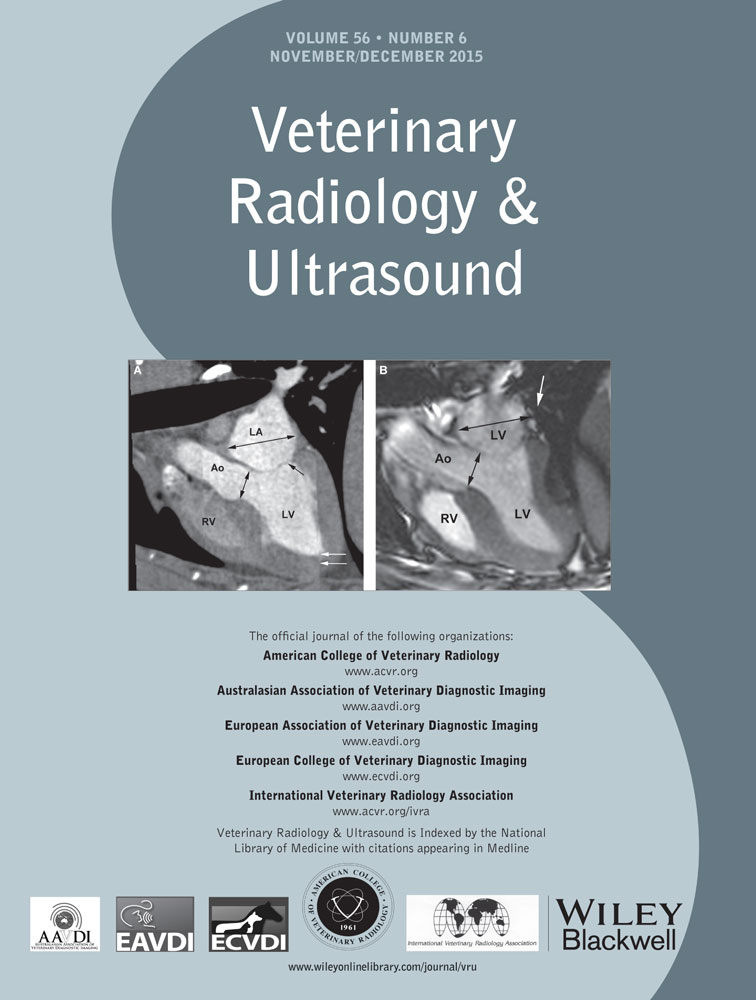
Using the short axis planes, regions of interest were semiautomatically drawn along the endocardial and epicardial border on all images including the left ventricle from the apex to the level of the annulus; where slices with greater than 25% of annulus in the imaging plane marked the basal border of the ventricle included in the evaluation. The papillary muscles were included in the ventricular volume for consistency (Fig. 1). Using the transverse plane images, semiautomated regions of interest were also placed along the endocardial borders of the right ventricle, where the tricuspid and pulmonic annulus marked the borders of the ventricular volume included, also here the papillary muscles were included with the ventricular volume for consistency (Fig. 2). This method was used to generate the following volumetric variables from the MDCTA and MRI exams, respectively, using the Simpson method36: Left ventricular end diastolic and end systolic volume (LVEDV and LVESV); left ventricular end diastolic and end systolic epicardial volume (epiEDV and epiESV). Left ventricular stroke volume (LVSV = LVEDV – LVESV) and left ventricular ejection fraction (LVEF = LVSV/LVEDV) were calculated from these measurements. To verify alignment of the regions of interest drawn only 10% variability between the measurements for left ventricular end diastolic and end systolic myocardial mass (LVmassD and LVmassS) was allowed per dog within the same and between anesthetic episodes. Right ventricular end diastolic volume (RVEDV) and right ventricular end systolic volume (RVESV) were recorded; right ventricular stroke volume (RVSV = RVEDV − RVESV) and right ventricular ejection fraction (RVEF = RVSV/RVESV) were calculated from these measurements.


The following planar measurements were obtained: systolic and diastolic interventricular septal wall thickness (IVSs, IVSd) and left ventricular posterior wall thickness (LVPWs, LVPWd); left ventricular internal diameter (LVIDs, LVIDd), mitral and aortic annulus diameter, proximal aortic, proximal pulmonary artery and left atrial diameter.
The short axis view, corresponding to the right parasternal short axis view used in echocardiography, was used to measure the systolic and diastolic interventricular septal wall and left ventricular posterior wall thickness as well as the internal diameter of the left ventricle (Fig. 3).

Fractional shortening (FS%) was calculated from these values (FS = [LVIDd − LVIDs])/LVIDd × 100).
The approximate three-chamber view, corresponding to the parasternal long axis view used in echocardiography, was used to measure the end systolic left atrial diameter and aortic annulus diameter just prior to opening of the mitral valves and while the aortic valves were open as well as end diastolic mitral annulus diameter while the mitral valves were open (Figs. 4 and 5). The left atrium/aorta ratio (La/Ao ratio) was calculated from these values (La/Ao = left atrial diameter/aortic annulus diameter). The approximate four-chamber view, corresponding to the left apical four-chamber view as used in echocardiography, was used for a repeat measurement of the mitral annulus (Fig. 6). The transverse plane views, similar to the right parasternal short axis views in echocardiography, were used to measure the diameter of the proximal aorta and the main pulmonary artery (Fig. 7). The aorta/pulmonary artery ratio (Ao/Pa ratio) was calculated from these measurements (Ao/Pa = base of the aorta diameter/main pulmonary artery diameter).


Statistical Analysis
Open source software was used for statistical evaluation.37 For all variables evaluated, summary statistics (quartiles, mean, standard deviation, minimum and maximum) were computed by one observer (A.M.R.). Medians and extremes were recorded.
To establish baseline comparison of the two anesthetic protocols within each imaging modality (i.e., MDCTA and MRI), the data were compared with a paired Wilcoxon signed rank test. Significance was set at P ≤ 0.05. One test was done for MDCTA values and another for the MRI values. Within each type of measurement (i.e., individual variables to compare), the P-values were adjusted with a Holm–Bonferroni step-down procedure.38
To characterize the typical discrepancy between MDCTA and MRI when measuring the same cardiac attribute, Bland–Altman 95% limits of agreement analysis was used; bias (average difference), lower (LLOA) and upper level of agreement (ULOA) are reported. As both anesthesia protocols were pooled, possible correlation arising from the repeated measures needed to be allowed for, since each dog contributed two observations.39
Lastly, the results for the left ventricular systolic function and planar variables generated using the cross-sectional modalities with each anesthetic protocol were compared to the comparable variables acquired using echocardiography using the Friedman rank sum test, pairwise comparisons were then generated using the Wilcoxon signed rank test. A simple linear regression was used to determine whether any of the anesthesia-by-imaging modality combinations could predict the values observed with echocardiography when the dogs were awake. The Holm–Bonferroni step-down procedure was used to adjust the P-values for the significance of the slope variable.38
Results
On awake auscultation, 2/10 dogs had an irregular cardiac rhythm and no murmurs were auscultated in any dog at an average heart rate of 115 ± 19 bpm. One dog had a marked respiratory sinus arrhythmia during echocardiography; the remaining nine dogs had a normal sinus rhythm. Echocardiographic examination showed a trivial amount of mitral regurgitation in one dogs and trace tricuspid insufficiency in one dog. Two dogs showed very mild left ventricular enlargement with normal function. Overall, no hemodynamically significant abnormalities were noted in any of the 10 dogs.
Both anesthetic protocols provided adequate anesthesia of all dogs and recovery was uneventful in all cases. The median (minimum-maximum) heart rate with protocol A was 81.6 (68.6–96.0) bpm and 76.8 (66–98.6) bpm (P = 1) during the MDCTA and MRI exams, respectively. Using protocol B, the median heart rate was 73.3 (62.7–102.6) bpm and 71 (64.4–118.8) bpm (P = 1) during the MDCTA and MRI exams, respectively. In one dog, the target heart rate of <65 bpm was consistently achieved using protocol B. Vital variables recorded during the CT and MRI exams using protocols A and B are summarized in detail in Table 1. Comparing protocols A and B, diastolic and mean blood pressure were significantly higher (P = 0.033 and P = 0.012) and systolic blood pressure was marginally higher (P = 0.052) using protocol B. There was no significant difference found between the remaining recorded physiological values using either protocol (systolic blood pressure P = 0.052, CO2 P = 0.075; Table 1). One dog experienced slight tachycardia immediately following CT contrast medium administration but the heart rate spontaneously returned to precontrast levels within 10 min of administration. On average, the duration of the MDCTA exam including setup of the dogs, acquisition of localizer images, precontrast exam, and retrospectively gated cardiac exam was 9.31 ± 0.17 min; the duration of the retrospectively gated angiography itself lasted an average of 5.0 ± 0.68 s. Average duration of the MRI exam including patient positioning, setup of anesthetic and gating equipment, acquisition of localizer images and the cardiac exam lasted for 51.0 ± 3.26 min. In the first study dog, delays were encountered, mainly due to difficulties in obtaining an accurate EKG signal, which was remedied by switching to a different, insulated, EKG cable. Thus, this time was not accounted for in calculation of the average duration. The acquisition of the four plane steady-state free precession sequences only took 19.21 ± 7.58 min.
| Protocol A | Protocol B | |
|---|---|---|
| Median | Median | |
| (minimum- | (minimum- | |
| maximum) | maximum) | |
| CT | ||
| Heart rate (bpm) | 81.6 | 73.3 |
| (68.6–96) | (62.7–102.6) | |
| Mean blood pressure (mmHg) | 65.0 | 65.3 |
| (48.8–74.0) | (57–102.8)* | |
| Systolic arterial pressure (mmHg) | 92.5 | 92.7 |
| (74.3–100.4) | (81.0–129.8) | |
| Diastolic arterial pressure (mmHg) | 37.6 | 44.2 |
| (28.2–47.2) | (31.8–75.8)* | |
| CO2 (%) | 39.7 | 35.5 |
| (34.7–46.7) | (34.7–45.0) | |
| MRI | ||
| Heart rate (bpm) | 76.8 | 71 |
| (66–98.6) | (64.4–118.8) | |
| Mean blood pressure (mmHg) | 60.5 | 75.3 |
| (48.4–68.9) | (66.1–94.0) | |
| Systolic arterial pressure (mmHg) | 89.1 | 101.9 |
| (75.3–95.6) | (91.7–117.6) | |
| Diastolic arterial pressure (mmHg) | 36.2 | 51.9 |
| (29.2–43.4) | (30.9–72.5) | |
| CO2 (%) | 37.5 | 34.1 |
| (34.3–45.8). | (30.6–37.0) |
- *When comparing protocols A and B, there was significant difference for the mean (P = 0.012), diastolic arterial (P = 0.033), and marginal difference for the systolic arterial blood pressure (P = 0.052). For the remaining variables no difference was found (heart rate, CO2; P = 1).
The smart prep feature was used to manually trigger the angiographic exam when contrast medium was seen in the right ventricular outflow tract; the MDCT unit had an inherent additional delay of 5 s to start the diagnostic scan. All MDCTA and MRI exams resulted in studies of diagnostic image quality. Mild motion artifact was seen on the MDCTA studies during systole but did not influence the ability to apply measurements. This was mainly displayed as a mild shift between the acquisition segments during systole.
Volumetric measurements generated from the awake echocardiograms, MDCTA, and cardiac MRI using anesthetic protocols A and B are listed in Table 2. There were no significant differences for the evaluated volumetric variables between the two anesthetic protocols when comparing within the individual cross-sectional modalities (MDCTA and MRI, P > 0.05; Tables 2 and 3). Comparing the evaluated planar variables between the two anesthetic protocols within the individual cross-sectional modalities (MDCTA and MRI) using the paired Wilcoxon signed rank test, no significant differences were found for any of the variables; P = 0.292 for LVIDs using MRI and P = 1 for all other variables (Table 3). There was also no difference between the measurements repeated for the same variable on different imaging planes (P = 1). The anesthesia protocols were therefore combined for the following analysis. Evaluation of the difference for the volumetric variables generated from MDCTA and MRI while combining the measures for the two different anesthetic episodes per modality and individual as generated by the Bland–Altman analysis is given in Table 4. The graphical output is displayed in Fig. 8 for the left ventricular variables and Fig. 9 for the right ventricular variables. The bias resulting from the comparison between MDCTA and MRI when accounting for both measures of each individual per modality generated in the Bland–Altman analysis is given in Table 5; Figs. 10 and 11 show the left ventricular variables and selected further planar measurements, respectively, as graphical output. Finally, when determining if the left ventricular volumetric values generated using the cross-sectional modalities with anesthetic protocols A and B would be able to predict the comparable variables generated with echocardiography on the awake dog, significant agreement was found only for LVEDV using MDCTA and anesthetic protocol B (P = 0.01). All other modality and anesthesia combinations for LVEDV, LVESV, LVSV, LVEF did not agree (P > 0.05) and would not allow for prediction of measurements generated using echocardiography in the awake animal (Table 2, Fig. 12).
| MDCTA | MRI | ||||
|---|---|---|---|---|---|
| Protocol A | Protocol B | Protocol A | Protocol B | ||
| Modality | Echocardiography | Median | Median | Median | Median |
| Anesthetic protocol | Awake | (minimum-maximum) | (minimum-maximum) | (minimum-maximum) | (minimum-maximum) |
| LVEDV (ml) | 42.5 | 34.7 | 37.8 | 38.1 | 36.2 |
| (29.0–56.0)* | (26.9–41.1) | (26.6–43.2)† | (30.0–45.2) | (26.7–45.1) | |
| LVESV (ml) | 15.5 | 16.9 | 17.0 | 17.8 | 18.75 |
| (8.0–21.0)* | (8.8–25.2) | (14.8–26.8) | (13.0–25.8) | (12.9–25.8) | |
| LSV (ml) | 25.5 | 17.2 | 18.2 | 19.5 | 17.6 |
| (19.0–39.0)* | (15.2–25.1) | (11.7–22.5) | (15.4–22.1) | (9.9–26.0) | |
| LVEF (%) | 62.0 | 52.5 | 47.3 | 52.8 | 43.9 |
| (51.0–79.0)* | (37.7–71.1) | (36.2–60.3) | (42.9–59.7) | (33.8–64.5) | |
| LVmassD (mg) | 60.2 | 39.4 | 38.6 | 39.4 | 39.4 |
| (30.7–68.4) | (27.7–46.4) | (28.2–44.1) | (27.5–45.7) | (26.7–48.7) | |
| LVmass (mg) | NA | 39.1 | 37.0 | 39.1 | 40.1 |
| (26.9–47.2) | (28.5–44.8) | (28.7–47.3) | (27.8–43.3) | ||
| RVEDV (ml) | NA | 36.8 | 35.6 | 42.7 | 40.2 |
| (29.2–41.1) | (27.2–44.4) | (32.2–50.9) | (30.1–50.5) | ||
| RVESV (ml) | NA | 22.4 | 21.9 | 22.5 | 25.4 |
| (14.6–28.7) | (14.9–32.5) | (15.5–29.1) | (15.1–30.6) | ||
| RVSV (ml) | NA | 14.5 | 12.2 | 18.5 | 16.2 |
| (8.2–20.3) | (7.3–21.3) | (14.6–25.3) | (8.1–22.7) | ||
| RVEF (%) | NA | 40.0 | 37.4 | 45.2 | 43.3 |
| (22.3–55.1) | (23.6–48.2) | (38.6–58.2) | (23.6–50.0) | ||
- *Simpson's method.
- †P-value for comparison of echocardiography and MDCT for LVEDV = 0.01, all other P-values are greater than 0.05 or N/A.
- LVEDV, left ventricular end diastolic volume; LVESV, left ventricular end systolic volume; LSV, left ventricular stroke volume; LVEF, left ventricular ejection fraction; LVmassD, diastolic left ventricular myocardial mass; LVmassS, systolic left ventricular myocardial mass; RVEDV, right ventricular end diastolic volume; RVESV, right ventricular end systolic volume; RVSV, right ventricular stroke volume; RVEF, right ventricular ejection fraction.
| CTA | MRI | ||||
|---|---|---|---|---|---|
| Awake | Protocol A | Protocol B | Protocol A | Protocol B | |
| Anesthetic protocol | Median | Median | Median | Median | Median |
| Modality Echo | (minimum-maximum) | (minimum-maximum) | (minimum-maximum) | (minimum-maximum) | (minimum-maximum) |
| IVSd (cm) | 0.76 | 0.73 | 0.74 | 0.79 | 0.77 |
| (0.66–0.88) | (0.52–0.79) | (0.49–0.82) | (0.66–1.02) | (0.59–0.98) | |
| IVSs (cm) | 1.06 | 0.8 | 0.85 | 0.94 | 0.77 |
| (0.95–1.2) | (0.58–0.95) | (0.61–0.96) | (0.66–1.47) | (0.54–1.04) | |
| LVIDd (cm) | 3.25 | 2.97 | 2.98 | 3.19 | 3.41 |
| (2.79–3.63) | (2.69–3.31) | (2.78–3.35) | (2.97–3.45) | (2.84–3.63) | |
| LIVDs (cm) | 2.15 | 2.56 | 2.64 | 2.6 | 2.67 |
| (1.67–2.45) | (2.23–2.76) | (2.35–3.03) | (2.04–2.96) | (2.23–3.07) | |
| LVPWd (cm) | 0.68 | 0.75 | 0.75 | 0.76 | 0.73 |
| (0.53–0.79) | (0.6–1.0) | (0.66–0.84) | (0.52–0.94) | (0.7–0.94) | |
| LVPWs (cm) | 1.03 | 1.0 | 0.9 | 1.04 | 0.92 |
| (0.85–1.17) | (0.72–1.23) | (0.72–1.0) | (0.46–1.25) | (0.65–1.22) | |
| FS (%) | 33.5 | 13.11 | 12.08 | 21.5 | 16.81 |
| (26.0–41.0) | (6.88–25.22) | (3.53–20.22) | (12.11–32.44) | (11.85–29.53) | |
| LA diam 3ch (cm) | 2.21 | 2.93 | 2.99 | 2.8 | 2.72 |
| (1.92–2.49) | (2.62–3.24) | (2.63–3.34) | (2.10–2.92) | (2.41–2.99) | |
| Mitral annulus 3ch (mm) | NA | 2.01 | 1.93 | 2.02 | 1.94 |
| (1.82–2.08) | (1.5–2.2) | (1.71–2.34) | (1.83–2.20) | ||
| Ao annulus 3ch (%) | 1.71 | 1.3 | 1.3 | 1.17 | 1.18 |
| (1.55–1.97)‡ | (0.99–1.37) | (1.09–1.38) | (0.94–1.47) | (1.04–1.34) | |
| LA/Ao ratio | 1.27 | 2.34 | 2.34 | 2.41 | 2.35 |
| (1.18–1.49) | (1.97–3.05) | (1.97–3.05) | (1.93–3.04) | (1.8–2.64) | |
| Mitral annulus diam 4ch (cm) | NA | 2.4 | 2.4 | 2.13 | 2.04 |
| (2.12–2.58) | (2.19–2.69) | (1.69–2.23) | (1.8–2.34) | ||
| prox Ao (cm) | NA | 1.27 | 1.28 | 1.28 | 1.32 |
| (1.14–1.52) | (1.08–1.51) | (1.07–1.6) | (1.18–1.56) | ||
| MPA (cm) | 1.6 | 1.39 | 1.33 | 1.23 | 1.3 |
| (1.5–1.8)† | (1.21–1.56) | (0.92–1.56) | (1.11–1.24) | (1.12–1.56) | |
| Ao/PA ratio | 0.99 | 0.96 | 0.96 | 1.03 | 1.09 |
| (0.86–1.31) | (0.82–1.04) | (0.8–1.48) | (0.96–1.22) | (0.98–1.19) | |
- *Aortic annulus measured in right parasternal view for the left ventricular outflow tract on echocardiography.
- †MPA measured in right parasternal short axis view on echocardiography.
- ‡No statistically significant differences were found between the anesthetic protocols within the cross-sectional modalities using the paired Wilcoxon rank sum test (P = 0.292 for LVIDs using MRI; P = 1 for all other variables). The cross-sectionally acquired measurements did not allow for prediction of the values generated using echocardiography in the awake dogs (P = 1 for all variables).
- IVSd, diastolic interventricular septal thickness; IVSs, systolic interventricular septal thickness; LVIDd, diastolic left ventricular internal diameter, measured just proximal to the papillary muscles; LVIDs, systolic left ventricular internal diameter, measured just proximal to the papillary muscles; LVPWd, diastolic left ventricular posterior wall thickness; LVPWs, systolic left ventricular posterior wall thickness; FS%, percent fractional shortening; LA diam 3ch, left atrial diameter measured on three-chamber view; mitral annulus 3ch, mitral annulus measured on approximated three-chamber view; Ao annulus 3ch, aortic annulus measured on three-chamber view; LA/Ao ratio, left atrium to aorta ratio; mitral annulus 4ch, mitral annulus measured on four-chamber view; prox Ao, proximal aorta measured on transverse plane; MPA, main pulmonary artery transverse plane; Ao/PA ratio, aorta to pulmonary artery ratio.
| Volumetric cardiac variable | LLOA | Bias | ULOA |
|---|---|---|---|
| LVEDV (ml) | −5.43 | 1.42 | 8.27 |
| LVESV (ml) | −4.28 | 1.37 | 7.02 |
| LSV (ml) | −6.84 | 0.05 | 6.94 |
| LVEF (%) | −17.45 | −2.11 | 13.24 |
| LVmassD (mg) | −6.51 | 2.05 | 10.62 |
| LVmassS (mg) | −5.33 | 1.62 | 8.58 |
| RVEDV (ml) | −6.87 | 5.08 | 17.04 |
| RVESV (ml) | −7.88 | 0.89 | 9.66 |
| RVSV (ml) | −3.63 | 4.19 | 12.02 |
| RVEF (%) | −9.54 | 5.51 | 20.57 |
- LLOA, 95% lower level of agreement; ULOA, 95% upper level of agreement; LVEDV, left ventricular end diastolic volume; LVESV, left ventricular end systolic volume; LSV, left ventricular stroke volume; LVEF, left ventricular ejection fraction; LVmassD, diastolic left ventricular myocardial mass; LVmassS, systolic left ventricular myocardial mass; RVEDV, right ventricular end diastolic volume; RVESV, right ventricular end systolic volume; RVSV, right ventricular stroke volume; RVEF, right ventricular ejection fraction.
| Planar variable | LLOA | Bias | ULOA |
|---|---|---|---|
| IVSd (cm) | −0.19 | 0.08 | 0.35 |
| IVSs (cm) | −0.29 | 0.09 | 0.46 |
| LVIDd (cm) | −0.15 | 0.21 | 0.56 |
| LIVDs (cm) | −0.49 | −0.01 | 0.47 |
| LVPWd (cm) | −0.21 | −0.01 | 0.18 |
| LVPWs (cm) | −0.42 | 0.0 | 0.42 |
| FS (%) | −9.29 | 5.94 | 21.18 |
| LA diam (cm) | −0.37 | −0.3 | 0.18 |
| Mitral annulus 3ch (cm) | −0.31 | 0.04 | 0.38 |
| Ao annulus 3ch (cm) | −0.37 | −0.1 | 0.18 |
| LA/Ao ratio | −0.88 | −0.01 | 0.86 |
| Mitral annulus 4ch (cm) | −0.8 | −0.35 | 0.09 |
| prox Ao (cm) | −0.16 | 0.02 | 0.21 |
| MPA (cm) | −0.45 | −0.09 | 0.27 |
| Ao/PA ratio (cm) | −0.19 | 0.08 | 0.65 |
| Mitral annulus: 3ch vs. 4ch (cm) | −0.29 | 0.27 | 0.83 |
- Overall good agreement was found between the modalities when combining the anesthetic protocols per modality and individual.
- LLOA, lower level of agreement; ULOA, upper level of agreement; IVSd, diastolic interventricular septal thickness; IVSs, systolic interventricular septal thickness; LVIDd, diastolic left ventricular internal diameter, measured just proximal to the papillary muscles; LVIDs, systolic left ventricular internal diameter, measured just proximal to the papillary muscles; LVPWd, diastolic left ventricular posterior wall thickness; LVPWs, systolic left ventricular posterior wall thickness; FS%, percent fractional shortening; LA diam 3ch, left atrial diameter measured on three-chamber view; mitral annulus 3ch, mitral annulus measured on approximated three-chamber view; Ao annulus 3ch, aortic annulus measured on three-chamber view; LA/Ao ratio, left atrium to aorta ratio; mitral annulus 4ch, mitral annulus measured on four-chamber view; prox Ao, proximal aorta measured on transverse plane; MPA, main pulmonary artery transverse plane; Ao/PA ratio, aorta to pulmonary artery ratio.


Graphical display of the Bland–Altman analysis comparing the planar left ventricular measurement generated using MDCTA (CT) vs. MRI (MR) when combining the measures for the two different anesthetic episodes per modality. The bias is shown by the central horizontal line, the 95% lower and upper levels of agreement are depicted as the horizontal lines above and below.
IVSd, interventricular septum thickness at diastole (cm); IVSs, interventricular septum thickness at systole (cm); LVIDd, left ventricular internal diameter at diastole (cm); left ventricular internal diameter at systole (cm); LVPWd, left ventricular diameter at diastole (cm); LVPWs, left ventricular diameter at systole (cm); FractShort, fractional shortening (%).


Comparison of the planar variables from the five exams (awake echocardiography and MDCTA, MRI using protocols A and B) showed significant differences for the following variables: IVSs P = 0.0006, LVIDd P = 0.03, LVIDs P = 0.002, FS P = 0.0005, AoDiam P = 0.004, LADiam P = 0.003, PADiam P = 0.0009, LAAo ratio P = 0.0421, AoPA ratio P = 0.048 (Figs. 13 and 14). When testing if the planar measurements acquired using the cross-sectional imaging modalities with the dogs anesthetized would be able to predict measurements generated by echocardiography in the awake dog, no significant agreement was found (P = 1 all variables).

Graphical display using box plots to compare left ventricular planar measurements generated using the four anesthetic protocol and modality combinations to the echocardiographic results gathered from the awake animals. No significant differences were found for any of the variables comparing the anesthesia protocols within each modality using paired Wilcoxon testing. Adjusted P-values comparing all five exams (awake echocardiogram, anesthesia and MDCT, MRI using protocols A and B) are given below the plots. Prediction of echocardiographic measurements using the cross-sectional modalities was not possible (P = 1).
IVSd (cm), interventricular septal thickness at diastole; IVSs (cm), interventricular septal thickness at systole; LVIDd (cm), left ventricular internal diameter at diastole. Using protocol A and 64-MDCTA this was the only variable allowing for predictions of the echocardiographic measurement in the awake dog; LIVDs (cm), left ventricular internal diameter at systole; LVPWd (cm), left ventricular posterior wall at diastole; LVPWs (cm), left ventricular posterior wall at systole; FractShort (%),fractional shortening.
AwakeEcho, echocardiogram performed on the awake dogs; DexCT, MDCTA using anesthetic protocol B; DexMR, MRI using anesthetic protocol B; MidFentCT, MDCTA using anesthetic protocol A; MidFentMR, MRI using anesthetic protocol A. Line segments join observations obtained from the same dog as imaging and anesthesia protocols vary.

Graphical display using box plots showing comparison of selected planar measurements generated using the four anesthetic protocol and modality combinations to the echocardiographic results gathered from the awake animals. There were no significant differences found for any of the variables comparing the anesthesia protocols within each modality using paired Wilcoxon testing. Adjusted P-values comparing all five exams (awake anesthesia and MDCT, MRI using protocols A and B) are given below the plots. Prediction of echocardiographic measurements using the cross-sectional modalities was not possible (P = 1).
AoDiam3 (cm), aortic diameter generated on the three-chamber view using the cross-sectional modalities; LaDiam3 (cm), left atrial diameter measured on three-chamber view using the cross-sectional modalities; PADiam (cm), pulmonary artery diameter; LaAODiam (cm), left atrium (measured on three-chamber view) to aorta ratio; AoPADiam (cm), aorta to pulmonary artery ratio;
AwakeEcho, echocardiogram performed on the awake dogs; DexCT, MDCTA using anesthetic protocol B; DexMR, MRI using anesthetic protocol B; MidFentCT, MDCTA using anesthetic protocol A; MidFentMR, MRI using anesthetic protocol A. Line segments join observations obtained from the same dog as imaging and anesthesia protocols vary.
Discussion
In the current study, diagnostic quality cardiac examinations were successfully acquired in a group of healthy beagle dogs using two different anesthetic protocols and both 64-MDCTA and 3T MRI. The use of different anesthetic protocols for the use in cardiac cross-sectional exams has not yet been evaluated; both anesthetic protocols used in this study were well tolerated and produced comparable results for the vital variables recorded in the healthy study population.
Heart rate control has been reported essential for image quality for MDCT acquisitions; high and irregular heart rates will cause motion artifact as the anatomy of the heart and the intravascular bolus may be depicted at different points of the cardiac cycle in the different acquisition segments.32 The target heart rate of <65 bpm recommended in the human literature for cardiac MDCTA was not reached consistently using either protocol. Despite this, overall very good image quality was achieved at the given temporal resolution using a 64-MDCTA unit and a 0.35 s tube rotation time. Mild motion artifact was seen in during systole exams that was displayed as mild shifting between the acquisition segments, yet this did not negatively influence the diagnostic quality of the studies and allowed for all measurements. Further, advancement of CT technology using 320 detector row or dual-source units is further increasing the speed of image acquisition and may lessen the need for lowering the heart rate for cardiac CT exams in the future.40 A recent study used dual-source MDCT for the evaluation of left ventricular volumes in dogs, and even though no specific comments on image quality were made a mean heart rate greater than 70 bpm allowed for acquisition of the volumetric measurements.29
The SSFP MRI sequences were acquired retrospectively EKG gated during a breath hold. The arrhythmia rejection feature was turned off during acquisition as this commonly aborted the scan on the initial dog. The TR is a function of the patients heart rate as recorded by the gating software and varied between 3.3 and 4.1 ms in the exams and resulted in excellent image quality at the given heart rates.41
Left ventricular systolic function variables investigated in this study were LVEDV, LVESV, LSV, LVEF and no difference between either anesthetic protocol or either of the three imaging modalities was identified. This differs from a recent study using a similar population of dogs, where the authors report higher EDV values generated on cardiac CT exams compared to MRI exams represented by a linear relationship between the modalities.28 The reason for this disagreement is not clear but we speculate that this might relate to a systematic discrepancy in the evaluation of the measurements performed between CT or MRI vs. a true alteration induced by the larger contrast bolus injected for the CT exam compared to no contrast injected for the MRI exam; alternatively the order of imaging modalities was not randomized in that study and an effect of anesthetic duration may have contributed. It is important to verify inclusion of the same portion of the heart in the analysis by comparison of the systolic to diastolic myocardial volume mass as calculated by subtraction of endocardial from the epicardial volumes; this was performed in our study and might have aided to minimize an effect by modality compared to the report by Sieslack et al.28
In addition, since all dogs also had a low level (∼1–2%) of isoflurane added to their anesthetic protocol in our study, any potential differences in these variables associated with the two protocols may have been masked by isoflurane since administration produces dose-dependent cardiovascular depression in dogs.42
Measurement of the myocardial mass is of interest in people in evaluating hypertrophic cardiomyopathies or the effects of downstream hypertension and is used as an independent variable in patients with heart disease. It has also been applied in experimental animal studies for the left and right ventricle.2, 43-46 This variable has rarely been reported generated using MRI or MDCTA in companion animals but left myocardial wall thickness is regularly included in echocardiographic reporting in companion animals and further evaluation of this variable might be helpful in companion animal cardiac MRI or MDCTA.26, 31, 47, 48
Inclusion or exclusion of the papillary muscles into the ventricular volume has been used variably between authors and exclusion of the papillary muscles from the left ventricular volume will naturally result in small systematic differences in the quantitative values.43, 45, 49, 50 In echocardiographic exams, the papillary muscles are typically disregarded using Simpson's rule estimates and by definition in Teichholz estimates.51 Automated threshold-based 3D segmentation methods can be used to assess ventricular function and will usually exclude the papillary muscles from the ventricular lumen as the attenuation of intraluminal contrast medium vs. the myocardium is used for threshold settings.49
We aimed to keep the contrast and saline chaser volume low in the MDCT part of our study to avoid volume overloading of the dogs; ventricular contrast achieved was adequate to depict the anatomy to semiautomatically outline the endocardial surfaces of the left and, despite the relatively small contrast volume used, also the right ventricle. However, the ventricular enhancement was at the low end for recognition using automated threshold settings so these could not be consistently applied and planar measurements (the Simpson method) were therefore performed in this study using the short axis planes for the left and transverse planes for the right heart. This is more time consuming for the evaluator and bears potential room for observer variance; this study used one evaluator to avoid introduction of interobserver variation. The papillary muscles were consistently included in the ventricular volume in our study due to institutional preference. Overall, the LVEDV reported in our study is slightly lower as reported by Sieslack28 whereas the SVs reported are fairly similar. This may therefore relate to the inclusion of the papillary muscles but a difference caused by the anesthetic protocols used cannot be ruled out since they affect the cardiovascular system to differing degrees.
Systolic right ventricular function variables have not been investigated in companion animals using cross-sectional modalities but this gains progressive interest for evaluation in people.43, 52 This study also showed no difference between the two anesthetic protocols as well as imaging modality used for the assessment of RVEDV, RVESV, RVSV, and RVEF and delivers an initial reference.
Overall, no difference was found for any of the evaluated planar variables using either anesthetic protocol within the modalities, MDCTA or MRI. This would make the use of the protocols interchangeable for evaluation of these variables within each modality. There was also a low bias in comparing MDCTA and MRI for all variables when the anesthesia protocols were combined. However, because our study was performed in healthy dogs, we cannot extrapolate our data to other species or to patients with cardiovascular diseases or abnormalities.
Placement of the measurements was overall easily performed, only over the caudal aspect of the left atrium mild flow-artifact from the pulmonary venous inflow made the delineation of the caudal atrial border difficult at times. However, the bias between the measurements acquired on MDCTA and MRI was only 0.3 cm for this variable; though this should be considered as a possible disadvantage when using MRI to evaluate the caudal left atrial border.
As expected, the MRI and CT variables acquired using anesthesia protocols A and B produced different values to those acquired in the awake animals using echocardiography. Left EDVs were higher, ESVs were lower; left ventricular stroke volume and EFs were higher using echocardiography in the awake animals compared to any of the anesthesia modality combinations, even though there was overlap. These findings are consistent with those found in previous studies in isoflurane-anesthetized dogs.53 A recent study compared echocardiographic measurement of the left ventricular volume using the Teicholz and modified Simpson method to left ventricular volumes acquired using dual-source CT and applying the Simpson method in seven propofol/isoflourane-anesthetized dogs using medetomedine as premedication. In this study, the left ventricular volumes using the modified Simpson method in echocardiography underestimated the volume both compared to echocardiographic measurement using the Teichholz method and measurements from the dual-source CT studies using the modified Simpson method.29 In a different study using 10 propofol/isoflourane-anesthetized dogs induced with diazepam and levomethadone showed a high correlation of the mean values for EDV and ESV measured from MDCT or echocardiographic exams, using the Simpson method as preferred calculation of the volumes.23, 27 Another study evaluated 10 dogs using a nonspecified anesthetic protocol for assessment of left ventricular volumes using three-dimensional echocardiography and MRI did not find significant differences for EDV, ESV, and EF between the two modalities, but differences were found comparing to one- or two-dimensional echocardiographic measurements.27
The IVSs measurement was larger when evaluated using echocardiography in the awake dogs, possibly indicating higher contractility in the awake compared to anesthetized dog as shown in previous reports in isoflurane-anesthetized dogs;53 this effect was present but weaker for LVPWs. Similarly, the fractional shortening was greater and LVIDs was lower in the awake dogs compared to either of our anesthesia protocols, most likely due to the background of isoflurane in all dogs.53 The aortic and pulmonary artery diameter was larger in the awake vs. anesthetized patients. Although previous reports have reported smaller aortic and pulmonic diameters in isoflurane-anesthetized dogs,53, 54 others have shown no change.53 Even though blood pressure measurements were not acquired on the awake dogs, a reduction in systemic and pulmonary diameter is consistent with lower blood pressures associated with isoflurane anesthesia even though a modality specific alteration of acquisition of the variable cannot be fully ruled out.
The left atrial diameter was lower evaluated in the awake dogs compared to any of the anesthesia protocol–modality combinations. Mildly reduced cardiac contractility in the anesthetized dogs might explain this finding. Based on the difference in these measurements, the LAAo ratio was additionally altered in the anesthetized animals; for the AoPA ratio there was greater overlap but also no predictive value for echocardiography was generated.
A previous study used seven isoflourane-anesthetized normal beagles to compare anatomical measurements acquired using dual-source CT to echocardiographic measurements and found overall good agreement except for the values of the interventricular wall and left ventricular posterior wall thickness in end diastole.41 The authors of this study speculate that interference of anatomical structures such as the papillary muscles or chorda tendinae in combination with lower far-field image quality in echocardiography compared to the high quality of the dual-source CT images may be causative for this discrepancy. As clinical patients are unlikely to undergo an anesthetized echocardiogram before cross-sectional imaging, a possible discrepancy of the values as described in our study may be considered. Alternatively, evaluation of the cross-sectional measurements in the anesthetized animal compared to awake echocardiography in a larger patient group may show trends that may allow for prediction between the modalities in the future.
The main limitation of this study includes the low number of study subjects used; ideally a larger and more varied study population representing different dog breeds, sizes, and chest morphologies might have been included. Magnetic resonance imaging studies took markedly longer to acquire than the MDCTA studies; availability of the respective modalities as well as the study question may determine the choice of modality for companion animal patients in the future, as a low bias was present between the modalities in our study. Both modalities resulted in overall very good and diagnostic image quality.
ACKNOWLEDGMENTS
The authors would like to thank Sara John and Alice Minx for their assistance in acquiring the MRI and MDCT exams, respectively.