COMPUTED TOMOGRAPHY OF BALL PYTHONS (Python regius) IN CURLED RECUMBENCY
Funding sources: None.
Previous presentations or abstracts: None.
Abstract
Anesthesia and tube restraint methods are often required for computed tomography (CT) of snakes due to their natural tendency to curl up. However, these restraint methods may cause animal stress. The aim of this study was to determine whether the CT appearance of the lungs differs for ball pythons in a curled position vs. tube restraint. Whole body CT was performed on ten clinically healthy ball pythons, first in curled and then in straight positions restrained in a tube. Curved multiplanar reformatted (MPR) lung images from curled position scans were compared with standard MPR lung images from straight position scans. Lung attenuation and thickness were measured at three locations for each scan. Time for positioning and scanning was 12 ± 5 min shorter for curled snakes compared to tube restraint. Lung parenchyma thickness and attenuation declined from cranial to caudal on both straight and curled position images. Mean lung parenchyma thickness was greater in curled images at locations 1 (P = 0.048) and 3 (P = 0.044). Mean lung parenchyma thickness decreased between location 1 and 2 by 86–87% (straight: curled) and between location 1 and 3 by 51-50% (straight: curled). Mean lung attenuation at location 1 was significantly greater on curled position images than tube restraint images (P = 0.043). Findings indicated that CT evaluation of the lungs is feasible for ball pythons positioned in curled recumbency if curved MPR is available. However, lung parenchyma thickness and attenuation in some locations may vary from those acquired using tube restraint.
Introduction
Diagnostic imaging of snakes can be challenging, both due to their elongated shape and tendency to curl up. Radiography has traditionally been widely used but usually relies on snakes being restrained in tubes to approximate a true lateral or dorsoventral view. In conscious animals this is potentially a stressful process and the diagnostic quality of the images may be limited by animal shape, poor contrast, and superimposition of the ribs and spine. Multiple images are required to examine the whole length of the snake. Alternatively sedation may be necessary to immobilize difficult animals.1
Computed tomography (CT) examination eliminates many of the limitations of radiography by avoiding superimposition of skeletal structures and allowing reconstruction of the animal's anatomy. However, CT also requires the patient to be immobile and usually also requires positioning within a tube. Potentially sedation may still be needed to immobilize the patient to obtain images of higher quality.2 A snake in a tube is not in a relaxed position and anatomic structures may appear stretched. In addition, scanning the entire length of the snake's anatomy poses technical challenges such as increased scan time, potential for motion artifacts, X-ray tube heating, and number of CT series needed.
Radiographic images of snakes in a natural curled position have been suggested to be of inferior diagnostic value.1 However, CT images obtained from a curled snake can be viewed with standard and curved multiplanar reformatting (MPR) software to yield clinically useful information.3 The aim of this study was to compare the CT appearance of the lungs for snakes in a curled position vs. a tube restraint elongated position.
Materials and Methods
Ten ball pythons (Python regius) were prospectively recruited. All snakes belonged to a local zoological collection and were due to be health screened as part of their recommended preventative medicine protocol. Snakes had last been fed 1 week prior to the study. Only snakes with no pre-existing health concerns and those for which a full CT examination could be performed were included in the study. The study was approved and conducted in accordance with guidelines of the institutional Veterinary Ethical Review Committee.
Each snake was given a full clinical examination, weighed and measured from the snout to the tail tip using a flexible tape measure. Each snake then underwent a CT examination, first in the curled and then in the straight position using a helical 4-slice CT unit (Somatom Volume Zoom, Siemens, Germany). For the curled CT examinations, the snake was placed in a small plastic tray in the natural curled position. Foam wedges were used to minimize snake movement and a second tray was placed on top of the first to prevent escape. Both the time from taking the snake from its travel container to position it for CT examination and the length of time for the CT to be performed was recorded in each case. Each snake was then stretched straight out and placed in a tube made of radiographic film secured with tape. The tubes were adjusted to fit each individual snake's diameter along its length to minimize movement and lateral spinal deviation. Both tube ends were taped closed and the CT examination was repeated using the same settings as previously. The number of CT series was varied as needed in order to acquire images of the whole body for each snake. The number of series necessary to cover the entire snake was recorded. Time taken to position the snake and time taken to perform the CT examination was again recorded. Constant CT parameters were 80 kV tube voltage, 90 mAs tube current, 1 s tube rotation time, helical scan mode, collimator pitch of 1.025, 1 mm slice width, and 0.5 mm image reconstruction interval. Images were reconstructed with a high-frequency image reconstruction kernel (proprietary term B70).
All images were analyzed by a single observer (J.H.) who did not perform the original CT examinations of the snakes. Images were evaluated in a random order using dedicated DICOM viewing software (OsiriX 3.9.2, open source software) on a computer with integrated calibrated flat-screen LCD monitor (27 inch iMac, Apple Inc. 90 Cupertino, CA). Images were reviewed with a wide window setting (centre 440 HU, width 4400 HU) to maximize visualization of bones and lungs. The total length of each snake in a tube was measured in a straight line from the snout to the tail tip on the topographic planning radiograph (not taking into account spinal curvatures). Both lungs were then evaluated using a standard published protocol.4 Briefly, the start and the endpoints of the visible respiratory tissue were identified and transverse images were then evaluated at 25% (location 1), 50% (location 2), and 75% (location 3) of the length of the respiratory tissue. Thickness of lung parenchyma and X-ray attenuation were measured at the left, right, dorsal, and ventral aspect of each lung. Width and height of the central lumen of the lung at each location were also measured.
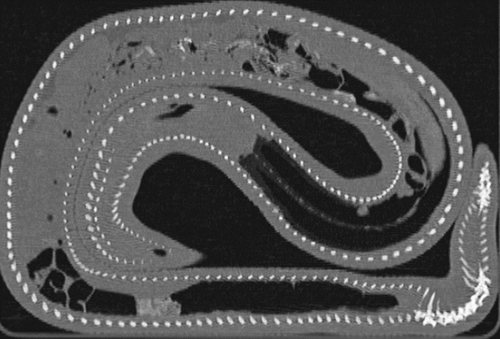
The same image analysis software was used to perform curved MPR of the curled snake images. First, a dorsal plane of the snake was selected on which the curved reconstruction was planned. If the snake was not curled up completely in one plane but several planes (turban-like), the dorsal plane of the body segment containing the lungs and air sacs was selected. The total length of each snake from snout to tail tip was measured on the dorsal plane and compared to the length measured on clinical examination as previously. The length of respiratory tissue was also measured and transverse images were evaluated at 25% (location 1), 50% (location 2), and 75% (location 3) of the length of the respiratory tissue to be evaluated as for the straight CT images. All points were also selected to be in the axial centre of the snake body with the help of the sagittal and transverse displays also provided by the software. Once the selection of the curvilinear plane was achieved it was finalized by a double mouse click. The settings were preserved in DICOM format as a series of 120 images, rotated axially by 360 degrees in 3-degree intervals with the pivotal point of the rotation centered on the curvilinear plane. The series was exported to the DICOM viewer and PACS for clinical use.
Statistical analyses were performed by the first author (J.H.) using a commercially available software program (Minitab 16; Minitab Ltd., Coventry, UK) and a P value of <0.05 was taken to indicate statistical significance. All measured values were tested for normal distribution by use of the Anderson–Darling test. A Pearson correlation test was performed to test correlation between snake lengths and lung lengths by the different methods. A paired sample two-tailed t test was used to compare the thickness of lung parenchyma and attenuation in the defined regions of interest between straight and curled snakes.
Results
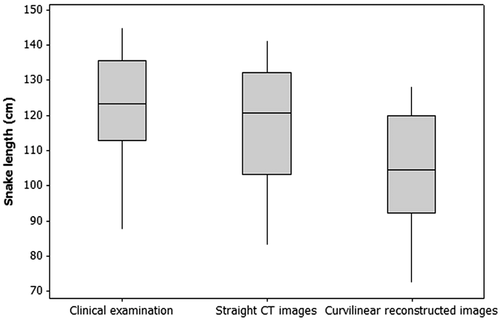
Ten captive snakes met the inclusion criteria consisting of two males and eight females, all over 3 years old. Eight snakes naturally curled in a clockwise direction, while two snakes naturally curled in an anticlockwise direction, all with tail on the outside. No abnormalities were found in any of the snakes on clinical examination and weights ranged between 0.48 and 2.39 kg (mean ± standard deviation (SD) 1.65 ± 0.65 kg). Total lengths measured on clinical examination 122.5 ± 16.3 cm (range 87.5–145) were greater than those measured from the straight CT examinations 117.4 ± 18.0 cm (83.2–141.4) and those measured from the curved MPR images of the curled snakes 104.0 ± 16.7 cm (72.4–128.1; Fig. 1). The ratios of straight CT length/total length and curled CT length/total lengths were calculated and found to be 0.93 ± 0.04 for the straight images and 0.85 ± 0.03 for the curved MPR images. A significant positive correlation was found between measurements for each individual snake (length on exam: straight CT length r = 0.964, P < 0.001, length on exam: curled CT length r = 0.979, P < 0.001).
Combined time for positioning and scanning snakes in a curled position was 12 ± 5 min, which was 9 ± 6 min shorter than tube restraint. Positioning and scanning times were shorter for curled snakes compared to straight snakes; 3 ± 5 min shorter for positioning time, and 6 ± 4 min shorter for scanning time, respectively.
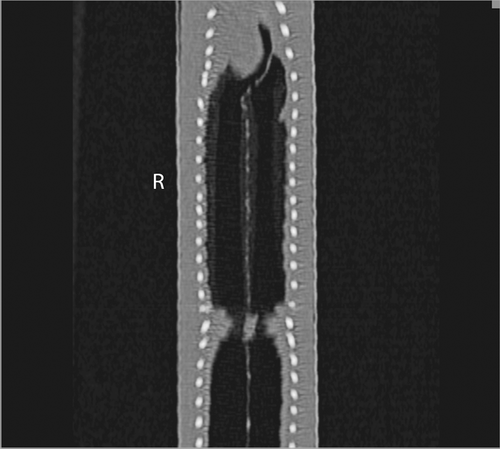
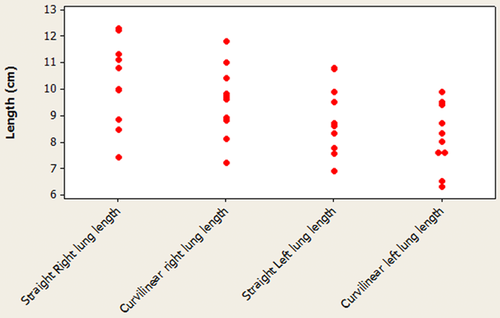
Two lungs were present in every snake with the left lung being consistently smaller than the right (Figs. 2 and 3). All values for lung measurements were normally distributed. On the straight CT the mean proportion right lung: body length was 8.7% ± 0.6 (range 8.1–9.8%) and mean proportion left lung: right lung was 87% ± 6 (range 77–95%). On the curled CT mean proportion right lung: body length was 9.2% ± 0.9 (range 7.9–10.6%) and mean proportion left lung: right lung was 86% ± 3 (range 80–90%). A significant positive correlation was found between lung measurements for each different method (straight right lung length: curved right lung length r = 0.59, P < 0.001, straight left lung length: curled left lung length r = 0.962, P < 0.001) (Fig. 4).
Mean thickness of lung parenchyma decreased from cranial to caudal on both the straight and curled position images, but mean thickness and SD of lung parenchyma were greater in each location on the curled images (Table 1). These differences were statistically significant at locations 1 (P = 0.048) and 3 (P = 0.044) but not at location 2 (P = 0.077). On the straight images, mean thickness decreased between location 1 and 2 by 86% and between location 1 and 3 by 51%. On the curled position images, mean thickness decreased between location 1 and 2 by 87% and between location 1 and 3 by 50%. The measurements at each region of interest were compared on straight and curled images to evaluate if thickness was consistently different at specific points within each location or whether there was any correlation between measurements at specific points. The thickness of the medial part of the left lung was significantly greater in all locations on the curled images compared to the straight images (P < 0.048). Otherwise there were no consistent differences or correlations between measurements at specific points and the direction of curl did not appear to influence results.
| Mean thickness (mm) on straight images | Mean thickness (mm) on curled position images | |
|---|---|---|
| Location 1 (25%) | 2.74 ± 0.06 (1.6–3.6) | 3.39 ± 0.11 (2.1–5.1) |
| Location 2 (50%) | 2.35 ± 0.05 (1.5–3.3) | 2.95 ± 0.11 (1.0–3.4) |
| Location 3 (75%) | 1.41 ± 0.02 (1.1–1.7) | 1.70 ± 0.04 (0.9–2.1) |
Attenuation within the regions of interest declined from cranial to caudal on the straight images and curled position images. These data were normally distributed but both mean and median values were calculated in order to compare our data with previous reference ranges (Table 2). Measurements of mean attenuation were greater in each location on the curled images but these differences were only statistically significant at location 1 (P = 0.043). The measurements at each region of interest were compared on straight and curled images to evaluate if attenuation was consistently different at specific points within each location or whether there was any correlation between measurements at specific points. No statistically consistent differences or correlations were found between straight and curled position measurements and the direction of curl did not appear to influence results.
| Mean ± SD (range) attenuation (HU) on straight images | Mean ± SD (range) attenuation (HU) on curled position images | Median attenuation (HU) on straight images | Median attenuation (HU) on curled position images | |
|---|---|---|---|---|
| Location 1 (25%) | −776.0 ± 48.9 (−697.0 to −833.0) | −724.1 ± 91.0 (−555.1 to −855.1) | −807.5 | −717.0 |
| Location 2 (50%) | −786.3 ± 84.1 (−585.2 to −861.5) | −760.8 ± 76.0 (−584.3 to −838.2) | −818.3 | −788.8 |
| Location 3 (75%) | −797.2 ± 72.6 (−633.8 to −884.6) | −800.0 ± 88.0 (−621.4 to −906.0) | −828.3 | −802.8 |
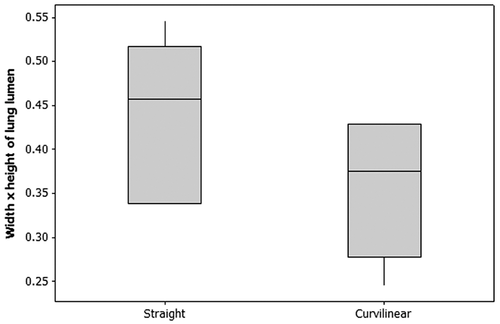
Overall size (width × height) of the central lumen of the lung was reduced in the curled position images compared to the straight images (P = 0.032) with size being reduced at every location (Fig. 5). Height of lumen was decreased in the curled position images compared to the straight images (P = 0.003). Width of lumen was increased at locations 1 and 2 on the curled position images but there was no statistically significant difference seen compared to the straight images (P > 0.204).
Discussion
Performing CT examinations on the conscious snakes in this study either in a straight or curled position was a relatively simple procedure. Many ball pythons will naturally curl up as a defense mechanism in an unfamiliar situation but it is worth noting that other snake species may not be as compliant as this. Although ideally the order of imaging curled and straight positions would have been randomized, the curled position was examined first in each case in order to minimize stress. The snakes in the curled position could be positioned in a shorter time than the snakes restrained straight in the tube and scanning time was also reduced indicating that this would potentially be a more useful technique in practice.
Many CT units in veterinary practice have limited X-ray tube heat capacity, making it difficult or impossible to scan an entire large snake in a straight position.2 In addition, most CT units have a maximum scan length, usually between 100 and 130 cm, making it impossible to scan an entire snake in one series. The snake may then have to be scanned instead in several body part series, which can be time consuming as shown in our study. Our study validated an alternative approach that would be easier to achieve in practice. Multi-planar reformatting software tools are widely available that allow visualization in dorsal and sagittal image planes. We found that dorsal planar reformatting was most helpful for curled snakes and sufficient for evaluation of the lungs. For this it was optimal if the snake was curled in only one plane (like a Danish pastry) and not several (turban-like). This can be relatively easily achieved in most snakes.
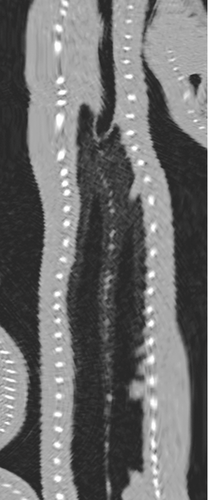
Curved MPR is a software tool available in most image analysis programs. This tool allows the operator to straighten curved structures in a single plane and is widely used in dental imaging to display the dental arcade in a single CT image similar to a panoramic radiograph.3 In this study it allowed a virtual uncurling of the curled snake in order to review the lungs at specific locations (at 25, 50, and 75% of lung length), which could then be reviewed in different image planes (Fig. 6). Obtaining high quality curved MPR images is more difficult and time consuming than obtaining standard MPR images.3 Based on our study a standard multiplanar reconstruction was often sufficient for evaluation of curled snake CT images, whereas curved MPR was a useful adjunct for pinpointing a specific location.
Measurements of snake length on CT examinations varied from those recorded with a flexible tape measured on clinical examination. Measurements performed on curled position images were shorter than on straight images, but even those restrained in a tube were not completely relaxed and straight resulting in slightly shorter measurements than on those recorded on physical examination. Accurate measurements are likely to be best achieved on the sedated or anesthetized snake. However, the fact that we found a significant correlation between measurements in each individual snake indicated that the different measuring techniques produced consistent results.
The lungs were chosen as the focus of our study because pneumonia is a common reason for snakes to have a CT examination performed and standardized reference values for the lungs have previously been established.4 Two lungs were present in every snake with the left lung being consistently smaller than the right as would be expected in this species. Lung lengths were shorter on the curled position images than on the straight images. The mean proportion right lung: body length was 8.7% on the straight images and 9.2% on the curled images. A previous study has reported a slightly greater ratio at 10.7% for ball pythons, but this appears to have been based on snout–vent length whereas our results are based on snout–tail tip length which would have resulted in the slightly lower ratios.4 The mean proportion of left lung: right lung was 87% on both the straight and curled position images, comparable to that reported in the previous study, which was 81.2%.4
Mean thickness of lung parenchyma decreased from cranial to caudal as previously reported on both straight and curled position images.5 No previous measurements of lung parenchyma thickness have been reported for ball pythons but in Indian pythons (Python molurus) thickness has been reported to decrease at location 2 to 82% of the thickness of location 1, and the thickness at location 3 to 52% of location 1.5 In this study a similar reduction in thickness was seen for both straight and curled position images, with thickness measurements at 86:87% (location 2) and 52:50% (location 3) of location 1, respectively. The mean thickness at all locations was greater for curled position images than straight images although this was only statistically significant at locations 1 and 3. The medial left lung was consistently thicker at all locations in curled position images, although measurements at other points were more variable. This may have been related to the fact that curved MPR images are generated from voxels that are not isotropic in all dimensions, rendering a slightly more blurry image, distorting the visible lung margin. The direction of the curl was not shown to influence results although it is possible that those snakes curled in a clockwise direction (the majority of snakes in this study) would be more compressed on the left side whereas snakes curled in an anticlockwise direction would be more compressed on the right side. In this study only two snakes were curled counter-clockwise, so more research would be necessary to examine this factor further.
Attenuation within the regions of interest declined from cranial to caudal as previously reported in ball pythons on both straight and curled position images.4 In the previous study, however, only median measurements were reported and these declined from −820.5 HU at location 1 to −855.1 HU at location 3. In the current study median measurements declined from −807.5 HU to −828.3 HU in the straight images and −717.0 HU to −802.8 HU in the curled position images. Mean measurements also revealed an increased level of attenuation in both the straight and the curled position images compared to the published ranges. The mean attenuation at all locations was greater on curled position images than straight images although these differences were only statistically significant at location 1. The slightly increased levels of lung attenuation between the sedated snakes in the previous study, the snakes in the tubes and the curled snakes in this study may have been due to a degree of lung compression in the latter two methods with an increased level of attenuation in the curled snakes as the lungs appeared more compressed. The previous study also looked at differences between left and right lungs and between dorsal, left, right, and ventral measurements of attenuation for each lung section and found that ball pythons (unlike other species of pythons) had higher attenuation in dorsal regions compared to left, right, and ventral regions.4 No significant differences in attenuation were found in this study either on the curled or straight images.
A previous study examining respiratory function in garter snakes found that snakes had a lower degree of respiratory system compliance when curled so this suggests that the respiratory system is to a varying degree compressed when snakes are in a curled position.6 The measurements of a reduced lung lumen support the theory that the lungs are compressed in a curled position. However an important finding is that the compression is limited to the central lung lumen and not the faveolar parenchyma as far as visible densities are concerned. Therefore if locally increased parenchymal lung density is visible in the curled snake on CT this is unlikely a positional atelectasis change but represents true pathology, such as pneumonia. However, the slightly increased measurable lung density in the curled state should be recognized as normal for this decubitus. No measurements of attenuation have been reported for ball pythons but for Indian pythons with pneumonia, mean ± (SD) attenuation was −613.7 ± 176.4 which was higher than measurements recorded in the snakes in this study.7
In conclusion, CT images of curled ball pythons may be used for evaluation of the lungs. Measurements should however be interpreted with caution as mean thickness of lung parenchyma may appear greater and mean attenuation of lung tissue increased in curled position compared to straight images. An increased level of attenuation in combination with other clinical findings may lead to a diagnosis of pneumonia, so it is important to be aware of the effects of different positioning techniques on CT measurements of the lungs.
ACKNOWLEDGMENTS
The authors would like to thank staff at Edinburgh Butterfly and Insect World for their help with this study and Dr. Darren Shaw for advice on the statistics.


