Evaluation of the Effects of Detomidine on Equine Myoelectrical Activity Using Electrointestinography
Funding: Funding for this investigation was provided by the Veterinary Emergency and Critical Care Society Research Grant and the University of Wisconsin Companion Animal Fund.
Preliminary results were presented in part at the 2019 International Veterinary Emergency and Critical Care Symposium in Washington, DC.
ABSTRACT
Objective
To evaluate the effects of detomidine on equine intestinal slow-wave activity and frequency distribution measured by electrointestinography (EIG).
Design
Prospective, experimental study.
Setting
University teaching hospital.
Animals
A convenience sample of twelve 7- to 21-year-old clinically normal horses.
Interventions
Horses were randomly assigned to saline control (four horses) or detomidine treatment (eight). After obtaining a 30-min baseline EIG, a saline or detomidine bolus was administered, followed by a constant rate infusion, and another EIG was recorded. Ultrasonographic examinations monitored cecal and left ventral colon contractions. Spectral analysis was performed to evaluate changes in dominant frequency, dominant power, total power, percent frequency distribution, and changes in slow-wave rhythmic activity.
Measurements and Main Results
Median (interquartile range [IQR]) dominant frequency in cycles per minute (cpm) was similar for the cecum (2.4 cpm; IQR: 0.51 cpm) and left ventral colon (2.13 cpm; IQR: 0.16 cpm) and unchanged by either treatment (P > 0.074). Compared with saline, which was unchanged, detomidine reduced dominant power ratios for both cecum (0.45; IQR: 0.18) and left ventral colon (0.63; IQR: 0.35; P = 0.002). Detomidine decreased total power for the cecum in the 2–4 cpm frequency range from 55.0% (IQR: 4.4%) to 43.1% (IQR: 6.7%) and for the left ventral colon from 54.4% (IQR: 5.5%) to 27.3% (IQR: 9.3%; P < 0.087). Total power for the cecum was increased in the 8–12 cpm frequency range from 9.6% (IQR: 1.9%) to 18.5% (IQR: 6.6%; P = 0.0044) with detomidine. No change in frequency distribution was noted in controls (P > 0.08). Dominant power correlated with the rate of contractions measured ultrasonographically (P < 0.001).
Conclusions
Detomidine decreased dominant power ratios for both the cecum and left ventral colon and produced tachyarrhythmias in cecal slow-wave activity. The correlation of dominant power with intestinal contractions supports the clinical development of EIG to diagnose equine motility disorders.
Abbreviations
-
- cpm
-
- cycles per minute
-
- EGG
-
- electrogastrogram
-
- EIG
-
- electrointestinography
-
- IQR
-
- interquartile range
1 Introduction
Intestinal motility patterns are initiated in part by the omnipresent slow-wave activity produced by the interstitial cells of Cajal [1]. The frequency of the slow-wave myoelectrical activity is one of the main determinants of the rate of smooth muscle contraction, whereas the amplitude or power of the slow wave affects the strength of the contractions [2]. Noninvasive measurement of slow-wave myoelectrical activity of the intestines can be performed using skin surface electrodes, as has been used in people to objectively quantify gastric electrical activity and motility abnormalities [3-6]. Intestinal slow-wave recordings, called electrointestinography (EIG), are the summation of transmitted signals from different populations of pacemaker cells at multiple points in the intestines. The EIG waveform represents an average myoelectrical frequency as a measure of neuromuscular activity over time for a section of the intestine, rather than a corresponding rate of muscular contractions at a specific point in the gastrointestinal tract [7-10].
Visually analyzing the EIG waveform is not adequate for determining changes in slow-wave activity; therefore, Fourier transformation and power spectral density analysis techniques are commonly used to interpret the waveforms and isolate the signal of interest [7, 11]. The EIG-dominant frequency is one outcome measurement derived from this analysis and, based on direct comparisons with implanted strain gauges, is believed to represent the slow-wave frequency in the organ of interest [11]. The intensity or amplitude of the slow wave at the dominant frequency, called dominant power, has been shown to rise with increased regularity and amplitude of slow-wave activity [12]. Power can be influenced by electrode position, body wall thickness, and intestinal motility; therefore, a direct comparison between patients is not possible. Dominant power ratios are more commonly evaluated to compare EIG immediately before and after an intervention, such as a drug or test meal, to assess changes in contractility [13, 14].
Comparing the total power of the waveform for specific frequency ranges can also provide insight into the presence of slow-wave arrhythmias and further classify disturbances in slow-wave activity [15]. Bradyarrhythmias can result from a slower-than-normal rate of depolarization, correlating with reduced contractile activity of the intestines. Tachyarrhythmias may cause either increased activity or paresis if the slow-wave amplitude is insufficient to initiate contractions. Arrhythmias may also develop with ectopic pacemakers, resulting in a mixed arrhythmia. Other myoelectrical rhythm disturbances include a lack of a dominant frequency or a lack of an expected change in signal power [16]. Short rhythm disturbances may be observed in healthy patients, but prolonged periods of disturbance are associated with pathology [17]. Therefore, EIG study periods of 30–120 min are recommended to enhance the detection of rhythm disturbances and allow a sufficient number of waveforms to be collected for interpretation [18, 19].
In horses, EIG has been used to evaluate the effects of prokinetics and drugs that alter intestinal motility [20-23]. These analyses of equine EIG waveforms have previously focused on comparisons of changes in the amplitude of the entire waveform (i.e., total power) before and after intervention as a measure of the strength and rate of contractions or treatment effect. However, the ratio of dominant power, which is determined by the dominant waveform frequency, is the more commonly accepted parameter in human medicine to evaluate changes in motility determined by EIG [12]. In addition, the percentage of total power distributions over the total frequency range has not been reported in horses using multichannel EIG. Although changes in total power have been described in the cecum after jejunocecostomy, the current analysis was limited by the short duration of data collection and the use of a single lead [24]. A global picture of the changes in EIG waveform regarding dominant power ratios and frequency patterns and their response to medications and motility disturbances is needed to define the relationship between changes in the EIG and intestinal contractions in horses.
In people, catecholamines are known to be involved with slow-wave rhythm disruption in the stomach, which can be inhibited with nonselective adrenergic receptor antagonists [25]. In horses, cecal dominant frequencies and total power decreased after the administration of xylazine, corresponding with fewer cecal contractions [26]. Although EIG total power ratios over the entire frequency spectrum were decreased in the cecum and colon of horses treated with detomidine, changes in dominant frequency were not seen [21]. It is known that colon muscle spiking activity is inhibited by both xylazine and detomidine in horses, but the physiology of this drug may be more complex, as a brief period of clonic activity was reported shortly after the administration of detomidine [27, 28]. Further evaluations of the effects of alpha-2 agonists on slow-wave activity across the frequency spectrum are needed to better describe these changes and identify rhythm disturbances in horses.
The purpose of the current study was to evaluate a multichannel EIG obtained from horses and describe the effects of detomidine on slow-wave activity in the cecum and left ventral colon. The goal was to determine how detomidine affects dominant frequency, dominant power, total power, and frequency distribution compared with a saline control. It was hypothesized that detomidine would reduce dominant power ratios and total power in the segment of the frequency distribution associated with normal slow-wave rhythm. It was also predicted that detomidine would produce intestinal slow-wave arrhythmias, providing a mechanism for the changes in intestinal contractions observed in vivo. Finally, we hypothesized that the dominant power of the EIG waveform would correlate with the number of intestinal contractions seen with ultrasonography.
2 Materials and Methods
2.1 Subjects
Horses eligible for enrollment in the study were those of any full-sized breed, sex, and age >2 years. As power distributions across frequency ranges have not been studied in horses, the sample size was calculated based on previous evaluations of frequency activity in human electrogastrograms (EGGs) [9]. A minimum sample size of three horses was needed to provide a power of 80% with an alpha of 0.05. A convenience sample from the Charmany Equine Teaching Herd at the University of Wisconsin-Madison was selected to participate, with additional privately owned horses enrolled after obtaining informed consent from their owners. The protocol was approved by the Institutional Animal Care and Use Committee (Protocol #V005999).
Horses with a history of a colic episode in the previous 12 months were excluded. Before admission to the study, all horses underwent a physical examination and a transabdominal ultrasonographic examination of the abdomen to identify any evidence of systemic illness, preexisting gastrointestinal abnormalities, or evidence of previous abdominal surgery, which would exclude them from the study. In addition, the horses were not allowed to receive alpha-2 adrenergic receptor agonist or antagonist drugs or nonsteroidal anti-inflammatory medications in the 7 days before the study. Horses were not fasted and were turned out on pasture without diet or exercise restrictions before entering the study. Client-owned horses were allowed 12 h to acclimate after trailering before the start of the procedures.
2.2 Study Design
This was a randomized controlled trial, with horses assigned to the control (saline) or treatment (detomidine) group using a random number generatora. Each horse served as its own control, with measurements obtained in an identical manner before (baseline) and after (treatment) the administration of detomidine or the saline control. A total of four horses were assigned to the control group, and eight horses were assigned to the treatment group.
2.3 Instrumentation
Horses were restrained in stocks for instrumentation. The hair over a jugular vein was clipped, the skin was aseptically prepared, and a 14-Ga catheter was placed and secured with cyanoacrylate glue. The hair over the right flank and left ventral abdomen was clipped with a #40 blade. Transabdominal ultrasonography was performed with a 3-MHz transducer and ultrasonographic coupling gel to identify the cecum and left ventral colon in the right flank and left ventral abdomen, respectively [29]. The skin was washed for 5 min with antiseptic soapb using a surgical prep spongec, rinsed with tap water, and dried. The skin was then abraded with an abrasive geld and gauze for 20 passes to reduce the impedance between the electrodes and the skin.
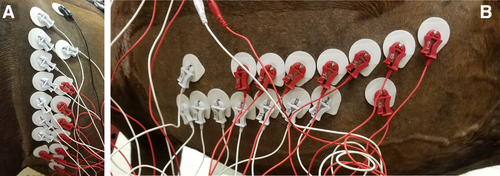
A small amount of conducting gele was applied to foam adhesive unipolar electrodesf, and the electrodes were applied to the skin with their self-adhesive pads. Instrumentation of the cecum comprised of 16 unipolar electrodes applied in two staggered horizontal rows along the vertical long axis, with an individual electrode placed cranial to serve as a ground. Instrumentation of the left ventral colon consisted of 16 unipolar electrodes placed in two horizontal rows along the long axis of the organ, from cranial to caudal. The distance between the short-axis electrodes (leads 1–7 and 9–15) was 15 cm, with the exception of leads 8 and 16, which were placed approximately 45 cm apart along the long axis of each organ (Figure 1). A multimeter was used to confirm that the skin impedance between each pair of electrodes was <3 mOhms [30]. The electrodes were allowed to equilibrate for 5 min before data collection. After equilibration, the leadsg were connected to each electrode and attached to the signal amplifierh and data acquisition systemi. The system was connected to a computer running proprietary software for data collection, analysis, and storagej. The hardware was set with a gain of 2000, the low-pass filter was set to 1.0 Hz, and the high-pass filter was set to 0.005 Hz. Data acquisition was set at a sample rate of 2000/s with an acquisition length of 30 min for baseline and treatment periods.
2.4 Data Collection
Both treatment groups had a baseline EIG recorded from the cecum and left ventral colon simultaneously for 30 min. Physical examination findings, including heart rate, respiratory rate, rectal temperature, mucous membrane color, capillary refill time, gastrointestinal borborygmi, and digital pulses, were recorded at times 0, 15, and 30 min of each EIG recording. In addition, transabdominal ultrasonography was used to visually record intestinal motility, where the electrodes were applied as a secondary determinant of changes in intestinal motility [21]. Cecal contractions were identified as deviations of the cecal wall from the body wall, whereas left ventral colon motility was evaluated by counting changes in sacculations [21]. The total number of contractions of the cecum and left ventral colon was counted over a 3-min period at times 0, 15, and 30 min of each EIG recording. These totals were divided by 3 to obtain a rate in contractions per minute for each timepoint.
Immediately after the baseline EIG recording, horses were administered either detomidine hydrochloridek or an equivalent volume of a 0.9% NaCl (saline) control. An IV bolus of 10 µg/kg detomidine, followed by a constant rate infusion of 20 µg/kg/h, was administered to horses in the treatment group [31]. Horses in the control group were administered saline in a similar manner with equivalent volumes. The EIG recording and physical and ultrasonographic examinations were repeated immediately after the bolus administration, as previously described.
After the completion of the second EIG, the instrumentation and IV catheters were removed. Horses that were sedated in the treatment group were muzzled and allowed to recover from sedation in a stall for 60 min before returning to normal turnout and diet. Horses in the saline control group were immediately returned to pasture.
2.5 Data Analysis
EIG signals were resampled at 1 sample/s. An infinite impulse response digital filter was used, with a variable Q setting of 0.707 using the proprietary softwarej. The waveform was further attenuated by using a high-pass (0.2 Hz) and low-pass (0.03 Hz) filter to remove frequency variations outside of the selected bandwidth. After being converted to a format for processingl, the data were exported and cleaned using the code “filloutliers” with “nearest” using the nearest nonoutlier value and “mean” to remove outliers of more than 3 SDs from the mean. A fast-Fourier transformation algorithm was used to calculate the frequency components, with the computation of the single-sided spectrum. After defining the frequency domains, the dominant power, dominant frequency, and total power for each channel during the baseline and treatment sessions were obtained. As the ratio of dominant power after and before the treatment has been associated with intestinal contractions, the dominant power ratios were compared to 1 to determine an increase (>1) or decrease (<1) in contractility [32].
Additional power spectral density analysis was used to determine the total power for specific frequency ranges in cycles per minute (cpm) (0.03–0.0333333 Hz [1.8–2 cpm]; 0.0333333–0.0666667 [2–4 cpm]; 0.0666667–0.1333333 Hz [4–8 cpm]; and 0.1333333–0.2 Hz [8–12 cpm]). The percentage of power distribution was then calculated using the total power in the specific frequency ranges divided by the total power of the entire waveform to determine relative changes in slow-wave activity [15]. The normal frequency range was defined as the range that contained the dominant frequency at baseline. Increases in the percentage of power in ranges above the normal frequency were considered tachyarrhythmias, whereas increased power in frequency ranges below the normal range represented a bradyarrhythmia [15].
2.6 Statistical Analysis
Data were analyzed using commercial statistical softwarem. Continuous variables were assessed for normality using the Shapiro–Wilk test. For descriptive purposes, normally distributed variables were described using mean (±SD), and nonnormally distributed variables were described as median (interquartile range [IQR]). As the EIG data were not normally distributed, a Friedman test was used for comparison between groups, with interactions for treatment and horse. Wilcoxon rank-sum exact tests with continuity correction were applied for post hoc evaluation of significant differences. Correlations between ultrasonographic contractions and dominant power were determined using a Spearman's rank correlation. Significance was set at p < 0.05.
3 Results
All horses completed the study without complications. Represented breeds included five Thoroughbreds, four American Quarter Horses, a Paint, a Tennessee Walking Horse, and a warmblood. The median age of the horses was 17 years (range: 7–21 years), and their median weight was 533 kg (range: 423–621 kg). Throughout the study, the mean ± SD heart rate (37 ± 8.79/min), respiratory rate (13.4 ± 4.14/min), and temperature (99.5°F ± 0.5°F) were within clinically acceptable reference ranges. Gastrointestinal borborygmi were recorded as present at all timepoints.
3.1 EIG Analysis
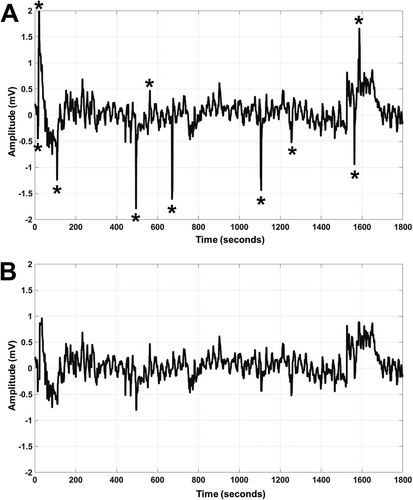
The dominant power was not altered after the application of the “filloutliers” algorithm (P value = 0.35), and the total power was also similar (P value = 0.052). Visual inspection after the application of the “filloutliers” algorithm identified a reduction in noise and motion artifacts for the waveforms (Figure 2). Dominant power was determined from the power spectral density tracing and compared as a ratio of treatment to baseline. The median dominant power ratios were then calculated for the cecum and left ventral colon for each horse. For the saline controls, no difference was noted in dominant power ratios between baseline and treatment timepoints for the cecum (0.96; IQR: 0.16) or left ventral colon (0.67; IQR: 0.06; P value > 0.11). In horses treated with detomidine, there was a significant reduction in dominant power ratios for both the cecum (0.45; IQR: 0.18; P value = 0.002) and left ventral colon (0.63; IQR: 0.35; P value = 0.002).
In the control group, no difference was found comparing the baseline dominant frequency for the cecum (2.6 cpm; IQR: 0.21 cpm) with treatment with saline (2.28 cpm; IQR: 0.24 cpm; P = 0.42). Similarly, no difference was found between baseline dominant frequency for the left ventral colon (2.03 cpm; IQR: 0.10 cpm) and after treatment with saline (2.04 cpm; IQR: 0.13 cpm; P = 0.42). No difference was found in the dominant frequency for both the cecum and left ventral colon in the treatment group when comparing the baseline (cecum: 2.25 cpm; IQR: 0.22 cpm; colon: 2.15 cpm; IQR: 0.08 cpm) with the treatment period (cecum: 2.3 cpm; IQR: 0.40 cpm; colon: 2.58 cpm; IQR: 0.22 cpm; P value = 0.074).
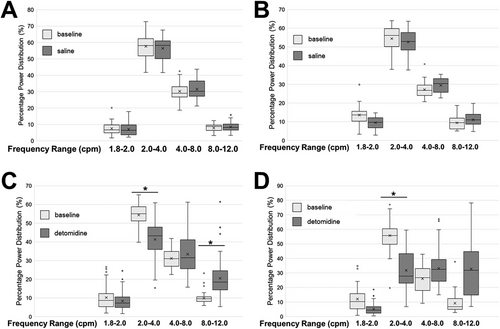
The percentage of power distribution in the EIG power spectral density tracing was calculated by dividing the total power in each frequency range by the total power of the waveform. The frequency range from 2 to 4 cpm was defined as the normal rhythm, based on the calculated dominant frequency. The percentage of total power in the frequency range of 2–4 cpm for the cecum decreased from 55.0% (IQR: 4.4%) to 43.1% (IQR: 6.7%; P = 0.0044) after treatment with detomidine, whereas the percentage of total power in the frequency range of 8–12 cpm increased from 9.6% (IQR: 1.9%) to 18.5% (IQR: 6.6%) (P = 0.0044) (Figure 3). For the left ventral colon, the percentage of total power in the frequency range of 2–4 cpm decreased from 54.4% (IQR: 5.5%) to 27.3% (IQR: 9.3%; P = 0.0087) after treatment with detomidine. Statistical significance was not reached for the frequency range of 8–12 cpm (baseline: 8.1%; IQR: 5.4%; treatment: 31.4%; IQR: 14.1%; P = 0.29). The percentage of total power distribution for the control group was unchanged in the frequency range of 2–4 cpm when comparing the baseline with saline treatments in the cecum (baseline: 55.8%; IQR: 7.1%; treatment: 58.3%; IQR: 5.9%) and left ventral colon (baseline: 56.1%; IQR: 4.3%; treatment: 51.7%; IQR: 2.7%). For the frequency ranges overall, the percentage of total power distribution for the control group was unchanged (P > 0.08).
3.2 Ultrasonographic Contractions and EIG
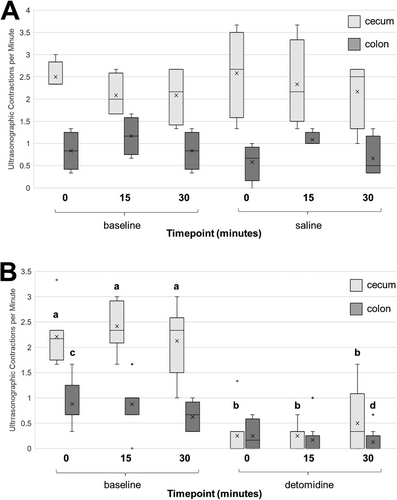
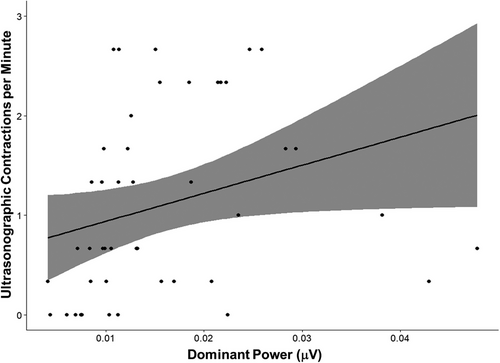
Ultrasonographic observations of cecal and left ventral colon motility in contractions per minute were unchanged for the saline-treated horses compared with the baseline at all timepoints (P > 0.95). Cecal motility was decreased after the administration of detomidine for all timepoints compared with the baseline observations (P < 0.045), whereas left ventral colon motility differed only when comparing baseline time 0 with time 30 after treatment (P = 0.032) (Figure 4). There was a significant relationship between the dominant power and the median number of cecal and left ventral colon contractions measured with ultrasonography for both the treatment and the control groups (rho = 0.478; P < 0.001) (Figure 5).
4 Discussion
The current study evaluated the clinical application of EIG and is the first to use multichannel EIG to describe the effects of detomidine on total power distribution and myoelectrical rhythms of the cecum and left ventral colon in horses. The frequency band for normal slow-wave activity was defined as 2–4 cpm for both the cecum and left ventral colon based on the dominant frequency, with approximately 55% of the slow waves falling within this frequency range at baseline. Treatment with detomidine reduced the percentage of time that slow waves were within this normal range and resulted in tachyarrhythmias, with increased percentages of total power in the higher frequency bands. In human EGGs, the percentage of total power in the 2–4 cpm frequency band is typically higher than in horses when compared with the total spectrum, with 65%–78% in the normal frequency range. In addition, less than 20% of the total power falls in the upper frequency ranges, which is representative of tachyarrhythmias [15, 16, 33, 34]. These discrepancies may result from intrinsic rhythm differences between species in the evaluated organs, as each is known to have an individual intrinsic slow-wave frequency.
Factors affecting slow-wave frequency and altering rhythmicity include the electrical activation of the cells of Cajal, alterations in ion channel activity, changes in sensitivity to muscular stretch, the effects of autonomic and enteric innervation, and hormonal or paracrine influences [35]. In horses, damage or loss of the interstitial cells of Cajal has been shown to result in intestinal paresis and disruption of slow-wave activation [36]. Similar findings are observed in people with gastroparesis, which produces chronic nausea and vomiting [37-39]. Recently, high-resolution gastric mapping has noted a correlation between the severity of human ECG abnormalities and gastrointestinal disease symptoms, including gastroparesis [40]. Further work would be needed to correlate the mechanistic relationship between changes in electrophysiology on EIG and diseases that cause gastrointestinal ileus in horses, but the correlation between the dominant power and ultrasonographic contractions in the current study provides support for the use of EIG in both clinical and research studies of equine motility disorders.
Detomidine reduced dominant power ratios, representative of intestinal contractions, in the horses treated with detomidine in this study. Our findings are consistent with a previous study evaluating multichannel EIG in the cecum and left ventral colon [21] and are supported by the correlation between EIG dominant power and intestinal contractility observed in the horses we evaluated. A study that assessed medetomidine with a single-channel EIG found reduced contraction amplitudes of the waveform, showing similarities in the effects on EIG power between different alpha-2 agonists [28]. It was expected that detomidine would inhibit motility patterns, as alpha-2 agonists have been shown to inhibit acetylcholine release through presynaptic receptors in the enteric ganglion [41]. In addition, a number of studies in horses have shown that intestinal contractions, spike bursts, and migrating motor complexes are decreased after the administration of either xylazine or detomidine [42-45]. Our results are consistent with these previous studies and provide additional information on slow-wave frequency distributions in vivo and the effects on motility produced by alpha-2 agonists.
The correlation between dominant power over the frequency gradient and ultrasonographic contractions in the current study is consistent with published data in people [46]. Intestinal slow-wave coupling depends on the presence of functional frequency gradients, which allow for normal patterns of propagation, including circumferential contractions and retrograde mixing [47, 48]. Motility is also known to be suppressed in dysrhythmias [49], providing a link between the electrophysiological abnormalities noted in the horses with tachyarrhythmias in the current study and the ultrasonographic changes in motility patterns. Frequency alone is not the only factor that correlates with normal slow-wave activity, as propagation abnormalities can occur at normal frequencies [50]. Future studies should evaluate propagation patterns and discoordination, which could possibly be measured with larger numbers of electrodes.
Motion artifacts in an EIG are commonly seen as short bursts of activity with large deviations from baseline, up to a few seconds in length. The amplitude of these muscular contractions is much higher than that of the electrical activity of intestinal slow waves. For comparison, skeletal muscle is recorded in the range of 1–5 mV compared with slow waves, which range from 50 to 200 µV [51]. Previous studies have used techniques where motion is deleted manually from the waveform [21] or relied on only bandpass filters, which are unable to remove artifacts that span all frequencies [52]. While effective in reducing some errors in the waveform, these methods have drawbacks, including a lack of consistency, a reduction in the total data available for analysis, and the inability to automate the process due to the size of the datasets being analyzed [53]. Methods to suppress motion artifacts have been used recently in human EGGs, employing mathematical estimation approaches to identify and cancel interference [40]. A similar methodological approach with an algorithm to remove artifacts was used in the current study, demonstrating a visual reduction of noise in the raw signal as well as a clearer peak in the frequency domain. Although a change in dominant power was not noted, larger deviations caused by motion were removed by the algorithm. Application of more advanced modeling tools that rely less on an estimated mean will help improve the quality of equine EIG analysis.
The current study implemented EIG recording using unipolar electrodes, which differs from other studies in horses that have used bipolar electrical recordings [21, 24, 26, 52]. Advantages of unipolar electrodes include the ability to record signals without direct tissue contact with the intestines and an omnidirectional recording for identification of global electrical activity [54, 55]. A limitation of unipolar electrodes is the need for an amplifier to discern low-amplitude waveforms [56]. Alternatively, bipolar leads are more sensitive to local activation and provide a more directional sensitivity to signal activation. They are also more readily amplified for identification against background noise but, because of this, they are more sensitive to directionality and require close contact with the tissue of interest [54, 57]. As the organs of interest in this study are not unidirectional in the nature of the flow of ingesta and a specific bowel segment was not targeted, the use of unipolar electrodes provides an advantage when attempting to record through the relatively thick equine body wall with the intestine positioned at a distance from the recording electrodes.
The use of computerized filters as well as mathematical algorithms was helpful in processing the data obtained in this study, but limitations remain due to the nature of mobile EIG recordings in large animals. The low signal-to-noise ratio results in significant contamination by artifacts and remains an issue in both equine and human mobile EIG [58, 59]. Not only is motion artifact an issue, but other organs have inherent rhythmic electrical activity that can be recorded by EIG, including the heart, diaphragm, and other intestinal organs [60]. The colon itself has a complicated slow-wave profile, with a range of pacemaker activities along its length [61]. Limiting the frequency range with bandpass filters provides some advantage in isolating the EIG waveform, but the complexity of physiological myoelectrical activity makes EIG analysis less than straightforward.
Additional limitations of the current study are characteristic of EIG recording in general. It is expected that the signal amplitude will decrease as the distance between the intestine and electrodes increases, whether due to the thickness of the body wall or intestinal movement [51]. Therefore, measurements in horses with thicker abdominal musculature or adipose layers may reduce the fidelity of the signal. The duration of the recording was similar to other studies and within recommendations in human practice, but longer recording times may produce a more reliable outcome, especially in patients with motility disturbances [18, 19]. However, the ability to record longer EIGs is a balance between time and the horse's temperament. Future directions may involve the use of a wireless multichannel EIG, which could allow for continuous recordings in a stall setting, as well as recording from a larger sample of horses to improve statistical power.
In conclusion, the current study provides evidence for the mechanistic role of detomidine in motility disturbances in the cecum and left ventral colon, with a reduction in EIG slow-wave amplitude noted by reduced dominant power, decreased power in the normal frequency range, and the development of tachyarrhythmias. The results demonstrate a correlation between EIG dominant power and intestinal contractions noted on ultrasound, providing support for the use of EIG to monitor motility disorders. The validation of EIG as a diagnostic tool for gastrointestinal disease in horses is still in its initial stages, as the value of a diagnostic test is based on its ability to direct therapy or provide a prognostic determination. Additional information regarding EIG technique and analysis procedures for clinical evaluation and recognition of slow-wave rhythm disturbances is also provided by the current study. Further research with a larger control population will confirm the normal frequency range for the cecum and colon and establish baseline frequencies for other organs. The ultimate goal would be to refine EIG as a diagnostic tool for naturally occurring motility disorders and as a monitoring technique to evaluate response to therapy in horses with gastrointestinal disease.
Author Contributions
A.S.M. contributed to the conception and design of the study, acquisition, analysis, and interpretation of data, drafting and revision of the article, and final approval of the version to be published. A.S.D.M. contributed to the conception and design of the study, acquisition, analysis, and interpretation of data, drafting and revision of the article, and final approval of the version to be published. J.K. contributed to the study design, analysis and interpretation of data, drafting and revision of the article, and final approval of the version to be published.
Conflicts of Interest
The authors declare no conflicts of interest.


