The feasibility of currency union in Gulf Cooperation Council countries: A business cycle synchronisation view
Abstract
This paper study the feasibility of a monetary union among Gulf Cooperation Council (GCC) countries, by measuring the evolution of economic integration among them. Considering the critical role of crisis and shocks in the integration process within the region, we determine whether GCC countries are characterised by a common business cycle. We suggest a different empirical approach that, unlike previous studies, allows one to endogenously detect structural changes in the comovement process between outputs. We apply a new measure for this region that is based on the time-varying coherence function. Such a measure not only detects comovement dynamics but also distinguishes these dynamics in terms of short- and long-term cycles. Additionally, we can test whether certain countries tend to be more synchronised. The main finding of this study is that not all GCC countries share a common short-term business cycle. However, in the long term, all country-pairs indicate a medium-level synchronisation in the most recent subperiods. The new role of the United Arab Emirates’ regional trade platform allows it to strengthen long-term business cycle comovement, thus differentiating it from other GCC country-pairs that have shown a decline in the last two subperiods.
1 Introduction
Regional economic integration in the Gulf region has improved in the last two decades, and we expect greater convergence in macroeconomic policy. This study empirically investigates the feasibility of creating a currency union among Gulf Cooperation Council (GCC) countries (i.e., Bahrain, Kuwait, Oman, Qatar, Saudi Arabia and the United Arab Emirates [UAE]), following closer monetary cooperation in recent years. One of the objectives of these countries is the establishment of a common currency the khaleeji. The political and economic will to create this single currency for all GCC countries is a subject of great interest. The similarities among these economics in terms of both economic structure and their attachment to the US dollar provide an additional argument for this proposed union. In addition, GCC countries have since December 2000 adopted an exchange-rate regime pegged to the US dollar—with the exception of Kuwait, which since May 2007 has repegged to an undisclosed weighted basket of international currencies. Indeed, these countries “have successfully maintained pegs among themselves for two decades despite their failure to meet a number of important OCA [optimum currency area] criteria” (Willett, Al-Barwani, & El Hag, 2010, p. 1716). Furthermore, these countries’ macroeconomic similarities have allowed for considerable harmonisation in terms of inflation rates (see Figure A5 in Appendix B).
One of the main determinants of the success of a monetary union is whether the common monetary policy set by a common central bank is suitable for all member countries. This suitability in turn depends on the degree to which business cycles are synchronised across the countries involved. “According to the classical OCA criteria, two countries or regions would benefit from forming a monetary union if they are characterised by high similarity of business cycles” (Babetskii, 2005, p. 106). For this reason, we need to determine the degree of business cycle synchronisation among GCC countries.
In a monetary union, an independent counter-cyclical monetary policy cannot be tailored to stabilise individual cyclical fluctuations. Since the seminal study by Mundell (1961), economics has identified different criteria by which to assess the welfare effects of a monetary union; factors mobility, wage and price flexibility, and similarity preferences among member countries need to be considered. Business cycle synchronisation among member countries is one of the pre-conditions of a monetary union: indeed, the lower the level of business cycle synchronisation among the countries looking to form a monetary union, the higher the costs of this union will be. The endogenous approach with an OCA (Frankel & Rose, 1998) considers that a monetary union affects the nature of domestic business cycles.1 The establishment of a currency union increases trade intensity, and this in turn leads to an increase in output correlation—and thus to an increase in business cycle synchronisation. The new economic geography stresses that trade integration may increase country-level specialisation, leading to lower business cycle synchronisation. Empirical studies dedicated to industrialised countries show that trade intensity increases business cycle comovement among them (Clark & Van Wincoop, 2001). For emerging and developing countries, research results are mixed (Calderon, Chong, & Stein, 2007). Differences in the patterns of specialisation and bilateral trade are the main explanations for these results. While trade among industrialised countries is largely of an intra-industry nature, in developing countries, interindustry trade tends to prevail. Consequently, the relationship between trade intensity and the alignment of business cycles is positive in the former case, but negative in the latter.
The introduction of a single GCC currency began with the establishment of a Monetary Union Committee in 2002; the underlying concept was born much earlier, however, with the GCC Charter and the Economic Agreement in 1981. Low regional intracountry trade constrained the related countries to postpone pursuance of this single currency until after the development of certain integration stages, including the Customs Union (launched in 2003) and the common market (2005). However, GCC countries rely heavily on expatriate labour. A labour market that features a Kafil (citizen guarantee) system creates a concentrations of foreigners in the private sector and citizens in the public sector. Labour immobility is compensated with a high foreign labour percentage of total employment (i.e., 55% in Bahrain and greater than 80% in Kuwait, UAE and Qatar). We can conclude that the labour market criteria were satisfied (Willett et al., 2010). The integration process seems to be very slow, but heading in the right direction. At the end of 2005, the GCC approved the convergence criteria, to ensure financial and monetary stability. The monetary criteria include inflation rates and sufficiency of foreign cash reserves, while the financial criteria include the ratio of the annual government finance deficit to gross national product (GNP), as well as the ratio of public debt to GNP.
The objective of this study was to assess the feasibility and desirability of creating a GCC currency union, based on a framework of OCA theory. Since Mundell (1961) first introduced the concept of the OCA, a vast body of literature has developed around it. Focusing on the relationships among potential OCA members, they examine the extent of trade, mobility of labour and capital, the risk-sharing system and similarities in terms of shocks and cycles. Without denying the importance of the first three criteria, we focus on the last one: it is generally accepted that comovement among business cycles is a crucial criterion in a country's decision to join a currency union.
We focus not only on the feasibility of a monetary union, but on which circumstances country-pairs best comove, and in which period. Relying on a new measure of synchronisation, we identify various subperiods in which comovement of business cycles change in the six GCC economies. We are interested in two types of cycles—namely, short and long term. These correspond to a 40-quarter cycle length (i.e., the Juglar fixed investment cycle of 7–11 years) and a 10-quarter cycle length (i.e., the Kitchin inventory cycle of 3–5 years), respectively.
A higher degree of business cycle comovement in the long run is a necessary condition of monetary union; on its own, however, it is not sufficient. A common monetary policy must include a short-term effect. The primary cost of adopting a common currency is the loss of monetary independence, but this loss is minimised as cycles synchronise across countries. This study is novel in three respects: (i) it examines the dynamics of economic integration among GCC countries; (ii) it differentiates between the short and long terms; and (iii) it provides for us the level of feasibility of each GCC country joining a monetary union.
The remainder of this paper is organised as follows. Section 2 presents stylised facts about GCC economic integration and the related literature. Section 3 explains the methodology adopted in this study. Section 4 analyses the main empirical results. Section 5 concludes.
2 Stylised Facts about GCC Economic Integration, and the Related literature
Even after three decades, the GCC has not yet reached its primary goal of creating a single market with a single currency. Compared to countries in the European Union (EU) or in East Asia (EA), the GCC group of countries is characterised by a low level of intra-GCC trade. However, this fact will not be decisive in the degree of business cycle synchronisation given their highly similar economic structure (i.e., they all rely heavily on the oil sector). Additionally, GCC governments intervene to regulate internal prices when the oil market is in recession.
Taking the OCA argument of Mundell (1961) as our starting point, we analyse the synchronisation characteristics of GCC countries, to determine the desirability and feasibility of establishing a currency union there. As stressed by Mundell (1961), the suitability of a common regional monetary policy requires that all countries share the same state (i.e., expansion vs. recession). This fact implies strong business cycle synchronisation—hence our interest in these OCA criteria.
It is possible that integration increases the degree of industrial specialisation, which could in turn lead to greater inconsistency in terms of business cycles. The effect of specialisation can be reduced if bilateral trade is essentially intraindustrialist rather than interindustrial. Frankel and Rose (1998) and Rose (2002) stress that economic integration stimulates the correlation of business cycles. This higher correlation rests on the intensification of bilateral trade among a specific group of countries. Fidrmuc (2004) argues that increased bilateral trade (i.e., intra-industrial) intensifies the degree of synchronisation of business cycles.
Compared to that on other regional integration experiences, the literature on the GCC monetary union is not abundant. In addition, the theoretical and empirical literature is not conclusive about business cycle synchronisation among GCC countries. One strand of literature uses a different empirical model to test the desirability of such monetary integration. Zaidi (1990) assesses the desirability of such a monetary union by examining the capacity to hold a common attitude towards inflation and unemployment, stating that “the requirement of [a] long-run balance-of-payments equilibrium under fixed exchange rates imposes constraints on domestic macroeconomic policies” (Zaidi, 1990, p. 764). The author shows that in response to unanticipated money growth, both the variance of real output and unanticipated money vary across the GCC economies; greater coordination is needed, if these economies are to achieve similar patterns of variability in monetary growth. Laabas and Limam (2002), whose work is based on G-PPP theory, argue that GCC countries are not yet able to satisfy all necessary preconditions for establishing a currency union. Basher and Fachin (2014) studied the demand for broad money in the GCC economies, and they conclude that there is a low level of desirability for a monetary union given the low-level homogeneity (i.e., poolability) in the monetary demand function. Based on a general equilibrium model, Mohamed and Irandoust (2014) suggest that the best strategy for GCC countries is to peg their common currency to special drawing rights (i.e., a US dollar/euro basket) to the US dollar.
The second strand of the literature proposes a test of monetary union desirability by examining business cycle synchronisation. The predominant empirical methodology in this strand is to use the structural vector autoregression (SVAR) model to analyse the effects of macroeconomic shocks, or the symmetry of shocks, to test monetary union feasibility (Abu-Qarn & Abu-Bader, 2008; Bayoumi & Eichengreen, 1994; Kandil & Trabelsi, 2012; Louis, Balli, & Osman, 2008). In particular, Eichler and Karmann (2011) focus on the feasibility of monetary union in five regions, and find that GCC countries have converged over time, in spite of the low level of symmetry of shocks. Interestingly, Rafiq (2011) quantifies, using a structural factor model, the existence of synchronous change among GCC countries. In fact, three countries—namely, Bahrain, Oman, and the UAE—share a common factors shocks for output fluctuations.
Kandil and Trabelsi (2012) conclude that GCC countries are still far from forming a viable monetary union; however, they find a subgroup—comprising Saudi Arabia, the UAE and Qatar—where correlations of underlying disturbances could help foster a monetary union. By undertaking an SVAR exercise, Jean Louis, Osman, and Balli (2010) test the feasibility of the US dollar as an anchor for the GCC currency. They find common inflationary responses to US monetary policy, but divergent responses for non-oil outputs. For this reason, they suggest that pegging the GCC currency to a basket that includes the euro and the US dollar might be an optimal choice.
Cevik (2014) identifies the degree of non-hydrocarbon business cycle synchronisation across GCC countries. Using an asymmetric band-pass filter and a mean-corrected concordance index, he finds a low heterogeneous level of business cycle synchronisation during the 1990–2010 period. That study's non-dynamic empirical methodology seriously affect its results, which were negatively affected (i.e., via skewed data) by the first Gulf war (i.e., the Kuwait invasion) in the early 1990s. Meanwhile, Djennas, Benbouziane, and Djennas (2013) evaluated the relative influence of each variable used, while taking into account extreme bound analysis. In addition, they used a wavelet technique to identify coherence between pairs, and to remove noise from business cycle index values. In their study, the overall period is decoupled exogenously into three subsample periods (i.e., 1980–89, 1990–99, 2000–11), to determine variations in business cycle index; we find the same subperiods in the study of Benbouziane, Djennas, and Cherif (2013). Djennas et al. (2013) stress not only that GCC countries diverge in terms of business cycles, but that divergence has attenuated since the global economic crisis. Willett et al. (2010) calculate an annual lagged correlation (based on one and two-year lags) and observe a low magnitude of divergence; moreover, the coefficients of a number of certain correlational pairs are negative. As the gross domestic product (GDP) of the GCC countries rely heavily on oil and gas export, those GDP values will fluctuate as the oil price changes; for this reason, any lagged correlation of GDP or related data will be weak. Using 10-year rolling window calculations of three year-to-year correlations between Saudi Arabia and each of five small countries, Willett et al. (2010) found low levels of business cycle correlation.
Benbouziane and Benamar (2010) tested the possibility of an OCA for the six GCC countries. They used a multivariate threshold autoregressive model to test the non-linear relationships that could exist among the studied economies. Furthermore, they observed the existence of two subgroups. The first subgroup comprised the UAE, Oman and Bahrain, while the second group comprised Saudi Arabia, Qatar and Kuwait. Marzovilla (2014) found two subgroups, divided on account of their economic structure. On one hand, there are countries that adopt a diversification strategy (i.e., the UAE, Bahrain, Qatar and Oman); on other hand, there are countries that strongly embrace the mining and oil sectors (i.e., Saudi Arabia and Kuwait). The two specialisation models adopted by the two groups seem to reduce intragroup economic cycle differences, but increase intergroup differences. The author suggests that the strategy of pegging to the US dollar seems to adversely affect GCC economics, given the divergence between the cycle of the GCC countries and that of the United States. For this reason, the use of a regime that pegs to a basket of currencies could help reduce pass-through. Therefore, these results must be interpreted with caution. First, the author takes the overall period as being homogenous, or exogenously chooses subperiods; however, the region has been known to sustain multiple crises and shocks. Second, there is a link of causality between diversification strategy and reduced business cycle synchronisation. Third, among the six countries exhibiting a high level of correlation in economic cycles, we find three countries that belong to different groups.
Benbouziane et al. (2013) analysed the relationship between business cycle synchronisation and some related variables (i.e., bilateral trade, trade openness, trade specialisation, economic specialisation, deposit interest rate differentials, official exchange-rate fluctuations, fiscal deficit differential, financial openness, monetary policy, current account balance, gross national savings as a percentage of GDP and oil exports). They identified the main determinants of business cycle synchronisation using extreme bound analysis. Their results show that the best candidates are Saudi Arabia, Qatar and the UAE. In addition, they compared business cycle synchronisation within country-pairs, in terms of evolution in time and degree of synchronisation; they did so using the wavelet method. With the second technique, an absence of coherence and convergence was found among the group of countries studied. Based on continuous wavelet analysis, Aloui, Hkiri, and Nguyen (2016) argue that real growth rates co-move in the majority of GCC economies in the short term (i.e., fewer than 5 years). Saudi Arabia and the UAE are also synchronised for the long term.
Our methodology outperforms those seen in the literature, in two main respects. First, by using our dynamic model, we can detect variability in the integration process. Second, we can divide variability in the synchronisation business cycle into two components (i.e., short and long term).
3 Empirical Methodology
Essentially, the feasibility of a monetary union depends on whether the common monetary policy will be suitable for all members, in the sense that all countries will need the same monetary policy (i.e., expansionist vs. restrictive). To achieve concordance, we check for business cycle synchronisation among all GCC country-pairs. If the business cycle in the short and the long term is synchronous across countries, this means that achieving a common monetary policy is feasible, and the desirability of a monetary union is high.
3.1 Methodology overview
The frequency approach method, when used with a time series, makes it possible to check instability in either time or frequency. In the frequency domain, correlation is defined as coherence between two components, interpreted as the squared linear correlation coefficient for each frequency of the spectra of two series. In the current study, we adopt the evolutionary spectral analysis introduced by Priestley (1965, 1996). Our empirical methodology is inspired by the work of Allegret and Essaadi (2011). Dynamics in regional economic integration can be detected by examining time-varying coherence, in either the long or short term. As these cycles synchronise, the monetary union will become less costly.
As Hallett and Richter (2006, p. 232) emphasise, the frequency domain approach improves upon previous analysis, in six respects. First, it does not depend on any particular detrending technique. Second, as the frequency approach identifies both short and long-term changes, their respective importance relative to business cycle frequencies (short vs. long cycles) remains clear. Third, a coherence measure generalises on simple correlation. Fourth, convergence or divergence periods are detected endogenously. Additionally, the frequency approach specifies whether convergence or divergence belongs to short or long-term cycles. Fifth, this approach is relevant to both stationary and non-stationary cases. Finally, the frequency domain simultaneously performs our time-varying analysis at different frequencies. Indeed, in so doing, we obtain the short, medium, and long-term behaviours of the generating process of the comovement series.
Essaadi and Boutahar (2010) introduce a new method by which to estimate time-varying coherence function (TVCF) for economic series. This method offers a more illuminating interpretation of coherence and develops a well-suited procedure for estimating the time-varying coherence of non-stationary time series. The choice of TVCF analysis in examining the dynamics of the synchronisation process is motivated by the presence of various crises (i.e., the 1973 oil shock, the Kuwait invasion, and the EMS crisis of 1992–93) and their important impact on GCC economies.
Our goal was to pinpoint the dates of change in comovements between two series, in two dimensions—namely, time and frequency. In the time domain, dynamic correlation can give us some responses to this issue, but the choice of window can seriously affect the dynamic correlation pattern (Essaadi, Jouini, & Khallouli, 2009). To overcome this limit, we propose a TVCF as a measure of comovement variability, using the frequency approach. TVCF estimates not only the degree of comovement over time but also behaviour within each frequency. Such a methodology is critical if we are to consider the specificity of the process of GCC integration. Relative to the experiences of the EU and EA, regional integration in the GCC has occurred within a shorter period, and is better supported by the local government. Stimulated by similarities in economic structure and affected by regional and international instability, the integration of GCC countries seems to follow a non-linear trajectory relative to other regional integration experiences. For this reason, employing the same empirical methodology as the EU case—such as the VAR approach—seems to be inappropriate. We need a measurement of synchronisation that takes into account the non-linearity of the integration process. The TVCF not only answers to this requirement but also improves our study by taking in account the short and long-term characteristics of this integration.
3.2 Evolutionary spectral analysis: definition
The evolutionary aspect of the spectrum relates to the non-stationarity in series, which follows an oscillatory process (Priestley, 1965, 1988, 1996):
 (1)
(1) ,
,  , and μX(w) a measurement. We conclude that the evolutionary spectral density of {Xt} is the function SX(w, t), defined as follows:2
 (2)
(2) . The variance of {Xt} at t is:
 (3)
(3) , be the spectral density functions and SXY(w) be the cospectrum. Each of the two series can be written as:
 (4)
(4) (5)
(5) (6)
(6)Equation (6) verifies this inequality coherence,  .
.
 is the coherence in the neighbourhood of w:
 (7)
(7) is an analogue to the coefficient of the correlation between two samples and is interpreted as it.
3.2.1 Evolutionary cross-spectra (SXY(w, t))
 (8)
(8) (9)
(9) and
and  denote, respectively, the families of the oscillatory
  and
and  . We define the evolutionary power cross-spectrum at t with respect to the families
  and
and  , dHXY(w, t), by:
 (10)
(10) (11)
(11) (12)
(12) (13)
(13) (14)
(14)3.2.2 Estimation of the coherence of the non-stationary spectra
 (15)
(15)These statistics allow us to calculate the time-varying cross-amplitude in the following manner:
 (16)
(16) (17)
(17)3.3 Time-varying coherence test
Some techniques have been developed to test multiple structural breaks. We adopted the tests of Bai and Perron (1998, 2003a, 2003b) to detect a mean shift in TVCF. Using GAUSS software, we obtained estimates by running the codes of Bai and Perron. The selection of this type of model was motivated by the TVCF characteristics. Indeed, analysis of the graphical patterns of these statistics (see Appendix A) indicated that it is affected only by breaks in the mean. Using Bai and Perron (1998) allowed us to endogenously determine break-point dates, when the changes in coherence between series were significant. We are interested in the break point in the coherence between two economies. The break point is defined as the change in the underlying relationship of the two economies, and it occurs in response to an exogenous event or a change in economic policy.
3.3.1 The model and estimators
 (18)
(18) ,
,  and
and  , where T is the sample size.
  is the TVCF in the neighbourhood of the wj frequency. μi are the means, and ut is the disturbance at time t. The break points (T1, …, Tm) are explicitly treated as unknown. Based on the ordinary least squares (OLS) principle Bai and Perron (1998), we estimated the vector of the regressor's coefficients μj
  by minimising the sum of the squared residuals
 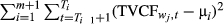 . Let
. Let  denote the resulting estimate. Substituting it into the objective function and denoting the resulting sum of squared residuals as
  , the estimated break-point dates
  are such that:
 (19)
(19) such that
  , where O takes some value.3
3.3.2 Test statistics and the model selection criteria
 (20)
(20) is the number of unknown parameters. The author demonstrates that, for a normal sequence of random variables with shifts in the mean, the number of breaks can be consistently estimated.
Bai and Perron (1998) introduced some asymptotic critical values for the arbitrary small positive number  and the maximum possible number of breaks (M):
  ,
,  ,
,  , and
, and  . For our empirical computation, we choose
  and we used the algorithm of Bai and Perron (1998, 2003b) to obtain global minimizers of the squared residuals.
We estimated time-varying coherence to explore the dynamic properties of the cyclical component of the convergence process. These statistics will provide a measure of persistence of comovement in the region for each country-pair. We also investigated whether an international economic crisis and/or regional political tension has had any impact on the degree of business cycle convergence, by endogenously testing break-point dates through the use of the Bai and Perron test.
4 Empirical Results
4.1 Data
This section focuses on synchronisation non-linearity. We chose real GDP quarterly frequency, in order to more clearly disentangle common shocks from spill-over effects as the source of synchronisation. From an economic standpoint, detrending with non-parametric filters—such as the Hodrick–Prescott (HP) filter—is more appropriate to the proxy business cycle than to the growth rate. We used the conventional HP filter with the lambda (λ) value of 1,600 for quarterly frequency data.
We used quarterly data for the six GCC countries namely: Bahrain, Kuwait, Oman, Qatar, Saudi Arabia and the UAE. Annual nominal GDP and quarterly “industrial production, manufacturing, non-durable manufacturing, petroleum and coal products, crude petroleum products, index” data are extracted from the International Financial Statistics web site. Then, we disaggregated each GDP series using the method of Chow and Lin (1971), along with the aforementioned index to produce a proxy for the variability of economic activity for different quarters. We used a filtered GDP series as a proxy for real outputs. The choice of proxy to interpolate data was motivated by the GCC countries’ heavy dependence on oil income. Hydrocarbon industries represent more than 80% of total government revenue, and the hydrocarbon sector represents 50% of the region's GDP. The technique of transforming annual data is used extensively in several studies, including that of Benbouziane and Benamar (2010). The sample period covers 1965Q1–2014Q4 for Saudi Arabia and Kuwait, 1976Q1–2014Q4 for Bahrain, 1975Q1–2014Q4 for Oman and Qatar, 1973Q1–2014Q4 for the UAE. All data were seasonally adjusted using the X12ARIMA method. We estimated comovement between each country-pair using a TVCF, as presented below. Note that for the evolutionary spectral estimation, we lost 10 observations at the beginning and another 10 at the end; we therefore applied the test of Bai and Perron to T−20. Synchronisation non-linearity was inspected for the following frequencies: π/20 and π/5 (see Tables A1 and A2 in Appendix C).
4.2 Results
To analyse the dynamics inherent in business cycle synchronisation, two types of cycles were considered: the 10-year Juglar fixed investment cycle and the 2.5-year Kitchin inventory cycle; these correspond to the frequencies of  and
and  , respectively. The first frequency refers to the long-term cycle, while the second stresses short-term characteristics. The stability of the business cycle synchronisation was studied for the two frequencies, by taking into account two indicators. The first is the graphical pattern of the evolutionary spectral analysis of the filtered GDP for each GCC country included in our sample. The second is an extension of the methodological approach of Essaadi and Boutahar (2010) to endogenously test for the presence of a break point in the mean for each bilateral comovement. As discussed above, we estimated the time-varying coherence statistic at a bilateral level in order to determine the degree of each business cycle synchronisation between each economy and to those of other countries. Use the time-varying coherence statistic makes it possible to check the variability of this synchronisation in time. Loosely speaking, we tested whether business cycle synchronisation increased or decreased during the study period.
The evolutionary spectral analysis graphical patterns of the GCC countries’ business cycles (See Appendix A) exhibit three main findings. First, Kuwait's business cycles (long and short term) were greatly affected in the 1987–93 period, due to the first Gulf war (i.e., the Kuwait invasion); for this reason, we propose a second figure for the two cycles, without the Kuwait cycles (Figures A2 and A4 in Appendix A). Second, we confirmed the dynamic change in GCC countries’ business cycles. Third, we found a common reaction of the business cycles of all countries in the region after the 2008 crisis. The graphical pattern for the Juglar cycle shows less variability than the Kitchin cycle, but it is still of a large magnitude. Excess variability was detected in the vicinity of 2001 and 2008 (Figure A4 in Appendix A). The Kitchin cycle (see Figure A3 in Appendix A) exhibits a pattern similar to that for the Juglar cycle. After 2008, the entire group converges. One possible explanation for this result is that the similar economic characteristics across these countries offer “fertile ground” for business cycle synchronisation, especially for shorter cycles. The graphical patterns of the annual GCC inflation rate, GDP deflator, and consumer price index (CPI; Figures A5 and A6 in Appendix B) show a large convergence of inflation in all GCC countries, essentially in the last decade. From the graphical pattern, it seems that GCC economies follow a common regional cycle, and that their business cycles are seriously affected by external shocks.
Appendix C offers a more explicit analysis of GCC business cycles’ synchronisation. The tables in the appendix resume analysis of variability in the economic synchronisation in GCC countries, for all country-pairs. The studied levels of variability were detected endogenously. We see in the two tables that two break-point dates—namely, 2001Q2 and 2007Q2—occur more frequently than others. These two dates seem to correspond to external rather than internal shocks. The coherence test results are very promising: all country-pairs show very high coherence for the short-term business cycle in the last period. For all country-pairs, the coherence levels in the short cycle (Kitchin cycle) is largely greater than 0.5 (exceeding 0.7).4 This fact strengthens our assertion regarding the feasibility of a common GCC monetary policy. From this standpoint, it is appropriate for the GCC countries to build a monetary union. However, the results for the long term are surprisingly different: for only two country-pairs (i.e., Bahrain–Kuwait and Bahrain–UAE) do the coherence levels for the last periods exceed 0.5. After 2007Q1, all country-pairs—except those involving the UAE see a sharp drop. Interestingly, for all country-pairs involving the UAE, the increase in the Juglar cycles may have occurred because of the new regional trade status of the UAE.
Overall, the results in Appendix C are very promising, in terms of confirming the feasibility of a viable GCC monetary union; this finding runs counter to those of other studies (Kandil & Trabelsi, 2012). This divergence can be explained by the dynamic view adopted by our analysis, and how our analysis tested separately short and the long-term cycles. On the other hand, our finding is in line with Aloui et al. (2016), who employed a similar empirical methodology (i.e., decompose synchronisation series into time and frequencies). Nonetheless, while we found no common long-term business cycle between Saudi Arabia and the UAE, we found a significant increase in synchronisation from 0.22 to 0.37. Nevertheless, the reduced business cycle synchronisation over the long term raises more questions about the risk inherent in a GCC monetary union. The absence of long-term synchronisation aligns with the results of Arfa (2012), who concludes that there is no business cycle synchronisation among the GCC countries in the 1970–2007 period. Synchronisation in the short-term cycle in the region is driven by external and international factors, and by virtue of similarities across their economic characteristics. Certainly, a common monetary policy does require a high level of business cycle synchronisation, but this alone will not guarantee viability.
In spite of Saudi Arabia being the largest economy in the region, its participation in intracountry trade is very low5 (Dar & Presley, 2001). However, the authors suggest that the private sector can drive the process of regionalism among these economies. Indeed, Buiter (2008) argues that the viability of such a “monetary union is not just a technical economic, financial or monetary issue. It represents a very significant constitutional and political change” (Buiter, 2008, p. 606). The region needs to improve local institutions and create supranational institutions that drive regional integration. For this purpose, it seems that independent central banks within the region are essential.
Admittedly, it will be difficult to establish a currency union in the GCC, given the great wealth disparities there. It is expected to be an evolutionary process that begins with policy dialogues and reviews, while a variety of exchange-rate systems in the region are maintained. (Kuwait has changed its attachment to the US dollar, and Oman said in 2006, it was opting out from the US-dollar peg.) It is clear, however, that there is a growing eagerness among policymakers and business leaders alike to accelerate regional integration and to find an appropriate way forward. This will gradually yet unequivocally lead to the “next steps” in creating an OCA.
5 Conclusion
In this paper, we proposed a new measure of business cycle synchronisation, to assess the feasibility of a Gulf Cooperation Council (GCC) monetary union. Our main finding is that not all GCC countries have a synchronised business cycle in the long term. However, for the short term, all GCC country-pairs show a high level of synchronisation in the most recent subperiods. On the one hand, the United Arab Emirates’ (UAE's) new role in the regional trade platform has allowed it to strengthen the long-term business cycle comovement. On the other hand, other GCC country-pairs not involving the UAE have shown a decline in the two most recent subperiods. With respect to the other criteria; however, a GCC monetary union does not appear to be feasible. Therefore, a high level of short-term business cycle synchronisation does appear to offer the promise of regional integration. Overall, given that the countries within the region do seem to demonstrate a positive synchronisation trend, taken together with their integrates labour markets and common economic structures and cultures, establishing a common currency does appear to be within reach.
However, these results must be interpreted with caution, for two main reasons. On one hand, as suggested by the recent world economic crisis, business cycle synchronisation in the GCC seems still to be driven by external shocks, rather than by an autonomous regional process. Even if the GCC's trade linkages today with the Group of three countries (Japan, USA and China) are less important than they previously have been, the GCC remains vulnerable to international economic fluctuations, as seen with the recent fall in oil prices. On the other hand, countries may have different initial responses to shocks and react symmetrically to shocks with one or two period lags. For this reason, further business cycle synchronisation studies are needed, which test the reaction of each country to different shocks; such research would help affirm the feasibility of a monetary union in the region. In addition, the region must sustain the trend of positive synchronisation by introducing additional reforms—especially with regard to monetary authority, as a central bank must be independent, if it is to assist in establishing strong regional institutions.
Notes
Appendix A
Evolutionary Spectral Density of the Gulf Cooperation Council business cycle

Figure A1 Estimation of evolutionary spectral density of Gulf Cooperation Council business cycle for 10 years (π/20) [Colour figure can be viewed at wileyonlinelibrary.com]

Figure A2 Estimation of evolutionary spectral density of Gulf Cooperation Council business cycle without Kuwait for 10 years (π/20) [Colour figure can be viewed at wileyonlinelibrary.com]

Figure A3 Estimation of evolutionary spectral density of Gulf Cooperation Council business cycle for 2.5 years (π/5) [Colour figure can be viewed at wileyonlinelibrary.com]

Figure A4 Estimation of evolutionary spectral density of Gulf Cooperation Council business cycle without Kuwait for 2.5 years (π/5) [Colour figure can be viewed at wileyonlinelibrary.com]
Appendix B
Annuel Gulf Cooperation Council inflation rate

Figure A5 Annuel Gulf Cooperation Council inflation rate, GDP deflator [Colour figure can be viewed at wileyonlinelibrary.com]

Figure A6 Annuel Gulf Cooperation Council inflation rate, consumer price [Colour figure can be viewed at wileyonlinelibrary.com]
Appendix C
Variability in the Bilateral Business Cycle Synchronisation
| Estimators |

|

|

|

|

|
||
|---|---|---|---|---|---|---|---|
| Bahrain and Kuwait | Break dates | 1985Q4 | 1990Q4 | 1995Q4 | 2000Q4 | 2007Q2 | |
| Coefficients | 0.5440 | 0.3107 | 0.6066 | 0.4404 | 0.8011 | 0.5035 | |
| Standard errors | 0.0226 | 0.0277 | 0.0277 | 0.0277 | 0.0242 | 0.0277 | |
| Bahrain and Oman | Break dates | 1984Q2 | 1994Q3 | 2002Q2 | 2007Q2 | ||
| Coefficients | 0.4056 | 0.7500 | 0.3337 | 0.7764 | 0.4532 | ||
| Standard errors | 0.0292 | 0.0224 | 0.0257 | 0.0320 | 0.0320 | ||
| Bahrain and Qatar | Break dates | 1983Q4 | 1989Q3 | 1994Q3 | 2002Q1 | 2007Q2 | |
| Coefficients | 0.5320 | 0.8778 | 0.7027 | 0.2292 | 0.7709 | 0.4604 | |
| Standard errors | 0.0268 | 0.0263 | 0.0282 | 0.0230 | 0.0275 | 0.0282 | |
| Bahrain and Saudi Arabia | Break dates | 1984Q1 | 1989Q2 | 1994Q4 | 2000Q2 | 2007Q2 | |
| Coefficients | 0.5535 | 0.8855 | 0.7543 | 0.2096 | 0.7007 | 0.3984 | |
| Standard errors | 0.0242 | 0.0253 | 0.0247 | 0.0247 | 0.0219 | 0.0259 | |
| Bahrain and UAE | Break dates | 1983Q4 | 1994Q2 | 1999Q2 | 2004Q3 | ||
| Coefficients | 0.5343 | 0.8252 | 0.4563 | 0.2556 | 0.5510 | ||
| Standard errors | 0.0246 | 0.0178 | 0.0258 | 0.0252 | 0.0207 | ||
| Oman and Kuwait | Break dates | 1987Q2 | 2000Q2 | 2007Q1 | |||
| Coefficients | 0.5255 | 0.3723 | 0.8061 | 0.3656 | |||
| Standard errors | 0.0219 | 0.0192 | 0.0266 | 0.0302 | |||
| Qatar and Kuwait | Break dates | 1983Q4 | 1990Q1 | 1995Q2 | 2000Q3 | 2007Q1 | |
| Coefficients | 0.5962 | 0.3445 | 0.5825 | 0.3882 | 0.8279 | 0.3619 | |
| Standard errors | 0.0255 | 0.0260 | 0.0283 | 0.0283 | 0.0255 | 0.0283 | |
| Saudi Arabia and Kuwait | Break dates | 1974Q1 | 1980Q4 | 1998Q4 | 2005Q3 | ||
| Coefficients | 0.5346 | 0.3208 | 0.5220 | 0.7153 | 0.4420 | ||
| Standard errors | 0.0354 | 0.0354 | 0.0217 | 0.0354 | 0.0354 | ||
| UAE and Kuwait | Break dates | 1980Q4 | 1994Q2 | 1999Q4 | |||
| Coefficients | 0.3037 | 0.5398 | 0.2898 | 0.4862 | |||
| Standard errors | 0.0332 | 0.0211 | 0.0332 | 0.0220 | |||
| Oman and Qatar | Break dates | 1984Q3 | 1993Q1 | 2001Q4 | 2007Q1 | ||
| Coefficients | 0.5860 | 0.8076 | 0.2410 | 0.7791 | 0.4618 | ||
| Standard errors | 0.0228 | 0.0210 | 0.0207 | 0.0268 | 0.0268 | ||
| Oman and Saudi Arabia | Break dates | 1982Q3 | 1989Q1 | 1994Q2 | 2000Q3 | 2007Q1 | |
| Coefficients | 0.5105 | 0.8285 | 0.6657 | 0.2276 | 0.7422 | 0.3075 | |
| Standard errors | 0.0283 | 0.0254 | 0.0283 | 0.0259 | 0.0254 | 0.0283 | |
| Oman and UAE | Break dates | 1984Q4 | 1994Q1 | 2003Q1 | |||
| Coefficients | 0.4840 | 0.7793 | 0.2455 | 0.4399 | |||
| Standard errors | 0.0264 | 0.0237 | 0.0241 | 0.0237 | |||
| Qatar and Saudi Arabia | Break dates | 1982Q3 | 1993Q2 | 2000Q2 | 2007Q1 | ||
| Coefficients | 0.6651 | 0.8680 | 0.2698 | 0.7576 | 0.3121 | ||
| Standard errors | 0.0266 | 0.0186 | 0.0231 | 0.0235 | 0.0266 | ||
| Qatar and UAE | Break dates | 1982Q3 | 1993Q2 | 2002Q3 | |||
| Coefficients | 0.5666 | 0.8621 | 0.2589 | 0.4497 | |||
| Standard errors | 0.0301 | 0.0210 | 0.0226 | 0.0220 | |||
| Saudi Arabia and UAE | Break dates | 1980Q4 | 1994Q2 | 1999Q4 | |||
| Coefficients | 0.4015 | 0.8322 | 0.2247 | 0.3740 | |||
| Standard errors | 0.0308 | 0.0196 | 0.0308 | 0.0204 |
| Estimators |

|

|

|

|

|
||
|---|---|---|---|---|---|---|---|
| Bahrain and Kuwait | Break dates | 1983Q2 | 1989Q2 | 1994Q2 | 2001Q1 | 2007Q2 | |
| Coefficients | 0.4149 | 0.6676 | 0.8513 | 0.4072 | 0.8335 | 0.7035 | |
| Standard errors | 0.0270 | 0.0246 | 0.0270 | 0.0232 | 0.0241 | 0.0270 | |
| Bahrain and Oman | Break dates | 1984Q2 | 1994Q3 | 2001Q2 | |||
| Coefficients | 0.5960 | 0.8364 | 0.5337 | 0.8552 | |||
| Standard errors | 0.0134 | 0.0103 | 0.0126 | 0.0099 | |||
| Bahrain and Qatar | Break dates | 1983Q2 | 1992Q3 | 2000Q4 | 2007Q2 | ||
| Coefficients | 0.5609 | 0.8423 | 0.5716 | 0.8461 | 0.7290 | ||
| Standard errors | 0.0243 | 0.0179 | 0.0189 | 0.0213 | 0.0243 | ||
| Bahrain and Saudi Arabia | Break dates | 1996Q1 | 2001Q1 | ||||
| Coefficients | 0.5310 | 0.3561 | 0.7586 | ||||
| Standard errors | 0.0169 | 0.0320 | 0.0213 | ||||
| Bahrain and UAE | Break dates | 1983Q2 | 1993Q3 | 1998Q3 | 2007Q2 | ||
| Coefficients | 0.5318 | 0.8099 | 0.4581 | 0.8376 | 0.7390 | ||
| Standard errors | 0.0214 | 0.0150 | 0.0214 | 0.0162 | 0.0214 | ||
| Oman and Kuwait | Break dates | 1983Q4 | 1989Q1 | 1994Q2 | 2001Q2 | 2006Q3 | |
| Coefficients | 0.3739 | 0.6467 | 0.8689 | 0.2101 | 0.7536 | 0.8647 | |
| Standard errors | 0.0164 | 0.0182 | 0.0182 | 0.0158 | 0.0182 | 0.0174 | |
| Qatar and Kuwait | Break dates | 1988Q3 | 1996Q1 | 2001Q2 | |||
| Coefficients | 0.3478 | 0.7009 | 0.4330 | 0.7969 | |||
| Standard errors | 0.0204 | 0.0250 | 0.0299 | 0.0207 | |||
| Saudi Arabia and Kuwait | Break dates | 1980Q1 | 1987Q2 | 1994Q1 | 2001Q1 | ||
| Coefficients | 0.8212 | 0.1367 | 0.6677 | 0.2575 | 0.7617 | ||
| Standard errors | 0.0141 | 0.0187 | 0.0194 | 0.0190 | 0.0150 | ||
| UAE and Kuwait | Break dates | 1980Q4 | 1987Q4 | 1993Q2 | 1998Q4 | ||
| Coefficients | 0.7008 | 0.4692 | 0.7291 | 0.4358 | 0.7848 | ||
| Standard errors | 0.0252 | 0.0223 | 0.0252 | 0.0252 | 0.0161 | ||
| Oman and Qatar | Break dates | 1984Q2 | 1992Q2 | 1997Q4 | 2004Q4 | ||
| Coefficients | 0.2227 | 0.8264 | 0.6805 | 0.5520 | 0.8841 | ||
| Standard errors | 0.0225 | 0.0211 | 0.0254 | 0.0225 | 0.0217 | ||
| Oman and Saudi Arabia | Break dates | 1989Q4 | 1996Q3 | 2001Q4 | |||
| Coefficients | 0.2844 | 0.5968 | 0.2251 | 0.8517 | |||
| Standard errors | 0.0165 | 0.0224 | 0.0255 | 0.0180 | |||
| Oman and UAE | Break dates | 1983Q4 | 1993Q2 | 2001Q3 | |||
| Coefficients | 0.3466 | 0.8423 | 0.5298 | 0.8689 | |||
| Standard errors | 0.0186 | 0.0154 | 0.0165 | 0.0145 | |||
| Qatar and Saudi Arabia | Break dates | 1984Q3 | 1989Q4 | 2001Q1 | |||
| Coefficients | 0.4835 | 0.2664 | 0.4777 | 0.7525 | |||
| Standard errors | 0.0300 | 0.0353 | 0.0241 | 0.0241 | |||
| Qatar and UAE | Break dates | 1986Q1 | 1992Q4 | 1999Q3 | |||
| Coefficients | 0.3160 | 0.8668 | 0.4563 | 0.7937 | |||
| Standard errors | 0.0205 | 0.0234 | 0.0234 | 0.0170 | |||
| Saudi Arabia and UAE | Break dates | 1980Q4 | 1989Q2 | 1994Q4 | 2004Q3 | ||
| Coefficients | 0.6075 | 0.1407 | 0.4264 | 0.6634 | 0.8250 | ||
| Standard errors | 0.0237 | 0.0191 | 0.0237 | 0.0178 | 0.0200 |