Controlled randomized study comparing the cardiovascular profile of everolimus with tacrolimus in renal transplantation
Summary
Left ventricular hypertrophy (LVH) regression after kidney transplantation may be influenced by immunosuppression. In a 24-month open-label, multicenter, phase-IV study, 71 kidney allograft recipients without previous acute rejection, showing eGFR >40 ml/min and proteinuria <500 mg/day and between 6 months and 3 years post-transplantation, were randomized to receive everolimus (EVR) + mycophenolic acid (MPA) or were maintained on tacrolimus (TAC) + MPA. The aim was to assess whether the conversion to EVR could reduce left ventricular mass index (LVMi) at month-24. LVMi at month-24 decreased without differences between groups (TAC: 54.0 vs. 48.2 g/m2.7; EVR: 53.4 vs. 49.4 g/m2.7). The LVH prevalence at baseline and month-24 was 59.4% and 40.6% in TAC group and 57.1% and 50.0% in EVR group. EVR conversion was associated with nearly disappearance of concentric LVH and concentric remodeling pattern. The procollagen type I N-terminal propeptide at month-24 showed greater reduction in EVR group (51.6 vs. 58.2 mg/l; P = 0.004). Conversion from TAC to EVR was associated with a significant improvement of eGFR (P = 0.0315, ancova). Adverse events were similar between groups without rejection episode or graft loss. Conversion from TAC to EVR did not further reduce LVMi after 24 months, although its effect on concentric LVH deserves further investigation (NCT01169701).
Introduction
Cardiovascular disease (CVD) is the leading cause of morbidity and mortality in kidney transplant recipients. It has been observed that nearly 40% of patients have a cardiovascular event 3 years after transplantation 1. Left ventricular hypertrophy (LVH) is a risk factor for heart failure and death 2. The prevalence of LVH has been reported to be as higher as 60% at 1 year after kidney transplantation 3. There are several patterns of LVH, but the most common described are the concentric LVH in response to the pressure overload, and the eccentric LVH in response to volume overload 4.
Immunosuppression based on calcineurin inhibitors (CNI) is the cornerstone of maintenance regimens in renal transplantation. CNIs are effective for preventing acute rejection, although they have been associated with chronic renal dysfunction, dyslipidemia, hypertension, and diabetes which contribute to increase cardiovascular (CV) morbidity 5-7. Main strategies explored to overcome CNI nephrotoxicity are CNI minimization and conversion to mTOR inhibitors (mTORi) 8, 9. Conversion to mTORi may increase acute rejection risk; although it could be reduced if sensitized patients or patients that were already treated for severe acute rejections are excluded. On the other hand, conversion from CNI to mTORi in patients with estimated glomerular filtration rate (eGFR) >40 ml/min and low proteinuria is associated with renal function improvement 9.
Calcineurin inhibitors treatment has been associated to the development of cardiac hypertrophy and myocardial fibrosis due to a stimulation of both circulating and local renin–angiotensin system (RAS). Nonetheless, mTOR drugs may attenuate the angiotensin II-induced increase in protein synthesis by blocking phosphorylation of the p-70S6 protein involved in cardiac growth 10 In this sense, some studies reported the use of SRL or everolimus (EVR) as a potential therapeutic tool to regress cardiac hypertrophy and improve cardiac function 11, 12. For example, Paoletti et al. 13 showed the efficacy of the use of EVR plus a reduced exposure of cyclosporine in regressing LVH in KT recipients. However, previous studies on LVH regression in kidney allograft recipients treated with tacrolimus (TAC) and converted to EVR have been observational or have shown controversial results 11, 14, 15.
Therefore, the aim of this clinical trial was to assess whether in renal allograft recipients receiving maintenance immunosuppression therapy with TAC and MMF/MPA, conversion to EVR is associated with reduction of LVH at 24 months.
Materials and methods
Study design
This was a 24-month, phase IV, parallel-group, open-label, randomized, multicenter trial study, conducted from August 2010 to March 2014. A total of nine centers participated in Spain. Renal transplant recipients were enrolled by the investigators, and after providing written informed consent, they were randomized in a 1:1 ratio to remain on the TAC regimen (Prograf® or Advagraf®) or to convert to EVR regimen both in combination with mycophenolic acid (Myfortic®, recommended dose 1440 mg/day; CellCept®, recommended dose 2000 mg/day). Treatment with steroids at baseline was allowed according to the routine clinical practice. Thus, patients with and without steroid treatment were included in the study. However, they were not allowed to withdraw or modify steroid dose along the study, unless justified for safety reasons.
Patients randomized to EVR arm were converted as follows: starting dose (day 1) of EVR was 2 mg in the evening, maintaining the full dose of Prograf® in the morning and reducing it to 50% in the evening; or Advagraf®, 75% of the dose was administered in the morning. On days 2 and 3, 2 mg of EVR was administered in the morning and 2 mg in the evening, without TAC. On days 4–5, the EVR trough levels were determined and adjusted between 5 and 8 ng/ml.
The study was undertaken in accordance with the principles of Good Clinical Practice and the Declaration of Helsinki following approval by the institutional review board at each center. The clinical trial is registered as ClinicalTrials.gov identifier: NCT01169701.
Study population
Patients between 18 and 70 years old were eligible for the study if they had received a first or second single-kidney transplant within the last 3 years, had a minimal post-transplant time of 6 months, and were receiving TAC plus MPA before inclusion to the study. Key exclusion criteria included pretransplant diabetes; serum creatinine ≥2 mg/dl and/or eGFR ≤40 ml/min and/or proteinuria ≥500 mg/day; previous antibody-mediated and/or cellular severe acute rejection; panel-reactive antibodies (PRA) ≥20%; severe hypercholesterolemia (>350 mg/dl; >9 mmol/l) or hypertriglyceridemia (>500 mg/dl; >8.5 mmol/l); multi-organ transplantation; HIV-/HCV-/HBV-positive serology or other severe systemic infections; primary focal and segmental glomerulosclerosis as primary renal disease; coronary artery disease and/or ventricular dysfunction or dilated cardiomyopathy and/or history of any current or previous malignancy in the last 5 years (except basal or squamous cell carcinoma).
Efficacy assessments
The primary efficacy variable was to evaluate whether EVR versus TAC at month-24 resulted in a significant reduction in LVH. Left ventricle dimensions were obtained at baseline, at month-12 and at month-24 by centralized echocardiographic assessment 16. An investigator who was unaware of the patient's treatment performed the echocardiogram outcome measurements. Left ventricle mass was calculated according to the Devereux formula 17 and then indexed for height2.7 (LVMi) [Zoccali formula] 18. LVH was defined as a LVMi greater than 49.2 g/m2.7 and 46.7 g/m2.7 for men and women, respectively 19. Evaluation of left ventricle (LV) structure was based on wall thickness and diastolic chamber dimension 20. Relative wall thickness (RWT) was measured as follows: septal wall thickness + posterior wall thickness divided by LV diastolic diameter. The reference cutoff value used for increased RWT was ≥0.45. LVH patterns were defined as follows: normal ventricular structure: normal mass index + RWT <45; concentric remodeling: normal mass index + RWT >45; concentric hypertrophy increased mass index + RWT >45; and eccentric hypertrophy increased mass index + RWT ≤45.
Secondary efficacy endpoints included the assessment of CV profile improvement by: pulse wave velocity (PWV) measured using sphygmocor (at day 0, month-6, and month-24), major adverse cardiac events [MACE] (baseline and at month-24), ambulatory blood pressure monitoring (ABPM, over 24 h), and cardiac biomarkers (at day 0, month-6, and month-24). MACE was defined as one of these events: acute myocardial infarction, congestive heart failure, percutaneous coronary intervention, insertion or replacement of implantable defibrillator, coronary artery bypass, stroke, peripheral vascular disturbances, or other causes. Patients were classified according to the percentage of nocturnal SBP decline as: dippers if the fall was ≥10% and nondippers if the fall was <10%.
The following cardiac biomarkers were assessed: troponin I, myeloperoxidase (MPO), N-terminal pro b-type natriuretic peptide (NtproBNP), C-reactive protein (CRP), procollagen type I N-terminal propeptide (PINP), type I collagen telopeptide (ICTP), and HbA1c.
Other secondary efficacy endpoint was the renal function, which was assessed by the eGFR calculated using the MDRD formula 21. eGFR was recorded on the day of randomization (before any switch in medication), at month-6, month-12, and month-24.
Safety assessments
Safety assessments included collection of adverse events (AEs), serious adverse events (SAEs), including infections, vital signs, and laboratory parameters. Post-transplant diabetes mellitus (PTDM) and impairment of glucose tolerance (IGT) were defined according to the American Diabetes Association Criteria 22 and were assessed at baseline and at month-6, month-12, and month-24 by oral glucose tolerance test.
The percentage of patients with biopsy-proven acute rejection (BPAR), graft loss, death, or loss to follow-up was also reported.
Statistical analysis
Sample size was calculated as follows. The results reported by Paoletti et al. 12 showed a 1-year mean LVH change between the two treatment arms (CNI or SRL) of 8.6 g/m2 LVH change ±6.6 g/m2 standard deviation compared to the control group. Based on these results, and considering a statistical power of 90% and 95% CI, a total of 14 patients per arm would be needed to assess the primary endpoint. However, to determine the PWV according to Seckinger et al. 23 a bigger sample size was required. Thus, a total of 30 patients per arm were required to detect a difference of 1.26 m/s in PWV between the two treatment groups at the 6-month follow-up, with 90% power, 95% CI, and 1.47 standard deviation. Assuming an overall dropout rate of 25%, 80 patients were planned to be randomized in a 1:1 ratio (40 patients per arm).
The change in LMVi from baseline treatments was analyzed using a repeated-measures analysis of covariance (ancova) model, with baseline LMVi as a covariate. A similar ancova was performed for the change in PWV, ABPM, cardiac biomarkers, and renal function. Efficacy analyses were based on the intent-to-treat (ITT) population comprising all randomized patients that received at least one dose of study medication, who had reported at least one postbaseline dose and had at least one baseline and one postbaseline echocardiogram. Missing data for the analysis of the primary end-point were imputed by the last observation carried forward (LOCF) method. Safety analyses were performed on the safety population, which included all randomized patients who received at least one dose of randomized study drug. Comparisons were analyzed by the Wilcoxon's test for paired comparisons and the Mann–Whitney U-test. Data analysis was performed using the sas® statistical package for Windows (version 9.4; SAS Institute Inc., Cary, NC, USA).
Results
Patient population and therapeutic drug monitoring
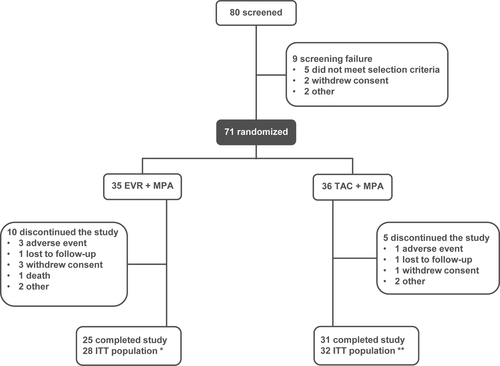
A total of 80 renal transplant patients were screened, and 71 were randomized in the two treatment groups (Fig. 1). A total of 60 patients (32 EVR group and 28 TAC group) were included in the ITT population. Patient's baseline characteristics are shown in Table 1. The C0 EVR levels were determined at day 4 and were monitored during the study. The mean values (SD) C0 levels in the EVR group were 6.9 (4.4) ng/ml at day-4, 7.1 (2.0) ng/ml at month-6, 6.89 (2.3) ng/ml at month-12, and 7.4 (1.9) ng/ml at month-24. All patients receiving EVR (100%) reached C0 levels >3 ng/ml by day 8 and maintained during the study, indicative of an adequate EVR exposure. In the TAC group, the mean (SD) C0 levels were 7.2 (2.0) ng/ml at baseline, 6.6 (1.8) ng/ml at month-12 and 7.0 (2.3) ng/ml at month-24. The mean (SD) MPA dose was 798.7 (349.5) mg/day at baseline and 821.8 (350.5) mg/day at month-24 in the total population, without significant differences between groups. Table 1 shows that 23 patients (71.9%) and 19 (67.9%) patients of the TAC group and the EVR group, respectively, were on steroid treatment during the study.
| TAC group (n = 32) | EVR group (n = 28) | |
|---|---|---|
| Recipient characteristics | ||
| Age, years, mean (SD) | 49.0 (11.6) | 47.4 (13.6) |
| Male, n (%) | 18 (56.3) | 17 (60.7) |
| Caucasian, n (%) | 27 (84.4) | 24 (85.7) |
| BMI (kg/m2)a, mean (SD) | 26.6 (3.8) | 26.1 (4.6) |
| Time since transplant (years), mean (SD) | 1.7 (0.8) | 1.3 (0.7) |
| PTDM, n (%) | 6 (18.8) | 2 (7.1) |
| First transplant, n (%) | 29 (90.6) | 25 (89.3) |
| PRA >5%, n (%) | 3 (9.4) | 3 (10.7) |
| CKD etiology | ||
| Glomerulonephritis | 15 | 5 |
| Pyelonephritis/interstitial nephritis | 0 | 4 |
| Polycystic disease | 8 | 9 |
| Otherb | 8 | 8 |
| MACEsc, n (%) | 5 (15.6) | 2 (7.1) |
| Patients on steroidsd, n (%) | 23 (71.9) | 19 (67.9) |
| Donor characteristics | ||
| Cold ischemia timee (h), mean (SD) | 15.5 (4.1) | 13.7 (4.1) |
| Mean age (years), mean (SD) | 46.7 (14.1) | 45.8 (13.3) |
| Male, n (%) | 22 (68.8) | 19 (67.9) |
| Living donor, n (%) | 5 (15.6) | 6 (21.4) |
- SD, standard deviation; BMI, Body mass index; PTDM, post-transplant diabetes mellitus; PRA, panel reactive antibody; CKD, chronic kidney disease; MACEs, major adverse cardiac events.
- a Mean (SD) was maintained during the study in both groups (TAC versus EVR) [26.7 (3.4) vs. 26.2 (3.4) kg/m2 at month-12, and 26.7 (3.5) vs. 26.3 (4.4) kg/m2 at month-24].
- b Includes congenital and hereditary diseases, systemic disease, and others.
- c MACEs (prior to study inclusion, TAC versus EVR): insertion or replacement of implantable defibrillator (0.0% vs. 3.6%), peripheral vascular disturbances (6.3% vs. 0.0%), stroke (3.1% vs. 3.6%), other causes (6.3% vs. 0.0%).
- d Steroid treatment during the study.
- e Cold ischemia time in cadaveric kidney.
Efficacy
Left ventricle mass index
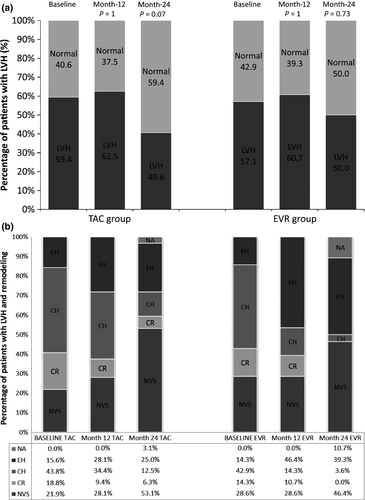
The LVMi and echocardiographic assessment are shown in Table 2. The prevalence of LVH was comparable at baseline (around 60% in each group), and numerically decreased in both groups at month-24, without significant differences between treatments (Fig. 2a). The echocardiography variables at baseline, 12, and 24 months did not show significant differences between groups (Table 2). The most frequent pattern of LVH described at baseline was the concentric hypertrophy (around 43% in each group), being the normal ventricular structure the most common finding at the end of the study in both groups (46% and 53% for EVR and TAC, respectively). After 24 months of follow-up, concentric hypertrophy and concentric remodeling patterns nearly disappeared in EVR group (3.5% vs. 12.5%, and 0.0% vs. 6.3%; EVR versus TAC, respectively). Conversely, eccentric hypertrophy tended to increase in both EVR and TAC groups (39.3% and 25.0%, respectively). The entire evolution of LVH patterns are shown in Fig. 2b.
| TAC group (n = 32) | EVR group (n = 28) | |||
|---|---|---|---|---|
| 95% CI | 95% CI | |||
| Baseline | ||||
| LVMi (g/m2.7), mean (SD) | 54.0 (18.4) | 47.4–60.7 | 53.4 (17.0) | 46.9–60.0 |
| LVH (yes), n (%) | 19 (59.4%) | – | 16 (57.1%) | – |
| IVS (mm), mean (SD) | 11.7 (2.6) | 10.8–12.7 | 12.2 (3.9) | 10.7–13.7 |
| PWT (mm), mean (SD) | 11.4 (3.0) | 10.3–12.5 | 11.5 (2.8) | 10.4–12.6 |
| LVEDD (mm), mean (SD) | 46.3 (6.1) | 44.1–48.6 | 46.9 (5.8) | 44.7–49.1 |
| LVESD (mm), mean (SD) | 25.2 (4.2) | 23.7–26.7 | 27.4 (4.6) | 25.6–29.2 |
| LVEF (Simpson's method), mean (SD) | 0.73 (0.08) | 0.71–0.76 | 0.70 (0.06) | 0.67–0.72 |
| LVEF (Teicholz's method), mean (SD) | 0.70 (0.08) | 0.67–0.73 | 0.66 (0.06) | 0.64–0.68 |
| RWT, mean (SD) | 0.51 (0.14) | 0.46–0.56 | 0.52 (0.16) | 0.45–0.58 |
| PASP (mmHg), mean (SD) | 18.8 (9.9) | 14.4–23.2 | 18.9 (10.7) | 14.3–23.5 |
| LVEDV (ml), mean (SD) | 82.5 (29.6) | 71.8–93.2 | 93.6 (32.8) | 80.9–106.4 |
| LVESV (ml), mean (SD) | 22.0 (10.8) | 18.1–25.9 | 28.4 (11.8) | 23.8–33.0 |
| RA (ml), mean (SD) | 57.9 (28.6) | 45.2–70.6 | 56.8 (21.3) | 46.2–67.4 |
| Month-12 | ||||
| LVMi (g/m2.7), mean (SD) | 54.7 (18.5) | 48.0–61.4 | 53.5 (17.0) | 46.4–62.6 |
| LVH (yes), n (%) | 20 (62.5%) | – | 17 (60.7%) | – |
| IVS (mm), mean (SD) | 10.5 (2.8) | 9.5–11.6 | 10.7 (3.5) | 9.3–12.0 |
| PWT (mm), mean (SD) | 11.2 (2.6) | 10.2–12.1 | 10.4 (2.4) | 9.5–11.4 |
| LVEDD (mm), mean (SD) | 49.0 (5.4) | 47.1–51.0 | 51.5 (6.3) | 49.1–54.0 |
| LVESD (mm), mean (SD) | 26.6 (3.9) | 25.2–28.0 | 29.5 (4.1) | 27.9–31.1 |
| LVEF (Simpson's method), mean (SD) | 0.76 (0.08) | 0.73–0.79 | 0.72 (0.07) | 0.70–0.75 |
| LVEF (Teichholz's method), mean (SD) | 0.70 (0.08) | 0.67–0.73 | 0.67 (0.07) | 0.64–0.69 |
| RWT, mean (SD) | 0.45 (0.12) | 0.41–0.49 | 0.42 (0.11) | 0.37–0.46 |
| PASP (mmHg), mean (SD) | 26.9 (5.7) | 23.5–30.4 | 23.6 (9.7) | 15.5–31.7 |
| LVEDV (ml), mean (SD) | 80.4 (26.6) | 70.5–90.3 | 89.6 (28.4) | 78.4–100.8 |
| LVESV (ml), mean (SD) | 20.2 (11.5) | 15.9–24.5 | 24.5 (9.5) | 20.8–28.3 |
| RA (ml), mean (SD) | 47.5 (17.8) | 36.8–58.3 | 60.8 (39.4) | 41.8–79.8 |
| Month-24 | ||||
| LVMi (g/m2.7), mean (SD) | 48.2 (17.1) | 41.5–54.1 | 49.4 (13.6) | 43.1–54.8 |
| LVH (yes), n (%) | 13 (40.6) | – | 14 (50.0) | – |
| IVS (mm), mean (SD) | 9.7 (2.7) | 8.8–10.7 | 9.5 (1.8) | 8.8–10.2 |
| PWT (mm), mean (SD) | 9.7 (2.5) | 8.8–10.7 | 9.4 (1.6) | 8.8–10.1 |
| LVEDD (mm), mean (SD) | 49.8 (6.2) | 47.5–52.0 | 52.6 (5.3) | 50.4–54.8 |
| LVESD (mm), mean (SD) | 28.1 (6.1) | 25.8–30.3 | 30.3 (4.1) | 28.6–32.0 |
| LVEF (Simpson's method), mean (SD) | 0.73 (0.09) | 0.70–0.76 | 0.71 (0.06) | 0.68–0.74 |
| LVEF (Teichholz's method), mean (SD) | 0.68 (0.08) | 0.65–0.71 | 0.66 (0.07) | 0.63–0.69 |
| RWT, mean (SD) | 0.40 (0.14) | 0.35–0.45 | 0.36 (0.10) | 0.34–0.39 |
| PASP (mmHg), mean (SD) | 30.3 (8.8) | 25.0–35.6 | 35.1 (14.6) | 23.0–47.3 |
| LVEDV (ml), mean (SD) | 81.7 (28.5) | 71.0–92.3 | 95.8 (37.0) | 79.8–111.8 |
| LVESV (ml), mean (SD) | 23.1 (12.7) | 18.4–27.8 | 26.9 (9.8) | 22.7–31.1 |
| RA (ml), mean (SD) | 45.6 (14.8) | 35.7–55.6 | 53.6 (16.0) | 45.1–62.1 |
- LVMi, left ventricular mass index; LVH, left ventricular hypertrophy; IVS, interventricular septal thickness; PWT, posterior wall thickness; LVEDD, left ventricular end-diastolic diameter; LVESD, left ventricular end-systolic diameter; LVEF, left ventricular ejection fraction; RWT, relative wall thickness; PASP, pulmonary artery systolic pressure; LVEDV, left ventricular end-diastolic volume; LVESV, left ventricular end-systolic volume; RA, right atrial volume.
Renal function and proteinuria
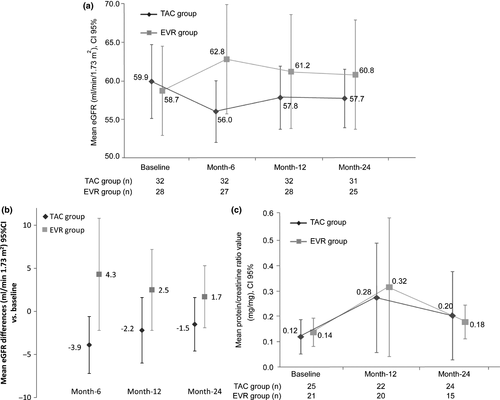
At month-6, eGFR values increased in the EVR group and maintained during the whole study, with significant differences between groups (P = 0.0315, ancova, Fig. 3a). Intragroup analysis showed significant improvement at month-6 versus baseline in the EVR group (P = 0.0155) and a significant impairment in the TAC group at month-6 versus baseline (P = 0.0256) (Fig. 3b). Proteinuria did not show significant differences between both groups (Fig. 3c). Moreover, at month-24, prevalence of proteinuria <500 mg/day was 65.6% vs. 64.3%, 500–1000 mg/day was 3.1% vs. 7.1%, and 1000–3000 mg/day was 6.3% vs. 3.6%, in TAC versus EVR, respectively.
ABPM and PWV
Blood pressure was well controlled and within normal range during the whole study. SBP and DBP measurements did not show significant differences between groups in any study visit, except SBP measurement at month-6 (over 24 h and at daytime period). At month-6, SBP values were higher in the EVR group than in TAC group, although <130 mmHg. ABPM full data are shown in Table S1. Prevalence of nondipper patients at baseline was 75.0% in TAC vs. 78.6% in EVR. At month-6, these percentages were maintained and decreased in both groups at month-12 (65.0% TAC vs. 60.7% EVR) and remained numerically lower in the EVR group at month-24 (77.4% TAC vs. 68.0% EVR). No statistical differences between groups were observed in any study visit (Fig. 4a).
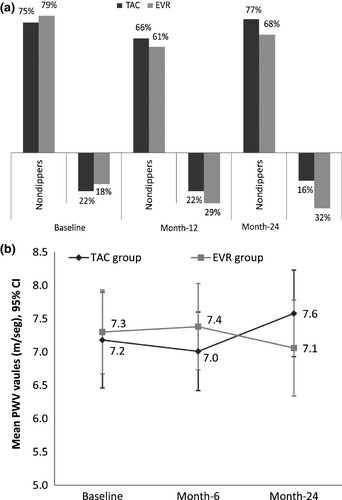
At baseline, the mean PWV values were similar in both groups and in all cases within the normal range (<10 m/s) 24. These values were maintained through the study with no significant differences between treatments. PWV data evolution is shown in Fig. 4b.
Cardiac biomarkers
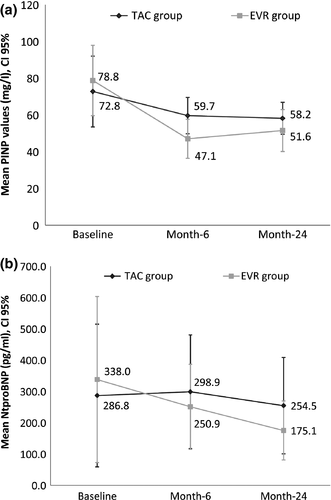
Full data regarding cardiac biomarkers are shown in Table S2. The procollagen type I N-terminal propeptide (PINP) values decreased in both groups during the follow-up, although intragroup analysis only demonstrated significant differences in the EVR group (month-6 and month-24 versus baseline, P < 0.0001). Moreover, PINP levels were significantly lower in the EVR group (P = 0.004, ancova) (Fig. 5a). The N-terminal pro b-type natriuretic peptide (NtproBNP) decreased in both groups, although intragroup analysis showed a significant reduction at month-24 versus baseline value (P = 0.013) only in the EVR group (Fig. 5b). However, no significant differences between groups were observed (P = 0.2834, ancova).
Major adverse cardiac event
The MACEs prior to study inclusion are described in Table 1. After the baseline visit, only one patient in the TAC group (safety population) reported a MACE (cerebrovascular accident) that led to discontinuation of the study.
Concomitant medication
At baseline, the percentage of patients receiving antihypertensive drugs was similar between groups (60.7% EVR vs. 65.6% TAC); and at month-24 slightly decreased in the EVR (53.6%) versus the TAC group (71.9%). Importantly, the proportion of patients treated with inhibitors of the renin–angiotensin system (RAS) at baseline was similar between groups (25.0% TAC vs. 21.4% EVR), although at month-24 more patients in the TAC group (40.6%) than in EVR group (28.6%) were receiving treatment with RAS inhibitors. Statin use at baseline was more frequent in the TAC (56.3%) than in the EVR group (32.1%); after 24 months of follow-up, it increased in both groups (62.5% TAC and 50.0% EVR).
Safety
Over the 24-month study period, 80.0% of patients in the EVR group (n = 132 AEs) and 69.4% (n = 74 AEs) of patients in the TAC group experienced one or more AEs. Serious adverse events (SAEs) were reported in 14.3% (n = 8 SAEs) and 11.1% (n = 5 SAEs) of EVR versus TAC patients, respectively. In addition, two patients (n = 2 AEs) in the TAC group and 23 patients (n = 26 AEs) in the EVR group had suspected study medication AEs. In the EVR group, the most frequent AEs were skin and subcutaneous tissue disorders (n = 2 acne, n = 2 dermatitis, n = 1 rash, and n = 1 hirsutism). In the TAC group, the most frequent AE was hypertension. Discontinuation of study medication due to AEs was reported in one patient in the TAC group and in two patients in the EVR group. In the EVR group, one of these patients was diagnosed during the study of adenocarcinoma of unknown origin with pleural involvement leading to drug discontinuation and death.
In the TAC group, diarrhea was the most frequent AE (11.1%, n = 4 vs. 8.6% n = 3), while peripheral edema was the most frequent in the EVR group (17.1%, n = 6 vs. 8.3%, n = 3). Infections occurred in 33.3% (n = 12) in TAC vs. 45.7% (n = 16) in EVR group, with urinary tract infection being the most frequent in both groups (36.1% TAC vs. 22.9% EVR). Among all the infections, 8 (11.3%) were severe, showing similar distribution in both groups. Related to the opportunistic pathogens, only one patient in the EVR group had a CMV infection.
Lipid profile showed similar values of LDL-cholesterol and triglycerides in both groups. At baseline, the occurrence impaired glucose tolerance (IGT) was comparable in both groups and tended to decrease at month-24 only in the EVR group (Table S3).
During the study, no cellular, antibody-mediated rejection nor suspicion of rejection was reported in either the TAC or EVR groups. Thus, no confirmatory biopsy was needed. No graft loss was also recorded. One death was reported in the EVR group due to an adenocarcinoma with pleural involvement of unknown origin.
Discussion
Left ventricular hypertrophy is a prevalent clinical–pathological entity, and more importantly, it is a significant predictor of adverse long-term outcomes after kidney transplantation 2. Some previous studies suggest improvement of LVH after CsA conversion to SRL as well as CsA minimization in combination with EVR 11-15. To our knowledge, this is the first published randomized clinical trial in renal transplant recipients with LVH as primary endpoint comparing TAC versus EVR. Unexpectedly, we observed reduction of LVMi and LVH in both treatment arms. Regression of LVH and improvement of cardiac function have been reported with the use of mTORi 12, 13, 15, although our results seem do not entirely confirm those previous data. As CsA has been previously associated with the development of LVH after transplantation 25, this difference must rely on the type of CNI we used in our control arm, that is TAC.
Bearing in mind the results of this trial, we hypothesized that regression of LVH depends on multiple causes, but one of the main drivers could be the recovery of renal function achieved after transplantation. Both treatment groups showed an appropriate control of hypertension and other factors associated with LVH. Interestingly, improvement in LVH was similar in both treatments despite renal function was better in EVR than in TAC group. In addition to classical LVH classical risk factors, type of immunosuppression, although by different action mechanisms, may play a straight role in the regression of LVH and cardiac remodeling as shown by the results obtained in PINP and NT-proBNP biomarkers and the more intense reduction of concentric LVH after conversion from TAC to EVR. There is experimental evidence that activation of calcineurin is involved in the development of LVH but not of LV fibrosis and that TAC attenuated LVH without any effect on LV fibrosis 26. On the other hand, mTOR inhibition is able to induce regression of LVH 11 and cardiac fibrosis 27 induced by pressure overload 25. The cardiac remodeling is associated with an increase in collagen production 28, being the collagen types I (80%) and III (11%) the most frequent in the heart 29, 30. Accordingly, in our study PINP levels at month-6 were lower in EVR treated patients. From 6 to 24 months, PINP was reduced equally in both treatment arms suggesting a lower collagen production and potentially less cardiac remodeling requirement in this period. Interestingly, NT-proBNP, a useful biomarker for identifying patients with LVH 31, was reduced in both treatment arms. The use of RAS inhibitors is also associated with regression of LVH 32, and therefore, it could be a confounder factor. Of note, the proportion of patients on RAS blockers was higher in the TAC group than in the EVR group.
In this study, other surrogate markers of the cardiovascular disease were assessed, as blood pressure measured by ABPM and PWV. Blood pressure and PWV values were within normal range at baseline and during the study, suggesting that our study population was quite healthy regarding vascular system. Interestingly, despite hypertension was well controlled in both groups, at month-24, there were more nondipper patients in the TAC arm than in the EVR arm. Furthermore, the percentage of patients with antihypertensive drugs was higher in TAC than in EVR (71.9% vs. 53.6%). Previous studies have demonstrated the association between nocturnal BP patterns and renal outcomes. For example, in one-year follow-up study 33, GFR was 4.5 ml/min/1.73 m2 higher for each 10% drop in nocturnal SBP. A nondipping BP pattern accelerates loss of glomerular filtration rate in subjects with and without CKD 34. In kidney transplant recipients, the loss of the nocturnal SBP fall is relatively common and it is associated with higher LVMi, increased CV events, lower graft function, and increased risk graft failure following kidney transplantation 33-35. Hypercholesterolemia and hypertriglyceridemia are classic cardiovascular risk factors and have been described as a metabolic complications associated with mTORi 15, 36. Nevertheless, the results of our study showed no increase for the 24-month duration study, with levels maintained within normal range. Regarding other metabolic complications, the numerical reduction of IGT after conversion from TAC to EVR seems promising although it deserves further investigation.
Safety and tolerability profile was good for the two treatment arms, and this was supported by a very low discontinuation rate in both groups. Moreover, during the whole study there was not any rejection episode confirming that that conversion from TAC to EVR is safe and effective in this selected renal transplant population.
Our study has some limitations. First, this study has been performed in a selected group of renal transplant recipients with low immunological risk and excellent renal function. Second, unfortunately and according to the protocol there was no monitoring of donor specific antibody. However, the absence of clinical rejection episodes, the improvement of renal function, and the lack of proteinuria increase after 24-month follow-up may indirectly suggest that the immune response was controlled. Another limitation of the study was the unavailability of kidney allograft protocol biopsies to demonstrate reduction in histological damage in the graft.
In conclusion, in stable transplant kidney recipients conversion from TAC to EVR did not increase the likelihood of LVH regression although it was associated with benefit on some cardiovascular risk factors such as nocturnal SBP and preservation of renal function. The differential effect of TAC and EVR on cardiac remodeling and biomarkers suggests that mechanisms accounting to reduction of LVMi could be different and thus providing a rationale to check a potential synergistic TAC and EVR effect on LVH reduction in additional well-designed, sufficiently powered, long-term, randomized controlled clinical trials.
Authorship
JMC, NS and JMM: participated in research design. JMC, JP, ASF, DS, JMD, MR, FO, DH and JMM: participated in the performance of the research. JMC, JP, ASF, DS, JMD, MR, FO, DH, AP and JMM: participated in the preparation of the manuscript and in the data analysis.
Funding
This study was funded by Novartis Pharmaceutical.
Conflicts of interest
The authors disclose the following relevant financial relationships: Josep Maria Cruzado has received payment for scientific advice from Novartis. Julio Pascual has received honoraria and research grants from Novartis, Astellas, Sanofi, and Amgen. He is supported by grants “Ayuda de Intensificación FIS-ISCIII 2015, FIS-ISCIII PI13/00598” and Redinren RD12/0021/0024. Daniel Seron has received grant/research support from Novartis, Astellas, and Teva, and payment for scientific advice from and honoraria from Astellas, Chiesi, Novartis, and Teva. Federico Oppenheimer has received payment for scientific advice from and honoraria from Novartis, Alexion and Roche. Ana Sanchez Fructuoso, Domingo Hernandez, Manuel Rengel, José María Morales, and Joan Manuel Díaz have nothing to declare. Nuria Saval and Alexandra Paravisini were employees of Novartis.
Acknowledgements
This clinical trial was supported by Novartis, S.A. We would like to thank writing assistance supported by Dra. Montserrat Sabaté from TFS Develop, Barcelona, Spain. We would like also to thank the contribution of the Red de Investigación Renal (FEDER funds ISCIII RETIC REDinREN, RD12/0021).


