Trends in US minority red blood cell unit donations
Abstract
BACKGROUND
To provide the appropriately diverse blood supply necessary to support alloimmunized and chronically transfused patients, minority donation recruitment programs have been implemented. This study investigated temporal changes in minority red blood cell (RBC) donation patterns in the United States.
STUDY DESIGN AND METHODS
Data on donor race and ethnicity from 2006 through 2015, including the number of unique donors, collections, RBCs successfully donated, and average annual number of RBC donations per donor (donor fraction), were collected from eight US blood collectors. Minority donors were stratified into the following groups: Asian, black or African American, Hispanic or Latino, Native Indian or Alaska Native, Native Hawaiian or other Pacific Islander, white, multiracial/other, and no answer/not sure.
RESULTS
Over the 10-year period, white donors annually constituted the majority of unique donors (range, 70.7%-73.9%), had the greatest proportion of collections (range, 76.1%-79.8%), and donated the greatest proportion of RBC units (range, 76.3%-80.2%). These donors also had the highest annual donor fraction (range, 1.82-1.91 units per donor). Black or African American donors annually constituted between 4.9 and 5.2% of all donors during the study period and donated between 4.0 and 4.3% of all RBC units. Linear regression analysis revealed decreasing numbers of donors, collections, and donated RBC units from white donors over time.
CONCLUSION
Although the US population has diversified, and minority recruitment programs have been implemented, white donors constitute the majority of RBC donors and donations. Focused and effective efforts are needed to increase the proportion of minority donors.
To supply the 14 million red blood cell (RBC) units that were transfused in the United States in 2013, 7 million nonremunerated volunteers donated blood.1 In 2006, 86.7% of US donors were white, 5.8% were black or African American, 3.5% were Hispanic, 2.3% were Asian, and 1.7% were of other race/ethnicity.2 Since then, donor centers have implemented programs to increase donor diversity.3, 4 However, the impact and sustainability of these programs on increasing and retaining the minority donor base is unknown.
In the United States, approximately 40% of the population is eligible to donate blood, but only 5% of Americans actually donate.5 Minorities are under-represented in the blood donor population. In Atlanta, the blood donor rates were 11 per 1000 population for whites compared with 6 per 1000 population for blacks and 3 per 1000 population for Hispanics between 2004 and 2007.6 In addition, the rates of minority donation vary throughout the country, with some areas having substantially lower rates.2 Given the dependence of the blood supply on white donors, as the country diversifies, the need for minority donors will increase.
Another need for minority donors is to support patients with sickle cell disease (SCD). SCD is an inherited blood disorder that occurs in about 1 in 500 black or African American individuals, and patients with this disorder frequently require RBC transfusion therapy.7 Although transfusion therapy generally increases the patient's length and quality of life, multiple transfusions can lead to these patients becoming alloimmunized against blood group antigens. Alloimmunization requires future transfusions of antigen-negative blood, which can sometimes be hard to find. In addition, to prevent alloimmunization and resulting hemolytic transfusion reactions, prophylactic antigen-matched blood is frequently used.8 The probability of identifying matched and/or compatible RBC units can be increased by screening donors of the same racial/ethnic background as the patient with SCD for the relevant antigens. In some cases, black or African American donors are the only source of compatible blood. Thus, to address the transfusion needs of patients with SCD, a demand exists for blood products specifically from black or African American donors.
To overcome under-representation of black or African American blood donors, some blood centers have implemented minority recruitment programs.3 These programs include appealing to this community at religious places or administering blood drives at large minority gatherings by mentioning their role in caring for other sick patients, sending letters, or performing motivational interviews.4 Irrespective of the strategy used, no single method has shown a substantial or sustainable increase in repeat blood donations from minorities.
The goals of this study were to evaluate the changes in minority donation over a recent 10-year period with the implementation of minority recruitment programs and to address the diversification of the US donor population.
MATERIALS AND METHODS
Information on RBC donors, stratified by racial/ethnic group, was collected annually over a 10-calendar year period from 2006 through 2015 by eight large blood collectors located in the United States. These blood centers are headquartered in the following cities: Chicago, IL; Dallas, TX; Milwaukee, WI; New York, NY; Pittsburgh, PA; Richmond, VA; Scottsdale, AZ; and Seattle, WA. These eight centers collected blood in a total of 17 different states. At each of these collection centers, donors were asked to self-identify their race/ethnicity from predefined categories on the donor questionnaire at the time of donation. Because the list of races and ethnicities from which the donors could choose was not necessarily uniform between the participating blood centers, the different races and ethnicities reported by the blood centers were combined into six categories according to criteria promulgated by the National Institutes of Health9: American Indian or Alaskan Native, Asian, black or African American, Hispanic or Latino, Native Hawaiian or other Pacific Islander, and white. Donors were considered to be multiracial if they selected multiple races or ethnicities on the questionnaire. Many blood centers offered additional, nonspecific categories, such as “other,” “prefer not to answer,” or “unknown.” Donors who selected these choices, along with those who did not provide an answer to this question, were subsumed into the “no answer/not sure” category.
Stratified by race and ethnicity, the information collected for this study included the number of unique donors who had at least one successful allogeneic apheresis or whole-blood RBC donation, the number of successful RBC collections, and the total number of RBC units donated. Autologous donations were not included. Double RBC units collected by apheresis were counted as two units, but as only one collection. RBC units that were made into aliquots were counted as one unit, regardless of the number of aliquots produced. Units that were used for quality-control testing and those that were lost to issues related to collecting, processing, and handling at the blood center were included in the total number of units collected if they would otherwise have been suitable for distribution to a hospital.
The donor fraction, defined as the average number of RBC units donated annually per donor by racial/ethnic group, was calculated by dividing the total number of RBC units donated by a particular racial/ethnic group by the number of unique donors from that racial/ethnic group per calendar year. The donor fraction, by definition, is always greater than or equal to 1, and a higher donor fraction reflects a greater number of RBC units donated per donor.
Linear regressions were performed using the proportion data for all parameters, except the donor fraction (for which the absolute numbers were used), from all 10 years of the study, and the slopes of the resulting straight lines were calculated using Microsoft Excel 2010. These slopes represent the rate of change in the parameter over the 10 years of the study.
- Relative change in the proportion of black donors between 2006 and 2015 = ([percentage of black donors in 2015 − percentage of black donors in 2006]/percentage of black donors in 2006).
Participating institutions submitted exemption requests to an Institutional Review Board as required by local policy.
RESULTS
In total, eight US blood collectors participated in this study. During the 10-year study period, 24.9 million RBC units were collectively donated at these centers.
Figure 1A illustrates the percentage of unique donors by race/ethnicity. The vast majority of donors throughout the study period were white, annually accounting for 70.7% to 73.9% of all unique donors. All racial/ethnic groups experienced a small increase in their percentage of unique donors in 2015 compared with 2006, except for the white donors (Table 1). With this exception, the slopes of the linear regression lines (i.e., the rates of change over 10 years) for all of the other racial/ethnic groups were positive. These positive slopes indicate a general trend toward having more unique donors from these racial/ethnic groups (Table 1). For example, the Hispanic or Latino donors demonstrated a 49.50% increase in their proportion of unique donors, from 5.98% of all donors in 2006 to 8.94% of all donors in 2015, which represents an absolute increase of 2.96% between these 2 years. The rate of change over the 10-year study period was positive (0.30) for the Hispanic or Latino donors, indicating a general trend toward increased numbers of donors during the 10-year study period (Table 1). The increase in the percentage of Hispanic or Latino donors is more apparent when the white donors are excluded from the analysis (Fig. 1B). In this analysis, Hispanic or Latino donors accounted for 31.0% of nonwhite donors in 2015, which was up from 23.0% in 2006, whereas black or African American donors demonstrated a slight decrease from 18.8% in 2006 to 18.1% in 2015. Table 2 lists the average numbers of unique donors by race/ethnic group as well as the average percentages of the total numbers of unique donors for each race/ethnic group over the entire 10-year study period. Notably, although the percentage of black or African American donors rose over time and the rate of change over the 10 years, that is, the slope of the regression line, was positive (0.03) (Table 1), the actual number of black or African American donors declined by 10,054 between 2006 and 2015; overall, there were 285,841 fewer blood donors between the beginning and end of the study period (Table S1, available as supporting information in the online version of this paper).
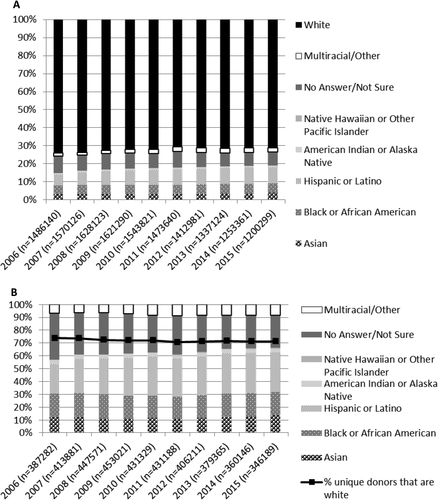
The percentages of unique donors are illustrated by race/ethnicity, (A) including and (B) excluding white donors. In B, the black line indicates the percentage of white donors per year; thus, the 100% value reflects that of the nonwhite donors only. For example, in 2006, the percentage of white donors was 73.9%; thus, all racial/ethnic donors combined accounted for 26.1% of unique donors. Similarly, in 2006, (A) black donors accounted for 4.9% of all donors but (B) 18.8% of nonwhite donors. The numbers in parentheses indicate the total number of unique donors per year.
| Unique donors, % | Donor fraction | Collections, % | RBC units donated, % | |||||||||
|---|---|---|---|---|---|---|---|---|---|---|---|---|
| Ethnic group | Absolute change between 2015 and 2006 | Relative change between 2015 and 2006 | Rate of change | Absolute change between 2015 and 2006 | Relative change between 2015 and 2006 | Rate of change | Absolute change between 2015 and 2006 | Relative change between 2015 and 2006 | Rate of change | Absolute change between 2015 and 2006 | Relative change between 2015 and 2006 | Rate of change |
| Asian | 0.80 | 25.97 | 0.08 | 0 | 0 | 0 | 0.72 | 26.97 | 0.08 | 0.66 | 25.10 | 0.07 |
| Black or African American | 0.33 | 6.75 | 0.03 | 0.02 | 1.45 | 0.003 | 0.28 | 6.54 | 0.03 | 0.29 | 7.23 | 0.03 |
| Hispanic or Latino | 2.96 | 49.50 | 0.30 | 0.02 | 1.36 | 0.001 | 2.64 | 51.97 | 0.26 | 2.63 | 50.58 | 0.26 |
| American Indian or Alaska Native | 0.04 | 4.88 | 0 | −0.06 | −3.73 | −0.003 | 0.02 | 2.63 | 0 | 0 | 0 | 0 |
| Native Hawaiian or Other Pacific Islander | 0.06 | 50.00 | 0.01 | −0.14 | −8.59 | −0.019 | 0.04 | 36.36 | 0 | 0.04 | 36.36 | 0 |
| No answer/not sure | −1.99 | −21.31 | −0.21 | 0.07 | 6.80 | 0.005 | −0.94 | −16.07 | −0.12 | −0.92 | −16.20 | −0.12 |
| Multiracial/other | 0.59 | 32.24 | 0.09 | 0.09 | 6.92 | 0.017 | 0.65 | 44.83 | 0.09 | 0.57 | 40.43 | 0.09 |
| White | −2.78 | −3.76 | −0.30 | 0 | 0 | 0.003 | −3.41 | −4.27 | −0.34 | −3.28 | −4.09 | −0.33 |
- *A positive absolute change between 2015 and 2006 indicates an increase in the absolute value of the parameter in 2015 compared with 2006. The relative change between 2015 and 2006 reflects the rate of change in the proportion of the parameters in 2015 compared with 2006. The rate of change is the slope of a regression line calculated using all of the annual percentage or absolute values (for the donor fraction) for each parameter between 2006 and 2015 and reflects the general trend over the entire study period.
| Unique donors | Donor fraction | Collections | RBC units donated | ||||
|---|---|---|---|---|---|---|---|
| Ethnic group | Average annual no. ± SD | Average annual percentage of all donors | Annual average ± SD | Average annual no. ± SD | Average annual percentage of all collections | Average annual no. ± SD | Average annual percentage of all units donated |
| Asian | 48,080 ± 1,863 | 3.3 | 1.46 ± 0.02 | 65,271 ± 2,798 | 2.9 | 70,379 ± 3156 | 2.8 |
| Black or African American | 73,357 ± 6,592 | 5.1 | 1.41 ± 0.02 | 98,113 ± 8,928 | 4.4 | 103,163 ± 9073 | 4.1 |
| Hispanic or Latino | 117,619 ± 13,342 | 8.1 | 1.50 ± 0.03 | 157,223 ± 19,198 | 7.0 | 176,945 ± 21,878 | 7.1 |
| American Indian or Alaska Native | 11,833 ± 1,126 | 0.8 | 1.60 ± 0.05 | 16,960 ± 1,632 | 0.8 | 18,977 ± 1843 | 0.8 |
| Native Hawaiian or other Pacific Islander | 2,152 ± 177 | 0.2 | 1.54 ± 0.07 | 2,906 ± 214 | 0.1 | 3,317 ± 228 | 0.1 |
| No answer/not sure | 121,453 ± 21,007 | 8.4 | 1.13 ± 0.08 | 126,381 ± 23,959 | 5.6 | 137,102 ± 26,364 | 5.5 |
| Multiracial/other | 31,124 ± 3,720 | 2.1 | 1.31 ± 0.07 | 37,743 ± 4,074 | 1.7 | 40,802 ± 4,772 | 1.6 |
| White | 1,047,072 ± 116,388 | 72.1 | 1.85 ± 0.03 | 1,750,444 ± 198,084 | 77.6 | 1,940,056 ± 210,490 | 77.9 |
Changes in the donor fraction are shown in Fig. 2. Table 2 demonstrates the average donor fraction by racial/ethnic group over the 10 years of this study. Whites had the highest donor fraction over the 10-year study period, ranging from 1.82 to 1.91 annually. Interestingly, the donor fraction of white and Asian donors was the same in 2006 as it was in 2015, hence the zero values in the absolute change for these groups (Table 1), although there was year-to-year variability. The slope of the linear regression line for the donor fraction, that is, the rate of change over 10 years, was nearly zero for most of the racial/ethnic groups during the 10-year study period. However, despite these nearly zero rates of change, there were some relatively large percentage changes among some of the racial/ethnic groups; for example, there was an 8.59% decrease in the Native Hawaiian or other Pacific Islander donor fraction between the years 2006 and 2015 (Table 1).
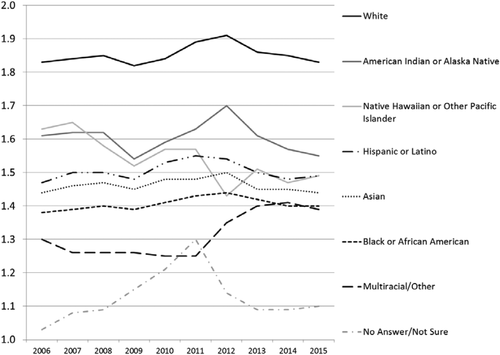
Changes in the donor fraction are illustrated over the 10-year study period.
Table 2 also provides the average percentage of the total number of collections for each racial/ethnic group over the 10-year study period. There was a 3.4% decrease in blood center collections from white donors over the 10 years of this study (from 79.8% in 2006 to 76.4% in 2015), which was also reflected in a negative rate of change over the 10 years for these donors (−0.34) (Table 1). Thus, there was a general trend toward collecting fewer RBC donations from white donors over the study period. However, white donors still accounted for the majority of collections, accounting for between 76.1% and 79.8% of all collections annually (Fig. 3A). Excluding the white donors, Hispanic or Latino donors accounted for the greatest percentage of all collections in 2015 (31.0%), whereas black or African American donors accounted for 19.5% (Fig. 3B). Overall, there were 445,124 fewer collections in 2015 compared with 2006. However, there was an increase of 26,163 collections from Hispanic or Latino donors and a decrease of 13,832 collections from black or African American donors. In terms of the overall 10-year trend in collections, both the black or African American donors and the Hispanic or Latino donors demonstrated positive rates of change, while the white donors demonstrated decreases in the absolute change and the relative changes in the proportion of collections between 2005 and 2016, and the 10-year rate of change indicated a decreased overall trend in collections from white donors (Table 1, Table S2, available as supporting information in the online version of this paper).
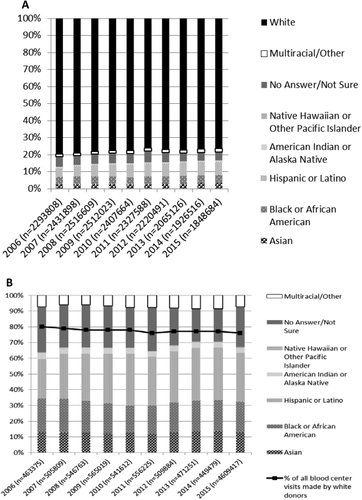
The percentages of all collections are illustrated by race/ethnicity, (A) including and (B) excluding white donors. In B, the black line indicates the percentage of white donors per year; thus, the 100% value reflects that of the nonwhite donors only. For example, in 2006, the white donors accounted for 79.8% of all collections; thus, all racial/ethnic donors combined accounted for 20.2% of collections at the blood centers. Similarly, in 2006, (A) black donors accounted for 4.3% of all collections but (B) made 21.2% of collections when the white donors were excluded. The numbers in parentheses indicate the total number of collections per year.
White individuals donated the largest percentage of RBC units, ranging from 76.3% to 80.2% annually, whereas Hispanic or Latino donors donated the second largest percentage of RBC units (Fig. 4A). Hispanic or Latino donors demonstrated a 2.63% absolute increase in the number of RBC units donated, from 5.20% of all RBC donations in 2006 to 7.83% in 2015 (a 50.58% relative increase), and had a positive rate of change over the course of the study period, reflecting a trend toward increased RBC donations (Table 1). Excluding the units donated by white individuals, Hispanic or Latino donors accounted for 32.0% of all RBC units donated, whereas black or African American donors accounted for 18.8% in 2015 (Fig. 4B). There were 469,671 fewer RBC units collected in 2015 compared with 2006; however, there was an increase of 29,257 units from Hispanic or Latino donors but a decrease of 12,932 units from black or African American donors despite average annual gains in both groups' absolute and relative percentage changes in RBC units available and positive regression line slopes, that is, rates of change over the 10 years (Table 1, Table S3, available as supporting information in the online version of this paper).
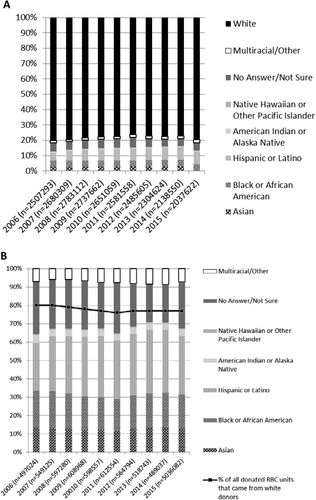
The percentages of all RBC units donated are illustrated by race/ethnicity, (A) including and (B) excluding the white donors. In B, the black line indicates the percentage of white donors per year; thus, the 100% value reflects that of the nonwhite donors only. For example, in 2006, the white donors donated 80.2% of all of RBC units; thus, all racial/ethnic donors combined donated 19.8% of the RBC units. Similarly in 2006, (A) black donors contributed 4.0% of all RBC units but (B) made 20.2% of the RBC donations when the white donors were excluded. The numbers in parentheses indicate the total number of RBC units collected per year.
DISCUSSION
Over the past 10 years, there has been an increase in the proportion of RBC units collected from all minority donors, with a resulting decrease in RBC units collected from white donors. However, there remains substantial under-representation of minorities in the donor population compared with the overall community and US population, especially black or African American donors. Furthermore, despite the need for more black or African American donors and an increase in their proportionate representation in the blood supply, the absolute number of these donors and the number of units they donated over the course of this 10-year period actually decreased.
The diversity of the donor population does not parallel the diversity in the United States. This study demonstrated that, in 2010, 72.1% of donors were white, 8.5% were Hispanic or Latino, 4.9% were black or African American, 3.2% were Asian, 0.8% were American Indian or Alaska Native, and 0.2% were Native Hawaiian or other Pacific Islander. In the same year, the US population was 63.7% non-Hispanic white, 16.3% Hispanic or Latino of any race, 12.6% black or African American, 4.8% Asian, 0.9% American Indian or Alaska Native, and 0.2% Native Hawaiian or other Pacific Islander.10 In the 10 years of this study (from 2006 to 2015), the change in the number of unique donors was −2.8% non-Hispanic white, +3.0% Hispanic or Latino, +0.33% black or African American, +0.8% Asian, +0.04% American Indian or Alaska Native, and +0.06% Native Hawaiian or other Pacific Islander; whereas the change in the US population over a similar 10-year period (from 2000 to 2010) was −5.4% non-Hispanic white, +3.8% Hispanic or Latino of any race, +0.3% black or African American, +1.2% Asian, approximately 0.0% American Indian or Alaska Native, and +0.1% Native Hawaiian or other Pacific Islander.10 Interestingly, over the course of this study, the increases in the fraction of nonwhite donors essentially paralleled their relative increase in the population. This suggests that, despite the trend of collecting fewer RBCs likely due to the effects of hospital-based patient blood management programs,11 there has been a positive impact on minority donor recruitment manifested by the relative stability of minority donor participation, while white donors' participation has declined disproportionately. Perhaps white donors with common blood groups were not being recruited as vigorously as nonwhite donors of any blood group during this period to encourage donation from nonwhite individuals.
The US population has continued to diversify, and the population in 2060 is projected to be 43.6% non-Hispanic white, 28.6% Hispanic or Latino, 14.3% black or African American, 9.3% Asian, 1.3% American Indian or Alaska Native, and 0.3% Native Hawaiian or other Pacific Islander.12 Therefore, there is a need to continue to focus on minority recruitment to ensure that the donor population reflects the community.
The majority of the donor centers that participated in this study have made some effort to recruit or retain minority donors. These minority recruitment programs encompassed a range of initiatives, including materials and websites in non-English languages, targeting minority communities through specific marketing materials, direct community engagement, education campaigns to highlight specific blood needs, group sponsorship, and multilingual and representative staff.3, 13, 14
This study has a number of limitations. First, only eight blood collectors participated. However, the average annual number of transfusable RBC units donated at these centers was 2.49 million; specifically in 2013, when 13.4 million RBC units were available for transfusion in the United States,15 these eight blood centers collected approximately 17% of all RBCs available for transfusion in the United States. The participants in this study were also geographically diverse and collected blood across a range of geographic areas of the United States, thus reflecting different minority recruitment situations. Second, specific information regarding minority recruitment programs during the study period at each blood center was not available, so we could not directly assess the impact of these programs. Third, the ability to supply appropriate RBC units to patients in each region or by each collector was not measured. Thus, the supply may or may not be adequate. Further study on RBC shortages or a detailed review of multiply alloimmunized patients who did not have RBC products available would have to be undertaken to gain further insight about supply and efficiency of use. However, this study importantly demonstrates the continued over-reliance on white donors to maintain a safe and adequate blood supply. Another limitation of this study was that data on the mechanism by which the RBCs were collected, that is, from whole blood or by apheresis, were not collected, as the focus of the analysis was intended to be a high-level description of the trends in minority donor recruitment and donations. Presumably, the donor's habitus and ABO group would influence the RBC collection method, and this would apply across all racial/ethnic groups. Finally, the causes and frequency of donor deferrals were not evaluated in this study but have been reported elsewhere.7, 16
This study demonstrated the demographics and trends in minority donor recruitment and collections and the substantial gap between the national and donor populations that remains. Thus, it appears that the efficacy of donor recruitment programs has not yet matched the need. Continued focus on minority recruitment remains a priority, not only to ensure an adequate blood supply as the population diversifies but also to serve the SCD community and other patients who are likely to require RBCs from individuals of their own race/ethnicity.
ACKNOWLEDGMENTS
We are grateful to the many information technology specialists at our blood centers for extracting data for the Longitudinal OBservational revieW of Ethnic Donors Giving Erythrocytes (LOB WEDGE) study: Marjorie Bravo (BSI), Patrick Gibbons (BW), Melissa Hopkins (ITXM), Mark Rebosa (NYBC), and Michele Tysarczyk (ITXM).
CONFLICT OF INTEREST
The authors have disclosed no conflicts of interest.


