Root-specific expression of opine genes and opine accumulation in some cultivars of the naturally occurring genetically modified organism Nicotiana tabacum
Summary
Previous studies have shown that Nicotiana tabacum contains three Agrobacterium-derived T-DNA sequences inherited from its paternal ancestor Nicotiana tomentosiformis. Among these, the TB locus carries an intact mannopine synthase 2′ gene (TB-mas2′). This gene is similar to the Agrobacterium rhizogenes A4-mas2′ gene that encodes the synthesis of the Amadori compound deoxyfructosyl-glutamine (DFG or santhopine). In this study we show that TB-mas2′ is expressed at very low levels in N. tomentosiformis and in most N. tabacum cultivars; however, some cultivars show high TB-mas2′ expression levels. The TB-mas2′ promoter sequences of low- and high-expressing cultivars are identical. The low/high level of expression segregates as a single Mendelian factor in a cross between a low- and a high-expression cultivar. pTB-mas2′-GUS and pA4-mas2′-GUS reporter genes were stably introduced in N. benthamiana. Both were mainly expressed in the root expansion zone and leaf vasculature. Roots of tobacco cultivars with high TB-mas2′ expression contain detectable levels of DFG.
Introduction
Agrobacterium is well known for its capacity to transfer part of its DNA (T-DNA) to plant cells. Under natural conditions these T-DNAs induce the formation of crown gall tumors and hairy roots that synthesize small molecules used by the bacterium for its growth, the so-called opines (Moore et al., 1997; Vladimirov et al., 2015). Several types of opine synthesis genes have been described. Generally, they code for enzymes that covalently link two common metabolites into product that can then be taken up by agrobacteria and used as carbon, nitrogen, phosphorous and energy sources. Among the different types of opines, the Amadori-type opines mannopine and agropine have been found in both crown galls and hairy roots. Amadori opines are synthesised in several steps: initially glutamine is conjugated with glucose to N-1-deoxy-d-fructosyl-l-glutamine (DFG, commonly called santhopine or SOP). Alternatively glutamate is linked with glucose to form N-1-deoxy-d-fructosyl-l-glutamate (DFGA). In the second step, DFG is converted into mannopine (MOP) and DFGA is converted into mannopinic acid (MOA). Finally, mannopine can be cyclized into agropine (AGR) and mannopinic acid can be cyclized into agropinic acid (AGA). Other members of this group of Amadori opines are chrysopine (the spiropyranosyl lactone of DFG) and N-1-deoxy-d-fructosyl-5-oxo-l-proline (DFOP; Chilton et al., 1995). Mannopine/agropine synthesis genes have been identified on T-DNAs from different Agrobacterium tumefaciens strains: the octopine/agropine strains A6, 15955, B6806 and Ach5 (with very similar T-DNA sequences), the succinamopine strain Bo542 and the chrysopine strain Chry5. They were also found on T-DNAs from several Agrobacterium rhizogenes strains: the agropine strains A4 and 1855 and the mannopine strain 8196. The mas2′ gene codes for DFG synthesis, the mas1′ gene codes for MOP synthesis and the ags gene codes for AGR synthesis. Recently, mas2′, mas1′ and ags genes have been detected in the genomes of Nicotiana tomentosiformis and related species, including Nicotiana tabacum (Chen et al., 2014). Nicotiana species of the Tomentosa section carry up to four different cellular T-DNAs (cT-DNAs) derived by horizontal gene transfer from Agrobacterium, and represent naturally occurring genetically modified organisms (GMOs). The N. tomentosiformis TB cT-DNA carries TB-mas2′, TB-mas1′ and TB-ags, arranged in the same order as on the pTi and pRi plasmids. The mas1′ and mas2′ genes of the A. tumefaciens strain Ach5 and A6 TR region are divergently transcribed and controlled by a dual (divergent) promoter region, whereas ags is regulated by a separate promoter (Velten et al., 1984; Gelvin et al., 1985; Velten and Schell, 1985; DiRita and Gelvin, 1987; Harpster et al., 1988; Langridge et al., 1989; Teeri et al., 1989; Comai et al., 1990; Sanger et al., 1990; Leung et al., 1991; Peach and Velten, 1991; Saito et al., 1991; Ursin and Shewmaker, 1993; Feltkamp et al., 1994; Ni et al., 1995, 1996; Guevara-Garcia et al., 1998). Only the TB-mas2′ gene is intact in N. tomentosiformis: it encodes an active Mas2′ enzyme producing a DFG-like compound when transiently expressed under 2 × 35S promoter control in Nicotiana benthamiana (Chen et al., 2014). Here we investigate the regulation of the TB-mas2′ gene and its expression in different tobacco cultivars, and show that some of them express TB-mas2′ at high levels and synthesize DFG in their roots.
Results
Sequences of mas regions and Mas proteins
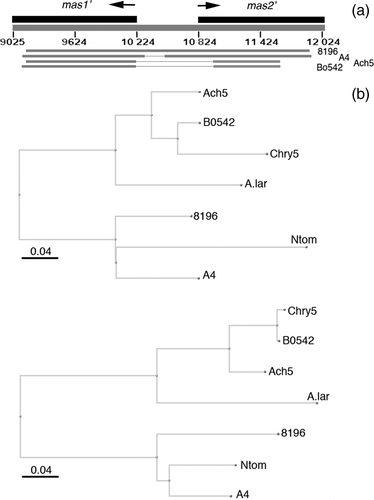
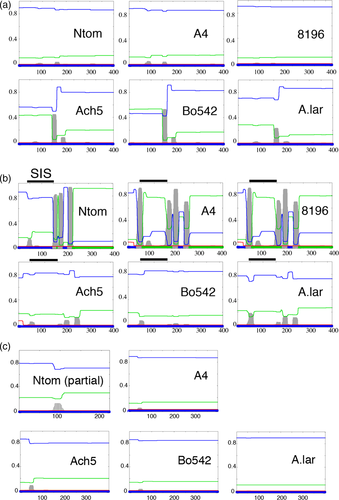
The structure and organization of the mas region of the N. tomentosiformis TB region (KJ599827, Chen et al., 2014) were compared (Figure 1a) with those of A. rhizogenes strains A4 (M60490; Hansen et al., 1991) and 8196 (X51338.1; Bouchez and Tourneur, 1991), and A. tumefaciens strains Ach5 (X00493; Barker et al., 1983) and Bo542 (DQ058764). The N. tomentosiformis mas region sequence is closely related to the A. rhizogenes A4 sequence (86% identity). The intergenic region shows 69% identity with the A. rhizogenes strain 8196 sequence and 77% identity with the A. rhizogenes strain A4 sequence. No similarity was detected with mas intergenic sequences from A. tumefaciens strains Ach5 and Bo542 (see also below). The predicted Mas1′ and Mas2′ proteins were compared with the published Agrobacterium proteins (including protein sequences from Agrobacterium larrymoorei; Figure 1b). The N. tomentosiformis Mas proteins cluster with those of A. rhizogenes A4 (CAA35718.1 and CAA35717.1; Bouchez and Tourneur, 1991) and 8196 (AAA22101.1 and AAA22100.1; Hansen et al., 1991), and differ from those of A. tumefaciens Ach5 (NP_059684.1 and NP_059683.1), Bo542 (AAZ50421.1 and AAZ50420.1), Chry5 (AAK08600.1 and AAK08599.1; Palanichelvam et al., 2000) and A. larrymoorei (WP_037171571.1). Protein structures were analyzed for transmembrane domains in phobius (Stockholm Bioinformatics Centre). TB-Mas1′ lacks transmembrane (TM) domains like A4-Mas1′ and 8196-Mas1′, whereas Ach5-Mas1′, Bo542-Mas1′ and A. larrymoorei-Mas1′ contain TM domains (Figure 2a). Conversely, Ach5-Mas2′, Bo542-Mas2′ and A. larrymoorei-Mas2′ do not contain TM domains, whereas TB-Mas2′, A4-Mas2′ and 8196-Mas2′ do (Figure 2b). In the latter proteins, the N-terminal sucrose isomerase (SIS) domain is predicted to be on the outside of the membrane (Figure 2b). The Ags proteins from A4, Ach5, Bo542 and A. larrymoorei lack transmembrane domains (Figure 2c). Thus, these data reveal two different types of mas regions in Agrobacterium T-DNAs with possibly functional consequences for opine synthesis, and support previous data indicating that the TB-mas region belongs to the A. rhizogenes type.
TB-mas2′ gene expression in different Nicotiana species and N. tabacum cultivars
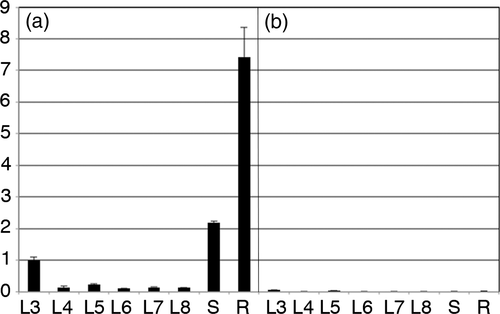
TB sequences with mas/ags genes have been found in the fully sequenced genomes of N. tomentosiformis and the N. tabacum cultivars K326, Basma/Xanthi and TN90. PCR analysis showed their presence in Nicotiana kawakamii and N. tomentosa, but not in another closely related species, Nicotiana otophora (Chen et al., 2014). The latter contains a second, unrelated cT-DNA (called TE) with mutated and most likely inactivated acs/mas genes. In a preliminary genome-wide RNAseq expression study using a mixture of root and leaf RNAs from seven Nicotiana species and 162 cultivars of N. tabacum from the Imperial Tobacco Nicotiana collection at Bergerac, France, we found that 137 tobacco cultivars had very low TB-mas2′ expression levels like the N. tabacum parent N. tomentosiformis and the related species N. tomentosa (we will call these tobacco cultivars low-expression or LE cultivars). Twenty-five N. tabacum cultivars showed surprisingly high TB-mas2′ expression levels (high-expression or HE cultivars), however, and an example of such an RNAseq analysis is shown in Figure S1. TB-mas2′ expression was confirmed by RT-qPCR analysis for the roots of seedlings grown in vitro of two Nicotiana species, Nicotiana tomentosa and N. tomentosiformis, and for 39 N. tabacum cultivars: the previously identified 25 HE cultivars and 14 LE cultivars (Table 1). LE and HE plants grown in vitro showed different TB-mas2′ expression levels in leaves and roots: very low to undetectable levels for all LE cultivars, and easily detectable levels in HE cultivars, with the highest levels found in the roots (Figure 3). The difference between LE and HE cultivars might arise from differences in promoter activities. We therefore investigated the TB-mas2′ promoter region in more detail.
| Type | Cultivar or species | TB-mas2′ expression |
|---|---|---|
| Dark air-cured | Coulo (Nt) | nt |
| Dark air-cured | Galpao | 0.695 ± 0.09 |
| Dark air-cured | Mazinga (Nt) | nt |
| Dark air-cured | Petico | 0.937 ± 0.236 |
| Dark air-cured | Santa Cruz | 0.722 ± 0.208 |
| Dark air-cured | Ti 567 (Nt) | nt |
| Dark air-cured | Vuelta Abajo | 0.734 ± 0.090 |
| Maryland | Amarello Maurice 2 | 0.663 ± 0.054 |
| Maryland | Maryland Broad Leaf | 0.864 ± 0.124 |
| Burley | Burley 21 | 0.784 ± 0.086 |
| Burley | Burley 49 | 0.486 ± 0.057 |
| Burley | Burley 64 | 0.385 ± 0.015 |
| Burley | Burley Americain | 0.883 ± 0.210 |
| Burley | Bursan | 0.944 ± 0.251 |
| Burley | Bus63 | 1.00 ± 0.170 |
| Burley | Harrow Velvet | 0.643 ± 0.191 |
| Burley | Jaune De Belmont | 0.633 ± 0.066 |
| Burley | Judy's Pride Burley (56) | 0.967 ± 0.020 |
| Burley | Pulawsky 66 | 0.685 ± 0.473 |
| Burley | Russian Burley | 1.000 ± 0.098 |
| Burley | Skroniowski 70 | 0.394 ± 0.033 |
| Burley | Start | 0.425 ± 0.303 |
| Burley | Zerlina | 0.854 ± 0.250 |
| Oriental | Hercegovine | 1.336 ± 0.655 |
| Flue-cured | Stolac 17 | 1.440 ± 0.461 |
| Dark air-cured | Bahia | 0.005 ± 0.002 |
| Dark air-cured | Arapira | 0.040 ± 0.016 |
| Dark air-cured | Dragon Vert | 0.074 ± 0.012 |
| Dark air-cured | Paraguay Perigueux 48 | 0.010 ± 0.012 |
| Dark air-cured | Santa Fe | 0.069 ± 0.059 |
| Burley | BB16 | 0.000 ± 0.000 |
| Burley | BB16A | 0.001 ± 0.001 |
| Oriental | Basma Drama | 0.036 ± 0.014 |
| Flue-cured | NC2326 | 0.061 ± 0.018 |
| Flue-cured | Cash | 0.005 ± 0.019 |
| Flue-cured | Polalta | 0.0015 ± 0.001 |
| Kentucky | Kentucky G | 0.001 ± 0.004 |
| Semi Oriental | Boheme Andorre | 0.000 ± 0.000 |
| Semi Oriental | Roum | 0.002 ± 0.004 |
| Nicotiana | Nicotiana tomentosa | 0.001 ± 0.001 |
| Nicotiana | Nicotiana tomentosiformis | 0.000 ± 0.000 |
- Plants that strongly express TB-mas2′ according to preliminary RNAseq analysis and RT-qPCR analysis are marked in bold. Cultivars with low expression are marked in normal type. Nt: high TB-mas2′ expression in RNAseq experiments but not checked by RT-qPCR. TB-mas2′ expression levels were calculated relative to the Russian Burley value, set to a value of 1. Data are from three biological replicates and represent average values with standard deviation.
Sequence of mas dual promoter region
The TB-mas2′ promoter is also found in the mas regions of different strains of A. tumefaciens and A. rhizogenes. This bidirectional promoter is situated between the two AUG codons of the mas1′ and mas2′ genes, which are divergently transcribed (Figures 1a and S2). The dual mas promoter of the TB-region sequence of N. tomentosiformis accession ITB646 (KJ5998267, coordinates 10 224–10 847, 624 nt; Chen et al., 2014) is identical to the published sequences from N. tomentosiformis accession TW142 (ASAG01039652; Sierro et al., 2014) and from three cultivars of N. tabacum, TN90, Basma/Xanthi and K326 (AYMY01187868, AWOK01262755 and AWOJ01062996, respectively; Sierro et al., 2014), and resembles the A. rhizogenes A4 and 8196 mas promoters (Figure S2). The A. tumefaciens Ach5, Bo542 and Chry5 mas promoters, however, show no homology by analysis in blastn. N. tabacum LE and HE cultivars have the same dual promoter sequence. Thus, the differences in mas2′ gene expression levels between the LE and HE cultivars do not arise from promoter sequence differences, but instead possibly arise from differences beyond the mas region or from epigenetic differences.
5-Azacytidine treatment of the LE cultivar BB16
Gene methylation can lead to silencing of gene expression but may be removed by 5-azacytidine treatment, leading to the re-activation of gene expression. Several studies showed re-activation by 5-azacytidine of genes introduced on T-DNAs into tobacco: mas (Van Slogteren et al., 1984) and octopine synthase (ocs) genes (Peerbolte et al., 1986), ipt (John and Amasino, 1989; Klaas et al., 1989), pNOS-NPTII (Zhu et al., 1991) and 35S-GUS (Bochardt et al., 1992). Transcription of a methylated Ach5 mas region in transformed tobacco lines could be re-activated by treatment with 3 μm 5-azacytidine (Van Slogteren et al., 1984). We therefore tried to re-activate the TB-mas2′ gene of the LE cultivar BB16 by plating seeds on 0, 2, 4 and 20 μm 5-azacytidine in vitro. At 4 μm 5-azacytidine seedlings grew slower, and at a concentration of 20 μm growth was fully inhibited (Figure S3a). No increase in TB-mas2′ expression, measured by RT-qPCR using untreated Russian Burley roots as a positive control, was found at 2 or 4 μm 5-azacytidine (Figure S3b). It seems unlikely, therefore, that the low level of TB-mas2′ expression results from methylation.
Inheritance of LE and HE phenotypes
As the TB-mas2′ promoter sequences of LE and HE cultivars are identical, the factor(s) controlling TB-mas2′ expression must be encoded by one or more loci outside the mas2′ gene. The number of loci involved might be determined by segregation in the F2 generation of LE × HE crosses. In order to study the inheritance of the LE/HE phenotypes, the three HE cultivars Petico, Burley 49 and Russian Burley were each crossed with the LE cultivar BB16, in both directions. Levels of mas2′ expression in roots of F1 seedlings growing in vitro were measured by RT-qPCR and were intermediate between those of the parents (Figure S4). Of 293 individual F2 seedlings of the BB16 × Russian Burley cross, 64 showed very low mas2′ expression like the LE parent BB16, yielding χ2 value of 1.478, well below the 2.706 value required for the rejection of the 3:1 null hypothesis of a single locus at the significance level of 0.01. Because roots of individual seedlings had to be tested it was not possible to achieve sufficient precision to distinguish between heterozygous and homozygous seedlings. From these data we conclude that the LE/HE phenotype segregates as a single Mendelian factor.
Tissue-specific regulation of the TB-mas2′ promoter
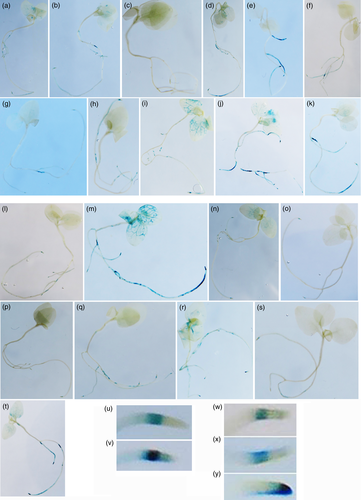
In order to study TB-mas2′ expression patterns, the TB-mas dual promoter (Figures 1a and S2) was cloned upstream of the promoter-less GUS gene from pBI101 (see Experimental procedures), yielding pTB-mas2′-GUS. This construct was stably transferred to N. benthamiana by agro-transformation. The TB mas-related A4 mas promoter region (see above) linked to the GUS gene (pA4-mas2′-GUS) was used as a control. Ten independent transformants were regenerated for each construct. GUS staining of F1 seedlings growing in vitro varied in intensity as expected for independent transformants (Figure 4), but was similar for both constructs with regards to tissue specificity (pTB-mas2′-GUS lines, Figure 4a–k; pA4-mas2′-GUS lines, Figure 4l–t). Expression was mostly limited to the subapical root area (Figure 4u–x), but in plants with strong expression leaf veins were also stained, and in several cases erratic staining was found along the roots. In one exceptional pA4-mas2′-GUS line the apical end of the root was stained (Figure 4r,y). These data confirm the root-specific expression found by RT-qPCR (see above), and indicate strongly that the TB-mas2′ gene promoter has retained its root-specific regulation after horizontal transfer from an A. rhizogenes strain to the N. tomentosiformis ancestor.
DFG synthesis
Given that TB-mas2′ encodes a functional Mas2′ enzyme (Chen et al., 2014) we reasoned that the high TB-mas2′ expression in HE tobacco cultivars might lead to measurable DFG synthesis. Although DFG occurs naturally in rotting fruits and vegetables, in decomposing soils and in crown gall tumors and hairy roots as an opine intermediate, it is rarely isolated or characterized. In contrast to most other opines, DFG is produced from d-glucose and l-glutamine, and consequently a mixture of compounds is always formed, and various side and degradation products can also be formed (Figure S5). DFG is an Amadori compound, resulting from the so-called Amadori rearrangement (Wrodnigg and Eder, 2001). The latter spontaneously allows the formation of 1-aminodeoxy-2-ketoses from the respective aldose and a suitable amine. This reaction is known to be very sensitive to the nature of the carbohydrate and amino components, as well as to the reaction conditions (pH of the medium, temperature and duration). Furthermore, this reaction is reversible, leading to a mixture of products, including N-glycosyl amines and the furanose and pyranose forms of 1-aminodeoxy-2-ketoses, each in their α- and β-anomeric forms. Moreover, the resulting products can enter the Maillard reaction cascade (Nursten, 2005), producing among others the dimer of the so-formed α-aminoketones, leading to pyrazines, as well as other derivatives (Davidek et al., 2002). Thus, isolation of the Amadori rearrangement products can be challenging and tedious. The chemical synthesis of opines mostly relied on the in situ reduction of either the Schiff base formed between an amino acid and an α-ketoacid for octopine and related opines (Biellmann et al., 1977; Jensen et al., 1977; Chilton et al., 1985, 2001), or of the product formed from an amino acid and a carbohydrate for mannityl opines (Tempé et al., 1980). It is worth mentioning that this route produced a mixture of two stereoisomers. This strategy cannot be applied to the chemical synthesis of DFG, however, because of the presence of a carbonyl group in the DFG structure. As N-(1-deoxy-d-fructos-1-yl)aminoacids are more stable in aqueous acid solution (Davidek et al., 2002), we performed a series of experiments with d-glucose and l-glutamine in various acidic conditions. Pure acetic acid proved to be the best compromise between formation and further evolution. Careful monitoring of the reaction (see Experimental procedures) showed that the highest level of DFG was achieved after 3–4 min of heating. Under such conditions, DFG and its cyclized forms are probably N-protonated, favoring their formation while minimizing further evolution. Keeping DFG in acidic media during its isolation (electrophoresis and elution) and storage proved essential, probably for the same reasons. Under these conditions, DFG could be isolated and characterized, and NMR showed that it was mainly present in its pyranose form in aqueous solution, and relatively stable under acidic conditions (Experimental procedures).
DFG in roots of different tobacco cultivars
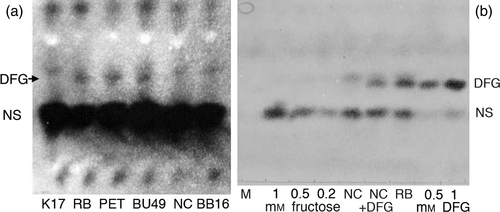
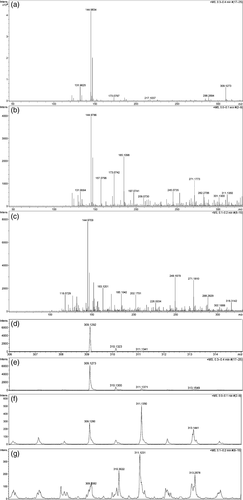
Three LE and three HE tobacco cultivars were tested for the presence of DFG in roots, by paper electrophoresis of crude extracts followed by silver nitrate staining. In the HE cultivars (Russian Burley; Petico and Burley 49), a spot was found migrating with the expected DFG mobility, but this spot was absent in the LE cultivars (K17, NC2326 and BB16; Figure 5a). Paper electrophoresis experiments were scaled up for Russian Burley and NC2326. The DFG-like spots of Russian Burley, and the corresponding area for NC2326, were eluted and analysed by paper electrophoresis (Figure 5b) and mass spectrometry. Synthetic DFG was prepared as described in the Experimental procedures (Figure 6a and e versus d) and used as a control. Mass spectrometry identified numerous compounds in the partially purified root extracts from Russian Burley and NC2326, as expected; however, the Russian Burley extract exhibited a mass peak at 309.13 (low-resolution mode), which could correspond to DFG (Figure 6b). A more careful examination of the mass spectra revealed the definitive presence of DFG, with a mass peak at 309.1280, with the expected isotopomers (Figure 6f versus 6d). In contrast, the NC2326 extract did not exhibit a peak of significant intensity at the mass value of 309 (Figure 6c). Further examination nevertheless showed a series of peaks of very low intensity around the mass value of 309, which cannot be clearly assigned to DFG (Figure 6g). Therefore, the Russian Burley roots unambiguously contain DFG, whereas the NC2326 roots probably do not, or do so at much lower levels. By calibrating the intensity of the DFG spots in Russian Burley extracts by comparison with fructose (Figure 5b), the DFG concentrations in HE roots were estimated to be in the range of 0.1 mm.
Discussion
The TB-mas2′ gene from the TB cT-DNA of N. tomentosiformis has previously been shown to encode an active enzyme when placed under the control of a 2 × 35S promoter, leading to the synthesis of a product that migrates with a mobility expected for DFG on paper electrophoresis (Chen et al., 2014). The TB-mas region is most closely related to the mas regions from A. rhizogenes (A4 and 8196), and less so to those of A. tumefaciens (Ach5, Chry5 and Bo542). The predicted structural properties of the Mas proteins and the lack of DNA similarity for the dual promoter region suggest the existence of two fundamentally different types of mas regions. Interestingly, the TB-Mas2′ protein is predicted to be membrane-located like the A. rhizogenes proteins, whereas the A. tumefaciens Mas2′ proteins lack transmembrane domains. The structural differences between the Mas proteins might be related to functional requirements for opine synthesis, and secretion in roots and tumors, but this remains to be investigated. The TB-mas2′ gene is not expressed in N. tomentosiformis and N. tomentosa at detectable levels, nor in most of the 162 N. tabacum cultivars investigated. In 25 tobacco cultivars, however, TB-mas2’ expression was very high. We assume that TB-mas2′ was originally a functional mas2′ gene expressed at high levels in root tips (as shown by the pTB-mas2′-GUS and pA4-mas2′-GUS reporter gene experiments), but lost its activity after transfer to N. tomentosiformis. It was then re-activated at some point in N. tabacum evolution, leading to a group of HE cultivars. As the promoter sequences of LE and HE cultivars are identical, and an attempt to activate the TB-mas2′ promoter of an LE cultivar by 5-azacytidine was unsuccessful, the difference in expression between LE and HE cultivars is likely to be caused by a sequence outside the mas region, which remains to be identified. This sequence might be a local cis-acting sequence, or a trans-acting sequence distant from the TB-mas2′ locus (as would be the case for a transcription factor gene required for strong TB-mas2′ expression). The intermediate expression levels in the F1 seedlings suggest that each TB-mas2′ gene copy conserved its own expression level, implying control by a cis element. In the F2 generation of the BB16 × Russian Burley cross, the LE/HE phenotype segregated as expected for a single Mendelian locus. Co-segregation studies using molecular markers should allow for the identification of this locus. Transformation of N. benthamiana with pTB-mas2′-GUS and pA4-mas2′-GUS reporter genes and analysis of independent lines showed in both cases specific mas2′ expression in the root elongation zone and leaf veins. This implies that the mas2′ promoter activity has been conserved since the integration of TB-mas2′ into the genome of N. tomentosiformis. Remarkably, although the A4 and TB mas2′ promoters show no detectable similarity to the Ach5 mas2′ promoter, they also give root-specific expression. Studies on the Ach5 and A6 TR mas2′ promoter (Teeri et al., 1989; Leung et al., 1991; Saito et al., 1991; Ni et al., 1995, 1996) showed highest expression in root tips and leaf vascular tissues. A detailed study (Ni et al., 1995) showed strong expression in roots but also in heads of glandular trichomes, and in phloem and xylem parenchyma of stems. Moderate expression was found in leaf mesophyll and guard cells, xylem tracheary elements in leaves, with weaker expression in phloem and xylem parenchyma of leaves, and cortical cells and xylem tracheary elements in stems. Such detailed studies remain to be carried out for the A4-mas2′ and TB-mas2′ promoters. In the case of the A6-mas2′ promoter, several nuclear factors were found to interact with different cis elements (Ni et al., 1996). Further studies of the different mas dual promoters are needed to identify the promoter elements that ensure their tissue-specific expression and the corresponding transcription factors. Remarkably, the high expression level of TB-mas2′ in the roots of HE cultivars leads to DFG synthesis, as it does in crown gall tumors and hairy roots. Plants naturally transformed by Agrobacterium have been found in various species of the genera Nicotiana (Chen et al., 2014), Linaria (Matveeva et al., 2012) and Ipomoea (Kyndt et al., 2015). These natural GMOs carry different opine synthesis genes. Until the present study, it had not been shown that these opine genes could induce detectable levels of opines. The estimated DFG concentration in roots of the HE N. tabacum cultivars is about 0.1 mm, which is relatively low compared with glucose and fructose concentrations in the tobacco root tip (35 mm) or mature root zone (2 mm; Clément et al., 2007). We find that DFG remains easily detectable at these levels, however, provided the compound is stabilized under acidic conditions during extraction and separation. The chemical instability of DFG at neutral pH, or its secretion, may explain the relatively low steady-state level measured in roots. In this context, it would be interesting to introduce the mas1′ gene in HE cultivars in order to convert DFG to the more stable compound mannopine. Nicotiana glauca contains two intact mikimopine synthase (mis) genes, one of which codes for an active enzyme, as shown by expression in tobacco and Escherichia coli (Suzuki et al., 2001, 2002). No mikimopine could be detected in N. glauca, however (Suzuki et al., 2002). N. tomentosiformis contains an intact octopine synthase-like gene (ocl) on the TC region (absent in N. tabacum), and N. otophora carries an intact vitopine synthase-like gene (vis) on the TE region (Chen et al., 2014). Whether these regions lead to opine synthesis remains to be studied. Linaria vulgaris carries two mis genes, but both are mutated and presumably inactive (Matveeva et al., 2012). Ipomoea batatas (sweet potato; Kyndt et al., 2015) contains three agrocinopine synthase (acs) genes, potentially coding for the Acs proteins AIK35201 (305 AA), AIK35206 (242 AA) and AIM47580 (424 AA). As active Acs proteins are composed of 419–443 AA (Paulus and Otten, 1993), AIM47580 might be active, but no agrocinopine has been reported in sweet potato. High TB-mas2′ expression in some tobacco cultivars is either fortuitous, or could have been selected in nature or by tobacco growers. If selection occurred, it was probably related to the root-specific expression of the TB-mas2′ gene, and could have resulted from modified root growth or changes in populations of beneficial root-associated microbes that might use the DFG. The production and possible secretion of DFG and their influence on tobacco growth therefore merit further study. One of the consequences of DFG production could be a modification of root metabolism and growth by the sequestering of glucose and glutamine into DFG. It will be interesting to study the transport and turnover of DFG in HE cultivars, and the possible impact on growth under C- and N-limiting conditions. Another consequence of DFG synthesis could be a modification of the root microflora. DFG can be degraded by different types of microorganisms (Baek et al., 2003). Several members of the Rhizobiaceae contain genes for DFG degradation (Baek et al., 2005), which could allow them to use DFG released from HE tobacco cultivars. Stable transformation of plants with Agrobacterium mas genes (Guyon et al., 1993; reviewed in Savka et al., 2002) has shown that mannopine synthesis in such plants can lead to changes in bacterial populations in the rhizosphere. The effects of TB-mas2′ expression on root and plant growth and on the root microflora might be studied by transformation of LE tobacco cultivars with an inducible TB-mas2′ gene, by TB-mas2′ silencing in HE cultivars or by its removal using CRISPR-Cas9 technology.
Experimental procedures
Sequence analysis
DNA sequences were analysed using the National Center for Biotechnology Information (NCBI) blastn program with the following settings: database nr/nt, optimized for ‘somewhat similar sequences’. For comparison with Nicotiana whole-genome sequences the ‘whole-genome shotgun contigs’ (wgs) setting was used with the WGS projects AWOK, AWOJ and AYMY (N. tabacum), and ASAG (N. tomentosiformis). Protein trees were constructed by using the NCBI/blastp program, with the nr database and the ‘align two or more sequences’ setting, then using ‘distance tree of results’ with the following settings: tree method, fast minimum evolution; max. seq. difference, 0.85; distance, Grishin (protein).
Reporter gene construction
Reporter genes pTB-mas2′-GUS and pA4-mas2′-GUS were constructed by PCR amplification of the mas dual promoter sequences with the following primers: forward primer 5′-CGACCAAGCTTTGTAGAATGAGAGATCG-3′ and reverse primer 5′-CGACCGGATCCTGTCCGATATCCAGTCG-3′ for TB-mas2′, and forward primer 5′-CGACCAAGCTTTGTAAAATGAAAGACG-3′ and reverse primer 5′-CGACCGGATCCTGTGCTGTATCGAGCCG-3′ for A4-mas2′, using total N. tomentosiformis DNA and A. rhizogenes A4 DNA as templates. Primers contained a HindIII site at the proximal promoter end and a BamHI site at the distal end. PCR fragments were cloned into the HindIII and BamHI sites of pBI101 (Jefferson, 1987). Positive clones were checked by sequencing and introduced into LBA4404 (Hoekema et al., 1983) by transformation. The resulting strains were used for the stable transformation of N. benthamiana.
Transformation and tissue culture
Nicotiana benthamiana leaf fragments from glasshouse-grown plants were surface-sterilized. Agrobacterium cultures were grown overnight in liquid yeast extract beef medium, washed twice with 10 mm MgSO4 and diluted to an OD600 of 0.5 in 10 mm MgSO4. Leaf disks were dipped into the Agrobacterium suspension, and placed on solid M0237 (Duchefa Biochemie, http://www.duchefa-biochemie.com) medium with 1% sucrose, 0.05 mg L−1 NAA, 2 mg L−1 BAP (MH medium), left for 24 h and washed in liquid MH with 350 mg L−1 claforan. Disks were then cultured for 1 month on MH with 350 mg L−1 claforan and 150 mg L−1 kanamycin. Shoots were transferred to M0327 medium without hormones with 1% sucrose, 350 mg L−1 claforan and 150 mg L−1 kanamycin for root induction. Plantlets of 10 independent transformants were transferred to the glasshouse and seeds were harvested from selfed F1 plants.
5-Azacytidine treatment
Stock solutions of 5-azacytidine (20 mm in 50% acetic acid) were prepared freshly, sterilized by filtration and stored at 0°C. Solutions of 0, 2, 4 and 20 μm were prepared in M0237 medium with 0.8% agar and 1% sucrose. Seeds were germinated on these media for 2 weeks and plantlets were then transferred to nylon filters on vertical plates with the same media (but with 1.5% agar) for 4 days in order to obtain agar-free roots for RNA extraction.
GUS staining
For GUS tests, seeds were germinated in vitro on M0237 with 1% sucrose. GUS staining was performed according to the method described by Jefferson (1987).
RT-qPCR analysis
RT-qPCR analysis of different plant tissues was performed according to the method described by Chen et al. (2014). For TB-mas2′, the following primers were used: forward primer 5′-CTGAACGCAAGAGAGCACTG-3′ and reverse primer 5′-GAAGTGCCTGCAGAGATGAA-3′. Root extracts were made from plants growing on nylon filters placed on vertical plates with 1.5% agar medium.
DFG synthesis
l-Glutamine (300 mg, 2.05 mmol, 1 equiv.) was added to a solution of d-glucose (1.35 g, 7.49 mmol, 3.5 equiv.) in AcOH (15 ml). The reaction mixture was stirred at 95°C. Aliquots (0.5 ml) were collected every 30 s over 7 min and then every 5 min until 30 min, and then frozen at −78°C. Analysis by paper electrophoresis in acidic medium (H2O-AcOH-HCOOH 910-60-30) and silver nitrate staining revealed that the sample at 3 min contained enough DFG for further analysis. This sample was then purified by preparative electrophoresis. Upon elution in the same medium and lyophilization, a solid was obtained and analysed. Classical NMR spectroscopies (1H, 13C) and 2D NMR techniques (HMBC, HSQC) in deuterated water confirmed that this sample contained DFG, mostly as its pyranose form. High-resolution mass spectroscopy unambiguously confirmed the presence of DFG with a mass peak observed at 309.1273, and the corresponding isotopomer peaks for a calculated mass of 309.1292 according to the M + H+ formula C11H21N2O8 for DFG (Figures 6a and 6e versus d). NMR experiments were performed on Bruker Avance I–III instruments (https://www.bruker.com/products/mr.html). Proton (1H NMR) and carbon (13C NMR) nuclear magnetic resonance spectra were recorded on a 500-MHz instrument in deuterated water. Chemical shifts are given in parts per million (ppm) on the delta scale. Data are presented as follows: chemical shift, multiplicity (m = multiplet), integration and coupling constants (J in Hz). Assignments were determined on the basis of either unambiguous chemical shifts or coupling patterns, and on the basis of correlation spectroscopy (COSY), heteronuclear multiple-quanta correlation (HMQC) spectroscopy, heteronuclear multiple-bond correlation (HMBC) spectroscopy and nuclear Overhauser effect spectroscopy (NOESY) experiments.
DFG
1H NMR (500 MHz, D2O, 25°C): δ 4.02–3.98 (m, 2H, H2, H5), 3.88–3.85 (m, 1H H4), 3.77–3.71 (m, 3H, H3, H5, CH), 3.32–3.25 (m, 2H, CH2), 2.50–2.48 (m, 2H, CH2), 2.20–2.13 (m, 2H, CH2).
13C NMR (125 MHz, D2O, 25°C): δ 177.8 (C=O), 172.7 (C=O), 95.3 (C-1), 69.8 (C-3), 69.3 (C-4), 68.8 (C-2), 62.6 (CH), 63.8 (C-5), 52.5 (CH2), 31.0 (CH2), 24,8 (CH2).
HRMS (ESI, positive mode): calculated for C11H21N2O8 (M + H+) 309.1292; found 309.1273.
DFG analysis of plant extracts
Deoxyfructosyl-glutamine analysis of plants extracts was performed by extraction of plant tissues with 80% ethanol and 20% electrophoresis buffer (H2O-AcOH-HCOOH 910-60-30), followed by centrifugation for 10 min at 10 000 g at 4°C, and separation of neutral sugars and DFG by paper electrophoresis. Reducing sugars were revealed by silver nitrate staining (Chen et al., 2014). For DFG analysis of roots, sterile tobacco seedlings of cultivars NC2326 and Russian Burley were germinated on M0221 medium (Duchefa Biochemie) with 2% sucrose. When roots had reached a length of 1 cm, seedlings were transferred to nylon filters on Petri dishes with the same medium, placed in a vertical position. After growth for 3 days, root tips (1 cm long) were removed with a scalpel and immediately placed in liquid nitrogen. The root tips (400 mg) were crushed in liquid nitrogen and extracted with 4 ml of electrophoresis buffer. Extracts were spun down at 10 000 g for 5 min at 4°C, and supernatants were subjected to preparative electrophoresis, dried by lyophilization and analysed by mass spectrometry. Mass spectrometry experiments were performed on a Bruker Daltonics microTOF spectrometer, equipped with an orthogonal electrospray (ESI) interface. Calibration was performed using a 10 mm sodium formiate solution. Sample solutions were introduced into the spectrometer source with a syringe pump (Harvard type 55 1111; Harvard Apparatus Inc., http://www.harvardapparatus.com) at a flow rate of 5 ml min−1.
Acknowledgements
CK was supported by a doctoral grant from the Chinese Scholarship Council. We thank the gardeners of the Institut de Biologie Moléculaire des Plantes for providing glasshouse plants and M. Alouia for the sequencing service. We thank Professor David Gubb for his critical reading of our manuscript.


