Efficacy of type A botulinum toxin treatment for androgenetic alopecia using ultrasound combined with trichoscopy
Abstract
Objective
This study aimed to assess the efficacy of type A botulinum toxin treatment for androgenetic alopecia (AGA) using a combination of ultrasound and trichoscopy.
Methods
Ninety patients with AGA who visited the Department of Dermatology at the Second Affiliated Hospital of Soochow University from September 2021 to December 2022 were prospectively selected. These patients met the diagnostic criteria outlined in the Chinese Guidelines for the Diagnosis and Treatment of Androgenetic Alopecia. The alopecia severity in the male patients ranged between grades 2 and 4 on the Norwood-Hamilton Scale. The patients were randomly assigned to receive injections of the same type of biological agent in a double-blind manner, with injection sites being the vertex or bilateral temporal–frontal hairline. In this study, the botulinum toxin group comprised 72 patients who received a biological agent with 100 units of type A botulinum toxin. The control group included 18 patients, and the biological agent administered to them contained 0 units of type A botulinum toxin. The patients were observed using 22-MHz ultrasound and trichoscopy before treatment, and 1 month and 3 months after treatment to compare the differences in various parameters at the injection sites. The ultrasound parameters included average follicle width, length, and count. The trichoscopy parameters were the number of hairs within a 1-cm2 area on the counting scale. No artificial interventions were performed at the injection sites, and all examination conditions were consistent.
Results
The patients in the botulinum toxin group had wider and longer average follicle width and length at the vertex 1 month and 3 months after treatment (p < 0.05), and wider and longer average follicle width and length in the left frontal area 3 months after treatment (p < 0.05) compared with those in the control group. The average follicle width and length gradually increased after treatment in the botulinum toxin group (p < 0.05), but no statistically significant differences were found in the control group (p > 0.05). The patients in the botulinum toxin group exhibited greater average follicle lengths after treatment at the vertex compared with the left frontal area (p < 0.05). No statistically significant differences were found in follicle count (p > 0.05) or hair count (p > 0.05) between the botulinum toxin and control groups after injection treatment.
Conclusions
The follicle width and length are effective parameters for evaluating the efficacy of type A botulinum toxin treatment for AGA. Ultrasound revealed that the changes in follicles at the vertex occurred earlier than those in the left frontal area following treatment. Additionally, the changes in follicles were detected earlier than the changes in hair count using ultrasound. Ultrasound combined with trichoscopy provided more parameters for evaluating the efficacy of type A botulinum toxin treatment for AGA, resulting in a more comprehensive evaluation.
1 INTRODUCTION
Androgenetic alopecia (AGA) is a hereditary form of hair loss and is the most common type of alopecia in the population.1 It typically begins at puberty. In China, approximately 21.3% of men and 6.0% of women are affected by AGA.2 Hair loss can affect psychological well-being and reduce the quality of life of patients, thus necessitating early intervention.3 Studies showed that local scalp injections of type A botulinum toxin increased hair count in patients with AGA.4, 5 Questionnaires, and images before and after treatment to compare hair counts, trichoscopy, and so forth are the main methods used to assess hair loss assessment at present.6 Zemtsov et al.7 described skin imaging, the instruments used, the latest advances in diagnostic applications of ultrasound and magnetic resonance imaging (MRI), and the contributions of different specialists to skin imaging. Both high-frequency ultrasound.8 and MRI.9 can be used to visualize the structure of hair follicles, and both have their own characteristics. Ultrasound can be used to observe the morphology of hair follicles, count the number of hair follicles, and measure the width and depth of hair follicles.10 It offers low penetration, involves no radiation, is easy to operate, and is inexpensive, although its reproducibility is controversial.11 3T MRI can also help count the hair follicles and measure their depth.9 It is radiation-free and reproducible, but the examination is relatively long and expensive and requires the use of a smaller field of view and higher spatial resolution.11 We hypothesized that patients with increased hair count after AGA treatment also exhibited changes in follicles, including number, width, depth, and so forth. This study aimed to use 22-MHz ultrasound to observe the structure of hair follicles and investigate the efficacy of type A botulinum toxin treatment for AGA using a combination of ultrasound and trichoscopy so as to detect the changes in the hair follicles, thereby providing imaging evidence for clinical efficacy evaluation.
2 METHODS
2.1 Study population and grouping
Ninety patients with AGA were prospectively selected between September 2021 and December 2022 at the Department of Dermatology, Second Affiliated Hospital of Soochow University. Randomized double-blind injections of the same type of biological agent were administered for treatment. Injection sites, either the vertex or bilateral temporal–frontal hairline, were voluntarily chosen based on individual hair loss conditions. The botulinum toxin group comprised 72 patients who received a biological agent with 100 units of type A botulinum toxin. The control group included 18 patients, and the biological agent administered to them contained 0 units of type A botulinum toxin. This research protocol was approved by the ethics committee of the hospital under approval number 2021–089, and all participants provided informed consent.
2.2 Inclusion and exclusion criteria
The inclusion criteria were as follows: (1) hair loss diagnostic criteria for male and female patients following the Chinese Guidelines for the Diagnosis and Treatment of Androgenetic Alopecia2; (2) severity of hair loss in male patients graded according to the Norwood–Hamilton Scale12 (Table 1), with grades 2−4 selected,13 and all female patients with AGA were selected; and (3) no needle-related fainting and no allergic reactions to type A botulinum toxin. The exclusion criteria were as follows: (1) presence of complications such as ulcers, scars, or alopecia areata at the vertex and bilateral temporal–frontal hairline14, 15; (2) recent use of medications such as polymyxins, aminoglycoside antibiotics, or steroids that might affect the efficacy of botulinum toxin treatment16; (3) concomitant peripheral neuropathies such as myasthenia gravis16; and (4) pregnancy or patients with immune system disorders.
| Type | Clinical definition |
|---|---|
| I | Minimal recession of the hairline along the anterior border in the frontotemporal (FT) region. The anterior border of the hair in the FT region has triangular areas of recession that tend to be symmetrical. |
| II | These areas extend no further posterior than approximately 2 cm anterior to a line drawn in a coronal plane between the external auditory meatus on both sides. Hari is either lost or sparse along the mid-frontal border of the scape. |
| III | Characterized by deep FT hair recession, usually symmetrical and either bald or sparsely covered with hair. These areas of hair recession extend further posterior than a point that lies approximately 2 cm anterior to a line drawn in a coronal plane between the external auditory meatus on either side. |
| IV | The frontal and FT recession is more severe than type III. There is also sparseness or absence of hair in the vertex area. These bald areas are extensive, but separated from each other by a band of moderately dense hair that joins the fully haired fringe on each side of the head. |
| V | The hair loss over the vertex and FT areas is larger than in type IV and the band of hair between them is narrower and sparser. |
| VI | The hair loss over the FT and vertex regions is confluent and the bridge of hair that crosses the crown is absent. |
| VII | There is only a narrow horseshoe-shaped band of hair that begins laterally just anterior to the ear and extends posteriorly on the sides and fairly low on the occipital area. |
2.3 Instruments and methods
Ultrasound and trichoscopy were used to observe the scalp of patients with AGA at the vertex (2 cm to the left of the midline of the body's vertex14) or in the left frontal area (temporal–frontal hairline17) before treatment and 1 month and 3 months after treatment. During the ultrasound examination, patients with the observation site at the vertex were placed in a seated position, and those with the observation site in the left frontal area were placed in the supine position with the head turned to the contralateral side. Trichoscopy examination was conducted with patients in a seated position. All patients underwent examinations under consistent conditions.
2.3.1 Biological agent and injection method
A lyophilized biological agent (type A botulinum toxin 0 or 100 units) produced by Lanzhou Institute of Biological Products Co., Ltd., China, was dissolved in 2 mL of 0.9% saline solution and divided into two 1-mL syringes for immediate use. The patients were seated, and 20 injection sites were designated in the vertex area or bilateral temporal–frontal hairline area (including areas for ultrasound and trichoscopy assessment).4 Each injection site was approximately 1 cm apart,18 with 0.1 mL injected at each site. After disinfecting the injection site, the same attending physician injected the solution intramuscularly.13 After observation for half an hour without bleeding or adverse reactions, the patients were allowed to leave.
2.3.2 Ultrasound instrumentation and method
The ultrasound diagnostic instrument used was manufactured by Esaote S.p.A., Italy (model MyLab Twice). It was equipped with an SL3116 linear array probe operating at 22 MHz, with an image width of 12.7 mm and a depth of 15 mm.
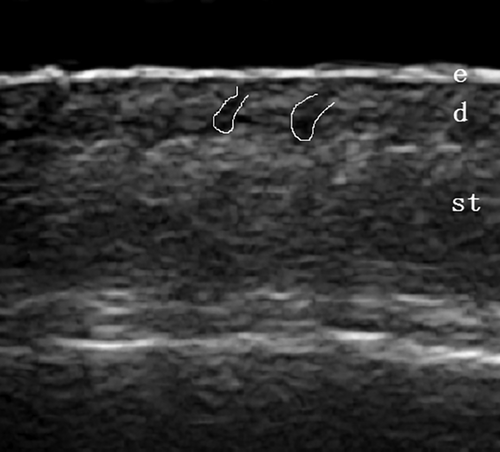
A 7-mm-thick sound guide pad (Foshan Team En Technology, China) was placed in the hair parting area after applying a coupling agent. The ultrasound probe was gently placed on the sound guide pad, and the image focus was adjusted to the dermis layer for optimal imaging. Grayscale ultrasound was used to observe the follicle structure within the skin layers (Figure 1). The parameters used in the study were as follows: (1) follicle count; (2) follicle width (the widest diameter along the axis of the follicle),19 with the average width calculated from all follicles in the image; and (3) follicle length (the distance from the lower border of entrance echo to the far end of the follicle along the axis of the follicle),19 with the average length calculated from all follicles in the image.
2.3.3 Trichoscopy instrumentation and method
A portable (handheld) medical optical skin microscope, also known as a trichoscope,20 of DS-1 type (Suzhou Guoke Yingrui Medical Technology Co., Ltd., China) with a 10 × magnification was used.
The same dermatologist applied the trichoscope to examine the observation sites, capturing clear images and preserving them in electronic files. After the examination, the hairs within a 1-cm2 area marked on the ruler in the images were counted,13 and an average of three counts was obtained.
2.4 Statistical analysis
Statistical analysis was performed using SPSS version 26.0, and GraphPad Prism 8 was used for graphical representation. Normality was assessed using the Shapiro–Wilk test. Normally distributed data were expressed as mean ± standard deviation and between-group comparisons were made using the independent-samples t-test. Variance analysis for repeated measures and multiple comparisons were performed to compare the differences between the botulinum toxin and control groups at various time points before and after treatment. Skewed data were presented as median (quartiles), and between-group comparisons were made using the nonparametric Mann–Whitney U-test. Categorical variables were presented as counts, and comparisons between different frequency arrays were made using the chi-square test or Fisher's exact probability test. A p-value < 0.05 indicated a statistically significant difference.
3 RESULTS
3.1 General information and results
The botulinum toxin group included 12 female and 60 male patients, with 36 at the vertex and 36 in the frontal area. The control group included 5 female and 13 male patients, with 8 at the vertex and 10 in the frontal area. No adverse reactions occurred after injection treatment. No statistically significant differences in general information were found among patients with AGA (p > 0.05, Table 2).
|
Control group (n = 18) |
Botulinum toxin group (n = 72) | Statistical value | p-value | |
|---|---|---|---|---|
| Sex (m/f) | 13/5 | 60/12 | 0.318 | |
| Age (years) | 35.50(28.75, 43.50) | 35.00(32.00, 43.00) | −0.217 | 0.828 |
| Disease duration (years) | 5(3.75, 6.25) | 6(3.25, 10.00) | −1.011 | 0.312 |
- Abbreviations: AGA, Androgenetic alopecia; f, female; m, male.
3.2 Ultrasound examination results
3.2.1 Comparison of follicle counts
No statistically significant differences in follicle counts were observed between the botulinum toxin and control groups before treatment and 1 month and 3 months after treatment (p > 0.05, Table 3).
|
Control group (n = 18) |
Botulinum toxin group (n = 72) | Statistical value | p-value | |
|---|---|---|---|---|
| Before treatment (root) | 10.50(9.00, 11.00) | 11.00(10.00, 12.00) | −1.017 | 0.309 |
| 1 month after treatment (root) | 11.00(9.00, 12.00) | 11.00(10.00, 12.00) | −0.647 | 0.518 |
| 3 months after treatment (root) | 11.00(9.75, 12.00) | 11.00(10.00, 12.00) | −0.540 | 0.589 |
3.2.2 Comparison of follicle average width
The patients in the botulinum toxin group had wider follicle average width after treatment compared with those in the control group (p < 0.05, Table 4 and Figure 2).
|
Control group (A, n = 18) |
Botulinum toxin group (B, n = 72) | B-A | p-value | |
|---|---|---|---|---|
| Before treatment(mm) | 0.53 ± 0.03 | 0.55 ± 0.04 | 0.015 | 0.243 |
| 1 month after treatment(mm) | 0.56 ± 0.03 | 0.59 ± 0.04 | 0.029 | 0.003 |
| 3 months after treatment(mm) | 0.56 ± 0.03 | 0.62 ± 0.03 | 0.060 | < 0.001 |
- Note: A, Control group; B, botulinum toxin group.
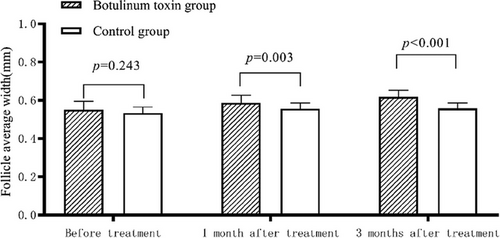
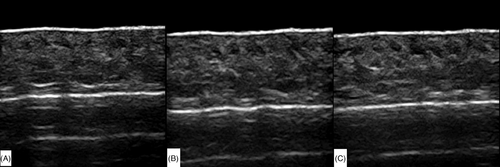
The patients in the botulinum toxin group had wider follicle average width at the vertex 1 month and 3 months after treatment (p < 0.05, Table 5), and wider follicle average width in the left frontal area 3 months after treatment (p < 0.05, Table 6) compared with those in the control group. The follicle average width gradually increased 1 month and 3 months after treatment in the botulinum toxin group, regardless of the vertex or left frontal area (p < 0.05, Tables 5 and 6 and Figures 4 and 5). No statistically significant differences were observed in follicle average width either at the vertex or in the left frontal area in the control group (p > 0.05, Tables 5 and 6).
|
Control group (A, n = 8) |
Botulinum toxin group (B, n = 36) |
B-A | p-value | |
|---|---|---|---|---|
| Before treatment(mm) | 0.53 ± 0.03 | 0.56 ± 0.04 | 0.030 | 0.066 |
| 1 month after treatment(mm) | 0.55 ± 0.03 | 0.59 ± 0.03 | 0.040 | 0.004 |
| 3 months after treatment(mm) | 0.54 ± 0.03 | 0.62 ± 0.03 | 0.073 | <0.001 |
| pa-value | 0.073 | <0.001 | ||
| pb-value | 0.232 | <0.001 | ||
| pc-value | 0.865 | <0.001 |
- Note: A, Control group; B, botulinum toxin group. pa, Comparison between before treatment and 1 month after treatment; pb, comparison between before treatment and 3 months after treatment; pc, comparison between 1 month and 3 months after treatment.
|
Control group (A, n = 10) |
Botulinum toxin group (B, n = 36) | B-A | p-value | |
|---|---|---|---|---|
| Before treatment(mm) | 0.54 ± 0.03 | 0.54 ± 0.04 | 0.004 | 0.799 |
| 1 month after treatment(mm) | 0.56 ± 0.03 | 0.58 ± 0.04 | 0.020 | 0.160 |
| 3 months after treatment(mm) | 0.57 ± 0.03 | 0.62 ± 0.04 | 0.049 | <0.001 |
| pa-value | 0.247 | <0.001 | ||
| pb-value | 0.080 | <0.001 | ||
| pc-value | 0.655 | <0.001 |
- Note: A, Control group; B, botulinum toxin group. pa, Comparison between before treatment and 1 month after treatment; pb, comparison between before treatment and 3 months after treatment; pc, comparison between 1 month and 3 months after treatment.
3.2.3 Comparison of follicle average length
The patients in the botulinum toxin group had increased follicle average length after treatment compared with those in the control group (p < 0.05, Table 7 and Figure 3).
|
Control group (A, n = 18) |
Botulinum toxin group (B, n = 72) | B-A | p-value | |
|---|---|---|---|---|
| Before treatment(mm) | 1.28 ± 0.17 | 1.31 ± 0.17 | 0.026 | 0.558 |
| 1 month after treatment(mm) | 1.31 ± 0.17 | 1.42 ± 0.17 | 0.110 | 0.015 |
| 3 months after treatment(mm) | 1.31 ± 0.19 | 1.54 ± 0.16 | 0.229 | <0.001 |
- Note: A, Control group; B, botulinum toxin group.
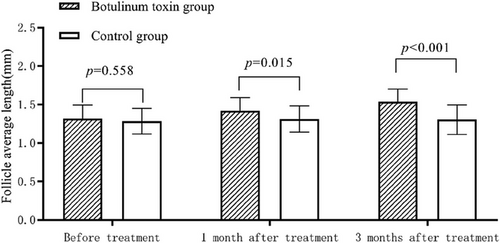
The patients in the botulinum toxin group had longer follicle average length at the vertex 1 month and 3 months after treatment (p < 0.05, Table 8), and longer follicle average length in the left frontal area 3 months after treatment (p < 0.05, Table 9) compared with those in the control group. The follicle average length gradually increased 1 month and 3 months after treatment in the botulinum toxin group, regardless of the vertex or left frontal area (p < 0.05, Tables 8 and 9 and Figures 4 and 5). No statistically significant differences were observed in follicle average length either at the vertex or in the left frontal area in the control group (p > 0.05).
|
Control group (A, n = 8) |
Botulinum toxin group (B, n = 36) | B-A | p-value | |
|---|---|---|---|---|
| Before treatment(mm) | 1.27 ± 0.14 | 1.34 ± 0.18 | 0.075 | 0.274 |
| 1 month after treatment(mm) | 1.31 ± 0.17 | 1.48 ± 0.17 | 0.174 | 0.014 |
| 3 months after treatment(mm) | 1.34 ± 0.21 | 1.58 ± 0.17 | 0.238 | 0.001 |
| pa- value | 0.788 | <0.001 | ||
| pb-value | 0.282 | <0.001 | ||
| pc-value | 0.376 | <0.001 |
- Note: A, Control group; B, botulinum toxin group. pa, Comparison between before treatment and 1 month after treatment; pb, comparison between before treatment and 3 months after treatment; pc, comparison between 1 month and 3 months after treatment.
|
Control group (A, n = 10) |
Botulinum toxin group (B, n = 36) | B-A | p-value | |
|---|---|---|---|---|
| Before treatment(mm) | 1.30 ± 0.19 | 1.28 ± 0.16 | −0.019 | 0.746 |
| 1 month after treatment(mm) | 1.32 ± 0.18 | 1.37 ± 0.15 | 0.049 | 0.375 |
| 3 months after treatment(mm) | 1.27 ± 0.18 | 1.49 ± 0.14 | 0.213 | <0.001 |
| pa-value | 0.820 | <0.001 | ||
| pb-value | 0.924 | <0.001 | ||
| pc-value | 0.526 | <0.001 |
- Note: A, Control group; B, botulinum toxin group. pa, Comparison between before treatment and 1 month after treatment; pb, comparison between before treatment and 3 months after treatment; pc, comparison between 1 month and 3 months after treatment.
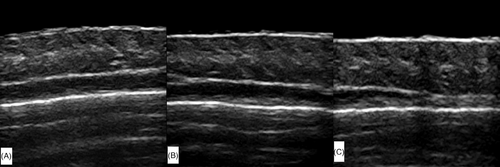
3.2.4 Comparison of follicle average width and length in the botulinum toxin group
No statistically significant differences were found in follicle average width between the vertex and left frontal area before treatment and 1 month and 3 months after treatment in the botulinum toxin group (p > 0.05, Table 10). However, the follicle average length was longer at the vertex than in the left frontal area 1 month and 3 months after treatment (p < 0.05, Table 11).
|
Vertex (A, n = 36) |
Left frontal area(B, n = 36) | B-A | p-value | |
|---|---|---|---|---|
| Before treatment(mm) | 0.56 ± 0.04 | 0.54 ± 0.04 | −0.017 | 0.081 |
| 1 month after treatment(mm) | 0.59 ± 0.03 | 0.58 ± 0.04 | −0.006 | 0.507 |
| 3 months after treatment(mm) | 0.62 ± 0.03 | 0.62 ± 0.04 | −0.001 | 0.997 |
- Note: A, Vertex; B, left frontal area.
|
Vertex (A, n = 36) |
Left frontal area(B, n = 36) | B-A | p-value | |
|---|---|---|---|---|
| Before treatment(mm) | 1.34 ± 0.18 | 1.28 ± 0.16 | −0.061 | 0.127 |
| 1 month after treatment(mm) | 1.48 ± 0.17 | 1.37 ± 0.15 | −0.110 | 0.005 |
| 3 months after treatment(mm) | 1.58 ± 0.17 | 1.49 ± 0.14 | −0.095 | 0.011 |
- Note: A, Vertex; B, left frontal area.
3.3 Trichoscopy count results
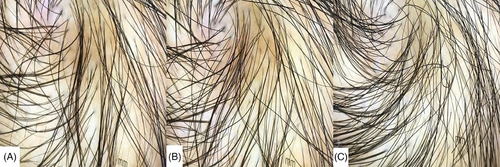
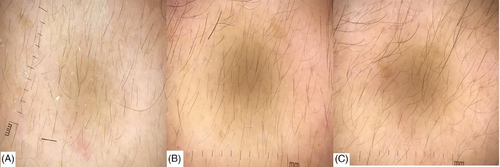
No statistically significant differences were observed in hair count between the botulinum toxin and control groups before treatment and 1 month and 3 months after treatment (p > 0.05, Table 12 and Figures 6 and 7).
|
Control group (A, n = 18) |
Botulinum toxin group (B, n = 72) | B-A | p-value | |
|---|---|---|---|---|
| Before treatment(root/cm2) | 95.39 ± 17.40 | 93.69 ± 17.39 | −1.017 | 0.309 |
| 1 month after treatment (root/cm2) | 96.33 ± 19.74 | 95.56 ± 17.45 | −0.647 | 0.518 |
| 3 months after treatment (root/cm2) | 98.78 ± 18.05 | 96.08 ± 15.97 | −0.540 | 0.589 |
- Note: A, Control group; B, botulinum toxin group.
4 CONCLUSIONS
AGA pathogenesis is mainly related to dihydrotestosterone (DHT).21 and transforming growth factor β-1.22 DHT is a steroid hormone (androgen) produced by the gonads.23 Excessive binding of DHT to androgen receptors affects the growth cycle of hair follicles, leading to gradual thinning and shortening, ultimately inhibiting hair growth.21, 24 When hair follicles enter the shedding phase, transforming growth factor β-1 is overexpressed in dermal papilla cells induced by androgens, which accelerates the shedding of hair follicles and causes hair loss.22
Botulinum toxin is a neurotoxin produced by Clostridium botulinum, which can block nerve transmission and cause muscle paralysis.21 The results of this study showed that the patients in the botulinum toxin group had wider follicle average width and longer follicle average length 1 month and 3 months after treatment (p < 0.05) compared with those in the control group. Moreover, the follicle average width and length gradually increased with the increase in treatment time in the botulinum toxin group (p < 0.05). These results suggested that the local injection of type A botulinum toxin promoted hair follicle growth, which might be related to the following factors: local injection relaxed muscles, increased local blood flow, and decreased DHT production25; it reduced the activity of transforming growth factor β-1 and inhibited follicles from transitioning to the telogen phase26; injection-induced changes in the mechanical forces in the scalp reduced occipitofrontalis muscle pressure.22 Mechanical forces, including osmotic pressure, fluid shear stress, tension, and so forth, are related to environmental factors. Also, they can regulate cell function, mediate cell development, and maintain the stability of blood vessels, skeletal muscles, and so forth.27 Increased occipitofrontalis muscle pressure can accelerate hair loss,22 whereas botulinum toxin injection therapy can reduce occipitofrontalis muscle pressure, interrupt the telogen phase of hair follicles,22 and stimulate hair follicle growth. The concept that reduced occipitofrontalis muscle pressure can stimulate hair follicle growth can explain the follicular changes in the control group after treatment, although this phenomenon was not statistically significant.
The pattern of hair loss in AGA typically follows a characteristic sequence, with a decrease in hair volume occurring first at the frontal and temporal hairlines, followed by the crown of the head.10 Consequently, the follicular changes occur first at the frontal and temporal hairlines, followed by the crown.22 Different regions of the scalp had varying hair growth rates, with the crown area exhibiting the fastest growth, approximately 0.5 mm per day.28 This study showed that the changes in follicles were observed at the vertex 1 month after treatment with type A botulinum toxin in patients with AGA and the left frontal area 3 months after treatment. The average length of hair follicles at the vertex was longer than that in the left frontal area after treatment. This indicated that hair follicle reversal occurred after injecting the same unit of type A botulinum toxin, and the difference in hair follicle reversal between the vertex and left frontal area might be related to hair follicle involvement and hair growth rate.
The hair follicles were counted within a 12.7-mm width of the image in this study. The results indicated no statistically significant differences in follicle count between the botulinum toxin and control groups 1 month and 3 months after treatment. This might be because the limited ultrasound cross-section was not sufficient to demonstrate the treatment effects. Future research could consider incorporating three-dimensional ultrasound to assess treatment efficacy more comprehensively.
Topical injections of botulinum toxin can affect seborrheic dermatitis. However, Bazargan et al. did not recommend its use for treating seborrheic dermatitis because they considered its therapeutic efficacy as controversial.29 The topical injections of type A botulinum toxin affected the number of hairs in patients with AGA. Previous studies on the treatment of AGA with type A botulinum toxin demonstrated that the differences in drug dosage, injection sites, and injection frequency resulted in varying treatment effects, as evidenced by the differences in hair count per square centimeters. Zhou et al.30 injected 100 units of type A botulinum toxin at 30 injection sites, including the frontal, temporal, auricular, and occipital muscles, with injections performed every 3 months (a total of two injections). Shon et al.4 injected 30 units of type A botulinum toxin intradermally at the alopecia site every 4 weeks (six injections). These studies showed no statistically significant differences in hair count per square centimeters 3 months after treatment compared with that before treatment, with an increase observed 6 months after treatment. This suggested that the hair count remained unchanged 3 months after treatment with type A botulinum toxin, with a noticeable increase observed after 6 months. Consistent with this, the results of our study also showed no change in hair count 1 month and 3 months after treatment in the botulinum toxin group. However, Zhou et al.13 demonstrated changes in hair count per square centimeters 3 months after treatment when injecting 100 units of type A botulinum toxin into the auricular, occipital, frontal, and temporal muscles every 3 months (a total of four injections).
Our study showed changes in follicle average width and length 1 month after treatment at the vertex and 3 months after treatment in the left frontal area. However, no change in hair count was observed 3 months after treatment. This indicated that the changes in follicle width and length occurred earlier than the changes in hair count after treatment with type A botulinum toxin, suggesting that the follicular changes observed using ultrasound preceded the changes observed using hair count using trichoscopy.
The limitations of this study were the lack of pathological evidence for the follicular changes observed via ultrasound and its single-center design. Future research necessitates larger sample sizes and multicenter data for validation. This study observed the changes only up to 3 months after treatment. The lack of longer observation periods might have led to inadequate results in some cases, such as changes in the number of hairs counted using trichoscopy.
Overall, the width and length of the hair follicles were identified as effective parameters for evaluating the efficacy of type A botulinum toxin in treating AGA. The application of ultrasound enabled early and effective assessment of type A botulinum toxin therapy for AGA. Furthermore, combining ultrasound with trichoscopy provided a more comprehensive evaluation of the efficacy of type A botulinum toxin therapy for AGA because it incorporated a broader range of evaluation parameters.
ACKNOWLEDGMENTS
I would like to express my gratitude to all those who participated in this study. I am even more grateful to my supervisor, Mr. Qi Ma, who provided me with assistance in research design, case collection, and paper revision.
CONFLICT OF INTEREST STATEMENT
The authors have no conflict of interest to declare.
Open Research
DATA AVAILABILITY STATEMENT
The data that support the findings of this study are available from the corresponding author upon reasonable request.


