Restoration success varies based on time since restoration in a disturbance-dependent ephemeral wetland ecosystem
Author contributions: all authors contributed to study design and collected data; HLC, GKHB performed the analyses; HLC led the writing of the manuscript; all authors contributed to the final manuscript and gave final approval for publication.
Abstract
Habitat restoration frequently focuses on reaching an idealized steady state, but this is unrealistic for disturbance-dependent ecosystems where temporal variability is inherent and habitat conditions are expected to fluctuate. Understanding the ways in which the outcomes of restoration change over time in disturbance-dependent ecosystems can better inform adaptive management plans and increase the likelihood that restoration efforts will be effective. We conducted a decade-long restoration experiment to test how restoration efforts to increase disturbance levels impact habitat quality and populations of an endangered butterfly over time. We show that changes in plant communities as a response to disturbance vary depending on time since restoration, with target host plants initially increasing and peaking several years postrestoration but then declining. In the absence of further disturbance, butterfly population sizes follow a similar pattern, with population declines concurrent with declines in host plants. Due to this nonlinear response, management actions within disturbance-dependent ecosystems need to include long-term monitoring in order to accurately capture changes in habitat response, as well as active, adaptive planning that shifts according to current system stability. Restoration efforts within these dynamic habitats are more likely to succeed when temporal variability is explicitly tracked and multiple cycles of restoration are considered as part of management actions.
Implications for Practice
- Long-term, continual monitoring is needed to understand when target species peak postrestoration in disturbance-dependent ecosystems, and therefore when management actions such as additional restoration need to occur in response.
- Restoration that mimics disturbance may be less successful with subsequent cycles, necessitating additional plans to achieve population persistence.
Introduction
Ecological restoration of habitats in disturbance-dependent ecosystems remains a challenge (Suding 2011). Restoration programs often focus on an idealized definition of high-quality habitat and assume postrestoration habitat conditions are either static over time or steadily improving toward some preferred state (Matthews et al. 2009). However, disturbance-dependent ecosystems are highly dynamic and, due to natural successional processes, over time restored sites may decline in quality and show increased variability postdisturbance (Hobbs & Harris 2001; Suding et al. 2004; Atkinson et al. 2022). Many ecosystems experience natural degradation–improvement–succession cycles initiated by disturbance events such as fires, beavers creating and then abandoning ponds, hurricanes forming forest gaps, and periodic grazing by migratory ungulates (Suding et al. 2004). Restoration that aims to mimic disturbance through multiple cycles of restoration over time often fails to revert habitat to idealized standards; as a result, successful restoration of disturbance-dependent ecosystems over the long term can be elusive or transient (Young et al. 2015; Abella et al. 2020; Collins et al. 2021).
One of the most challenging disturbance-dependent ecosystems to restore is temporary or ephemeral wetlands (Middleton 1999; Calhoun et al. 2017). Many ephemeral wetlands require regular disturbances to retard successional forces, such as woody encroachment (Conway et al. 2010; Calhoun et al. 2017). The restoration of such ecosystems requires extensive knowledge about how local communities respond to disturbance, and whether restoration actions that reestablish specific targeted species or overall biodiversity are effective in the long term (Moreno-Mateos et al. 2012). After the initial restoration occurs, subsequent restoration that is either too soon or too late in the successional cycle may impede recovery of target species. Striking the right balance in timing is critical for both successful recovery and cost-effective management, but where that balance lies is unknown for many targets of restoration (Brudvig 2011). Implementing restoration at the right time is critical given that many ephemeral wetland ecosystems that depend on disturbance also harbor rare or threatened species (Gorman et al. 2013; Klaus & Noss 2016; Baecher et al. 2018) or high levels of biodiversity (Seabloom & van der Valk 2003; Mitchell 2016).
We conducted a decade-long restoration experiment to assess the temporal variability of disturbance-dependent ecosystems in response to restoration, with a focus on ephemeral wetlands that support the only known populations of St. Francis' satyr (Neonympha mitchellii francisci), a U.S. federally endangered butterfly. The degradation of St. Francis' satyr habitat, combined with increased human activity in the region, have necessitated management intervention to ensure butterfly persistence (Cayton et al. 2015); however, it is unclear how often that intervention should occur. Because habitat conditions are naturally short-lived across the landscape, multiple cycles of restoration are likely crucial to recovery success (Fig. 1). In the case of St. Francis' satyrs, temporal shifts in host plant population size and butterfly population numbers may mirror each other, creating the need to better assess and monitor target species as conditions change postrestoration. Many at-risk butterfly species are particularly dependent on habitat maintained by disturbance (Haddad 2018; Schultz et al. 2019), which, even though it initially reduces populations, is required for butterfly persistence (Weiss 1999; Johst et al. 2006; Warchola et al. 2018).
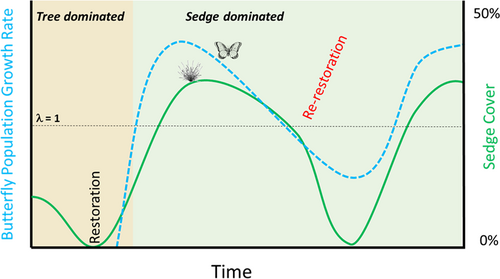
Following several years of declining St. Francis' satyr population size, we began efforts across multiple streams to restore wetland habitat and determine how butterflies and their host plant populations respond to restoration over a multiyear time scale. Although the region includes disturbance-dependent ephemeral wetlands that support several species of conservation concern (Erwin et al. 2016), to date few studies have looked at how invertebrate communities might respond over time to restoration activities in these wetlands (Schowalter 2012). Previous work on St. Francis' satyr has shown that the creation of restored habitat patches has tripled the amount of butterfly host plants (Aschehoug et al. 2015), and that understanding butterfly response to restored habitat is critical for creating and maintaining sustainable populations (Cayton et al. 2015; Henry et al. 2019). With this experiment, we demonstrate how restoration impacts are not consistent across time, and that planning for multiple restoration cycles is critical for managing disturbance-dependent ephemeral wetlands for long-term success.
We asked the following questions: (1) does restoration have a significant effect on the size of butterfly host plant populations; (2) how does the effect of restoration on plant population size change over time since restoration and number of restoration cycles; and (3) how does butterfly population size change as a function of plant population size?
Methods
Study Site and Species
The St. Francis' satyr is a federally endangered butterfly found only on Fort Bragg Military Installation in central North Carolina, U.S.A. It inhabits ephemeral wetlands that occur along permanent headwater streams within an upland matrix dominated by longleaf pine forest. These wetlands vary greatly in size and are dependent on two types of disturbances: (1) flooding that occurs when beavers create dams along stream corridors and (2) fires that retard woody succession within the wetland once beavers abandon a region (Bartel et al. 2010). Host plants for the St. Francis' satyr include bunch-forming sedges in the Carex genus, particularly C. mitchelliana and C. atlantica, which require saturated soils and a relatively open canopy with limited hardwoods present (Kuefler et al. 2008). The extirpation of most beavers from the region by humans a century ago, along with the suppression of fire and increased human activity in the form of agriculture, development, roads, and foot traffic, has led to a limited number of connected streams that support St. Francis' satyr populations (Cayton & Haddad 2018). Currently the amount of available St. Francis' satyr habitat is thought to comprise less than 10 ha across a limited number of wetland sites, supporting an overall St. Francis' satyr population size in the low thousands (Cayton et al. 2015).
Restoration Experiment
To test the temporal variability of sedge and butterfly populations in response to restoration, we initiated a long-term restoration experiment on Fort Bragg in 2011 at two unconnected sites (site A and site D; names redacted for species protection) (Cayton et al. 2015). We created 12 plots that were approximately 30 × 30 m (4 at site A, 8 at site D), each bisected by a central stream and with a 10-m buffer in between plots (Fig. S1). Plot dimensions were chosen based on average St. Francis' satyr movement distances, the majority of which are less than 25 m (Kuefler et al. 2008). We randomly assigned one of four treatments to each plot (one full replicate at site A and two full replicates at site D): (1) damming using 0.5 m high and 1 m wide water-filled temporary coffer dams (Aquadam Inc., Scotia, CA, U.S.A.) across the length of the downstream edge of the plot; (2) hardwood removal of approximately 90% of trees and shrubs to create an open canopy and exposed ground; (3) both damming and hardwood removal; and (4) control with no treatment. The use of hardwood removal and coffer dams was meant to directly mimic the scale and extent of beaver impoundments and fire seen naturally at ephemeral wetlands in the landscape (Cayton et al. 2015). This represents the first use of these restoration techniques to mimic natural disturbances within the St. Francis' satyr range. Subsequent analysis showed that damming did not have a significant effect on target sedges (Aschehoug et al. 2015); therefore, data were pooled into plots with hardwood removal, which we refer to as restored plots, and plots with no hardwood removal, which we refer to as controls.
To expand sample size and increase the amount of available St. Francis' satyr habitat, at site A we added one additional plot downstream in 2013, 2016, and 2017, and at site D we added one additional plot downstream in 2013, 2015, and 2016, and two plots downstream in 2017. All additional plots received a treatment of hardwood removal only, for a total of 20 plots created between 2011 and 2017. Plots were monitored for a minimum of 5 years and a maximum of 11 years. Ten plots were restored once at their initial creation, nine plots had at least half of the plot restored twice (i.e. re-restored) 4–8 years after initial restoration, five plots were transitioned from control to restored 3–9 years after being created, and one plot remained as a control with no restoration for the 11-year duration of the study.
To assess sedge response to restoration over time, we conducted annual vegetation surveys for all plots between April 1 and May 9 from 2012 to 2021, prior to seasonal growth. Within each plot we established 27 uniformly distributed 1.5 × 1.5–m permanent quadrats. Within each quadrat we used visual surveys to record percentage cover of total Carex species, which included C. mitchelliana, C. atlantica, C. lurida, C. glaucescens, and Carex spp. unknown. A comparison of sampling data in 2015 showed that sampling all 27 quadrats led to the same results as sampling half the amount of quadrats, therefore starting in 2015 we sampled every other quadrat (i.e. 13 or 14 quadrats per plot). Total number of quadrats sampled across all plots each year ranged from 157 to 324. Vegetation data were not collected in 2014. Quadrats from plots that transitioned from control to restored, or from restored to re-restored, were included in the treatment corresponding to their state at the time.
To determine butterfly response to restoration over time, we monitored St. Francis' satyr populations within each plot in two time periods each year from 2012 to 2021 when adult butterflies were present: from mid-May to mid-June (first flight period), and from mid-July to mid-August (second flight period). During these two flight periods we conducted daily surveys for 15 minutes along fixed transects in each plot and recorded the number of St. Francis' satyrs observed. To better correlate the scale at which butterfly presence and vegetation were each measured, beginning in 2018 we divided each plot into subplots that were approximately 10 m x 10 m (average 9 subplots per plot, range = 3–12) that each contained at least one vegetation quadrat. Subplot size was chosen based on the smallest area comparable to vegetation quadrats that was still large enough to accommodate average individual butterfly movement (Kuefler et al. 2008). We then recorded the subplot location of each butterfly during surveys. To assist in re-colonization of restoration sites, we marked a small number of captive-reared butterflies with permanent markers and released them at each site from 2012–2020 (average 29 butterflies per year, range = 0–58), which represents a small proportion of the total population. Only wild (i.e. unmarked) individuals were recorded in surveys and used in analysis. We estimated butterfly population size using the Pollard–Yates (PY) index, which is based on daily counts of butterflies that we observed while walking on fixed transects and calculated as the sum of weekly average counts (Pollard 1977). This index is well correlated with population estimates based on capture–recapture methods, and is easily compared within sites across years and flight periods (Haddad et al. 2008).
Analysis
All analyses were conducted in R (R Core Team 2020). To determine if restoration had a significant effect on percent cover of all Carex species combined in a plot, we conducted a two-way mixed analysis of variance (ANOVA) using treatment (control [n = 6] vs. restored [n = 14]) between plots, time since restoration within plots, and the interaction between the two as fixed effects, and plot and quadrat as random effects. Data from each site were analyzed separately to distinguish site effects from main effects, and model assumptions were checked using diagnostic plots. We omitted quadrats that were on their second cycle of restoration and quadrats in restored plots that were also analyzed in control plots to avoid the repetition of quadrats within the analysis.
To determine if restoration had a significant effect on butterfly PY index, we conducted a two-way mixed ANOVA using treatment (control [n = 6] vs. restored [n = 14]) between plots, time since restoration within plots, and the interaction between the two as fixed effects, and plot as a random effect. Data from each site were analyzed separately to distinguish site effects from main effects, and model assumptions were checked using diagnostic plots. We omitted plots that were on their second cycle of restoration.
To test the effects of time since restoration on percent cover of sedge, we performed a linear mixed effects analysis using the lmer function in the lme4 package (Bates et al. 2015). The global model predicted total percent of Carex in restored plots (arcsine transformed, n = 19) and contained the fixed effects of site, restoration status (whether a plot had been restored once vs. more than once, i.e. re-restored), time since restoration as both a linear and quadratic term, and all interaction terms; random effects included a unique identifier for vegetation quadrat and a unique identifier for plot to control for nested effects. We performed model selection procedures using the dredge function in the MuMIn package (Bartón 2009) and assessed model performance using diagnostic plots. We used Akaike information criterion (AIC) to rank models (Burnham & Anderson 2002), and present the top five models (Table S1).
We tested the effects of percent cover of sedge on butterfly population size with a generalized linear mixed effect analysis for negative binomial distributed zero-inflated data using the glmmTMB function in the glmmTMB package (Brooks et al. 2017). The response variable was the cumulative total number of butterflies detected in a subplot of a restored plot (n = 13) during a flight period. The global model contained the fixed effects of site, the average percentage of total Carex species detected in a subplot (arcsine transformed), flight period, year, and all interaction terms; random effects included a unique identifier for subplot and a unique identifier for plot to control for nested effects. Because the number of vegetation quadrats varied by subplot (average = 1.9, range = 1–6), we included a weighting factor that divided the total number of quadrats in each subplot by the highest number of possible quadrats (i.e. 6) to give bias toward subplots that had a greater amount of information about vegetation. We used a zero-inflated model to account for overdispersion in the butterfly count data and modeled the excess number of zeros as a function of site, flight, and year. We performed model selection procedures using the dredge function and assessed model performance using diagnostic plots. We used AIC to rank models, and present models with ΔAIC ≤2.
Results
Both sites had a significant interaction between the effects of treatment and time on sedge cover, but patterns of response to treatments differed. At site A, average percent cover of all Carex species across time since restoration was significantly higher in restored plots than in control plots (F[1,31] = 22.428, p < 0.001) (Fig. 2A), with percent cover changing nonlinearly with time since restoration (F[4,139] = 28.126, p < 0.001) and a significant interaction between treatment and time (F[4,139] = 2.547, p = 0.04). At site D, average percent cover of all Carex species did not differ significantly between restored and control plots (Fig. 2B); however, percent cover changed nonlinearly with time since restoration (F[4,138] = 4.247, p = 0.002), and there was a significant interaction between treatment and time (F[4,138] = 7.666, p < 0.001).
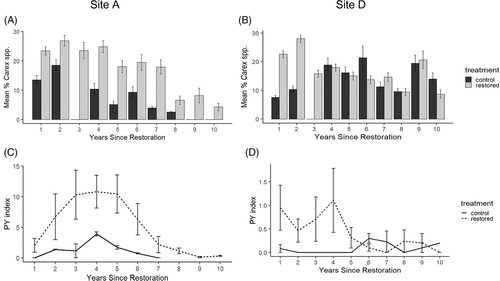
The temporal dynamics of sedge cover differed across sites. Total Carex at site A averaged 11% in control plots (n = 225, range = 0–60, SD = 11.1) and 21% in restored plots (n = 543, range = 0–80, SD = 17.4) across all years. The highest average percentage of total Carex at site A occurred 2 years after restoration in control plots (n = 54, mean = 19, SD = 12.9) and 2 years after restoration in restored plots (n = 116, mean = 27, SD = 3.7) (Fig. 2A). Total Carex at site D averaged 12% in control plots (n = 375, range = 0–90, SD = 11.8) and 19% in restored plots (n = 1,110, range = 0–95, SD = 17.3) across all years. The highest average percentage of total Carex at site D occurred 6 years after restoration in control plots (n = 26, mean = 21, SD = 20.6) and 2 years after restoration in restored plots (n = 216, mean = 28, SD = 19.6) (Fig. 2B). These overall patterns shifted for the two key Carex species, with highest percentage of C. mitchelliana in restored plots occurring 4 and 9 years after restoration in sites A and D, respectively, and highest percentage of C. atlantica in restored plots occurring 2 years after restoration for both sites A and D (Supplement S1; Fig. S2).
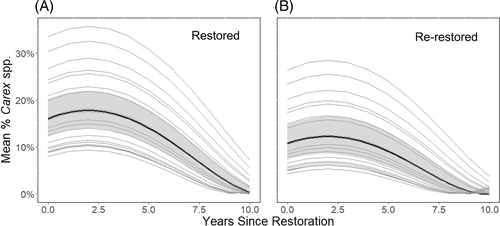
The top model (ΔAIC ≤2) selected for predicting total amount of Carex species included re-restored status, and time since restoration as both a linear and quadratic variable (Table S1). This pattern held true regardless of site. When the main and random effects from the top model were plotted, peak Carex amounts varied according to restoration cycle: the top model predicted that restored plots would reach a maximum of 17% sedge cover approximately 2.3 years postrestoration (Fig. 3A) while re-restored plots would to reach a maximum of 12% sedge cover approximately 2.4 years postrestoration (Fig. 3B).
St. Francis' satyr PY index across time since restoration showed differing patterns between restored and control plots at the site-level: control and restored plots were significantly different at site A (F[1,4] = 17.692, p < 0.001) (Fig. 2C), although not at site D across all years (Fig. 2D). PY index at site A averaged 1.3 in control plots (n = 14, range = 0–4.2, SD = 1.4) and 5.7 in restored plots (n = 47, range = 0–32.6, SD = 7.6). PY index at site A peaked 4 years after restoration in control plots (n = 2, mean = 3.9, SD = 0.4) and 4 years after restoration in restored plots (n = 5, mean = 10.8, SD = 6.0) (Fig. 2C). PY index at site D averaged 0.1 in control plots (n = 23, range = 0–0.5, SD = 0.1) and 0.5 in restored plots (n = 92, range = 0–7.9, SD = 1.4). PY index at site D peaked 6 years after restoration in control plots (n = 2, mean = 0.3, SD = 0.1) and 4 years after restoration in restored plots (n = 10, mean = 1.1, SD = 2.2) (Fig. 2D).
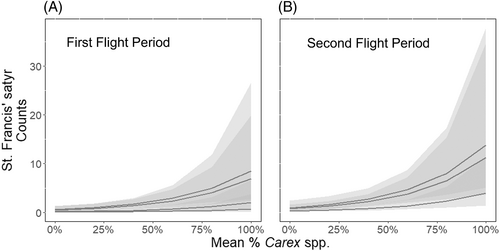
The top models (ΔAIC ≤2) selected for predicting PY index of butterflies all included flight period, total sedge, and year (Table S2). Butterfly counts maintained a positive correlation with total sedge for both periods but were expected to be higher in the second flight period (Fig. 4A) than in the first flight period (Fig. 4B). Site and the interaction between flight and year had weak or equivocal influence on butterfly counts, and no factors strongly predicted excess zero counts.
Discussion
Our use of a carefully designed experiment that explicitly tests the difference between treatment and control over a decade of management actions provides direct evidence that the impacts of restoration in the ephemeral wetland ecosystem are significant and change over time. This evidence supports our conceptual model of temporal shifts in species responses, and allows us to determine the extent of system stability and evaluate how management practices can better adapt to changing conditions over longer time frames. Restored plots contained higher amounts of sedge than control plots in all years postrestoration at site A and initial years postrestoration at site D, and butterfly populations in restored plots remained larger than in control plots for almost all years at both sites. However, peak levels of sedge and butterflies seen in early years postrestoration decline in later years for both sites, with both sedge amount and butterfly populations decreasing or approximating levels seen in control plots. This shift provides a template for planning management response for disturbance-dependent ecosystems in general and highlights how long-term monitoring is necessary to accurately assess the impacts of restoration (Schultz & Crone 1998; Brudvig 2011; Wilsey 2021).
The status of a plot as being restored for the first or second time is also significant, which suggests that not only time since restoration matters for predicting sedge amount, but also the number of cycles of restoration that have occurred. Predictions of sedge amount split by restoration status show that plots on their second restoration cycle are likely to have peak sedge amount at the same time as plots on their first cycle, but that peak is likely to be lower. This may be due to ecological processes, such as changes in soil composition or hydrology over time that impact sedges (Allessio Leck & Schütz 2005; De Steven et al. 2010), or possibly differences in methodology, in that restoration in the second cycle is less intensive in removing hardwoods (particularly woody undergrowth) in an effort to protect already established sedges. Regardless of the underlying mechanisms, this result has long-term implications for management: if subsequent restoration actions are increasingly less effective than the initial action, then restoration as a management strategy for improving habitat quality may have a time limit on how long it can be useful. Additional strategies, such as a greater focus on preserving abiotic factors in the soil (Morris et al. 2013) or community involvement that prevents wetland degradation (Scholte et al. 2016; Sinthumule 2021) may need to be integrated into planning to ensure sustainable habitat improvement.
Predicted butterfly population sizes reflect this temporal trend of sedge growth. The most important factor in explaining butterfly numbers after flight period is amount of sedge cover, followed by year. Butterfly population size increases directly in response to increased amount of overall sedge, with higher numbers seen during the second flight period when St. Francis' satyrs are known to be more abundant (Kuefler et al. 2008). Effective management for St. Francis' satyrs will likely need to focus on maintaining habitat with abundant sedges through regular hardwood removal at least every 4 years to ensure that butterfly populations do not drop below sustainable levels. The variability seen in butterfly population size over time underscores the dynamic nature of the disturbance-dependent ecosystem and highlights the regularity of population fluctuations that necessitate continual management intervention.
Examples of at-risk butterflies that inhabit disturbance-dependent ecosystems are numerous; however, studies on the effects of habitat restoration on these butterfly populations rarely use both experimental framework and a long-term approach (e.g. Weiss 1999; Warchola et al. 2018; Henry et al. 2020). Our use of a long-term experimental design provides a novel result for understanding how butterfly populations may fluctuate over time, and does so in a more robust way than the tradition of comparing restoration results to either dynamic reference sites or historical knowledge (Balaguer et al. 2014; Higgs et al. 2014; Atkinson et al. 2022). Determining the effectiveness of restoration requires several years of monitoring, especially with at-risk butterflies, where a short time span of only one flight period or one season is unlikely to accurately assess critical shifts (Himes Boor et al. 2018). Continuous monitoring over several seasonal cycles can best determine focal species response to shifts in host plant populations and population trends.
The inconsistent effect of time on the focal species and its host plants highlights the complexities of managing habitats where variability is integral to species' persistence. Key to successful management is the ability to regularly monitor both habitat conditions and target species population size, and adapt management goals to current conditions across long time frames and according to widely accepted restoration standards (Palmer et al. 2005). This applies across numerous types of disturbance-dependent ecosystems that benefit from management intervention, such as fire-adapted ecosystems (Warchola et al. 2018) or storm-influenced habitats (Henry et al. 2020). Ephemeral wetlands, where complex hydrology and high biodiversity can greatly impact conservation priorities, represent the most iconic of this type of habitat under threat (Calhoun et al. 2017). The long-term (decade or longer) restoration of wetlands can lead to mixed results, in some cases creating wetlands comparable to natural reference sites (Hopple & Craft 2013), and in other cases showing degradation over time that creates suboptimal habitat conditions (Matthews & Spyreas 2010). Our results show that patterns of overall host plant amount may mask variation in individual species trends, with adaptive management plans needing to account for differences in how each target species may respond over time. Because of this, long-term monitoring is needed to assess the extent to which restoration actually mimics beneficial disturbance events and when peak habitat quality occurs.
The importance of long-term monitoring was emphasized by site differences in both sedge growth and butterfly response. While site A showed a clear pattern of significantly more sedge at restored sites than control sites across all years, site D was less consistent in sedge population trends. The sedge response at site D may be due to several factors: more pronounced effect of spillover of sedge seeds between restored and control plots (Craig et al. 2011; Blitzer et al. 2012); differences in local microclimate or abiotic factors that dampen the effects of restoration at a site level (Raney et al. 2014); or differing initial seed banks that lead to altered conditions between sites (Donath et al. 2003; Allessio Leck & Schütz 2005). These site differences extended to butterfly populations, with site D supporting a smaller population and showing less consistent population trends, particularly once it has been several years since restoration. Regardless of underlying mechanisms, these differences underscore the necessity of conducting continual, long-term monitoring in order to discern local patterns of restoration response across any type of disturbance-dependent ecosystem.
Here we have focused on the temporal variability of restoration in disturbance-dependent ecosystems; however, one limitation to our study is the exclusion of spatial variability. It is unlikely in many cases that all habitat can be restored at once, as a strong source population is often needed to successfully repopulate restored habitat (Sundermann et al. 2011; Aavik & Helm 2018; Lanta et al. 2020). This creates a trade-off between spatial and temporal restoration, where only a portion of degraded habitat can be restored at any given time in order to leave some target populations intact while restoration activities take effect. In many cases, both spatial and temporal restoration need to be weighed in order to optimize restoration success (Wilson et al. 2011). Future research should examine whether restoration of a fraction of plots within the landscape at staggered time intervals can increase habitat quality while simultaneously maintaining focal species populations for recolonization.
Successful restoration is rarely achieved with a “one and done” approach, especially in ecosystems where temporal variation in habitat quality due to disturbance is an inherent characteristic. Long-term monitoring and active, adaptive management are integral to ensure restoration success across dynamic landscapes and should be better integrated into planning (Valkó et al. 2021; Wilsey 2021). With a clear timeline for determining how restoration activities are effective, it is easier to fully understand which actions influence population size, and therefore assess other critical conservation measures such as demographic parameters and species behavior that better inform management plans.
Acknowledgments
The authors express their gratitude to Fort Bragg Military Installation for its continued support, and to the numerous field technicians who helped collect data in the field. We thank L. Lach, S. Ashpole, and several anonymous reviewers for their feedback on the manuscript.


