Effect of pH on rheotaxis of bull sperm using microfluidics
Contents
The aim of the present research is to study the effect of pH values on the sperm rheotaxis properties. Semen collected from bulls was diluted with SOF medium (1:10). pH of the medium was adjusted using a digital pH meter to the following pH values: 6.0, 6.2, 6.4, 6.4, 6.8, 7.0. All kinetic parameters of sperm (n = 3,385) were determined through a computer-assisted sperm analysis (CASA) system using microfluidic devices with controlled flow velocity. The following parameters were determined: total motility (TM%), positive rheotaxis (PR%), straightline velocity (VSL, μm/s), average path velocity (VAP, μm/s), linearity (LIN, as VSL/VCL, %), beat cross-frequency (BCF, Hz) and curvilinear velocity (VCL, μm/s). Nitric oxide, calcium and potassium were estimated in semen at different pH values. To confirm the effect of nitric oxide and K+, we used sodium nitroprusside (an NO donor) and KCL as (a K+ donor) to see their effect on sperm PR%. The results showed no difference in TM% at pH (6–7). The PR% was the lowest at pH 6 and 7. The best parameters for the PR% were at pH 6.4–6.6. The concentration of Ca+2 did not change at different pH values. The mean NO values decreased with the increase of pH; however, the mean values of K+ increased with the increase of pH. Addition of high concentration of NO and K+ to the semen media at fixed pH level had a negative effect on TM% and PR%. In conclusion, the bull sperm had the best rheotaxis properties at pH 6.4–6.6 and sensitive to the change of seminal NO and K+.
1 INTRODUCTION
Sperm rheotaxis, which is tendency of a sperm to orient and swim with or against the flow of surrounding fluid, is becoming important for understanding how mammalian sperm navigate through the female genitalia to reach the ovum (El-Sherry, Elsayed, Abdelhafez, & Abdelgawad, 2014; Kantsler, Dunkel, Blayney, & Goldstein, 2014; Miki & Clapham, 2013; Tung, Ardon, Fiore, Suarez, & Wu, 2014). Coitus increases the secretion of oviduct dramatically and induces fluid flow that guides sperm cells swimming against the flow (i.e. exhibiting positive rheotaxis) to the ovum. Oviductal secretion serves different roles including clearing the oviduct of debris, lowering viscosity of the liquid in the genital tracts and, according to recent studies, creating the stream that guides sperm cells to the oocyte (Miki & Clapham, 2013).
Recently, it was reported that positive rheotaxis has a physiological importance for the sperm travel through the genitalia to the site of fertilization in mice, human (Miki & Clapham, 2013; Suarez, 2010) and bull (El-Sherry et al., 2014). Sperm rheotaxis was studied in microfluidic systems to understand how sperm interact with several flow conditions as flow speed, channel geometry and wall topography to confirm that rheotaxis is not a random effect. These previous studies showed that approximately 80% of motile sperm cells swim against the flow and reverse their swimming direction when flow direction is reversed (El-Sherry et al., 2014). Moreover, when the flow speed increased, the sperm speed increased to counteract the flow.
The genital tract pH has an effect on the entire process of reproduction, whether in males or females. Spermatogenesis itself is sensitive to pH and needs an acidic environment. In the female, an alkaline pH is required for sperm capacitation, fertilization and even early stage of embryo development (Liu, Wang, & Chen, 2012). The epithelial lining of the female and male reproductive tracts contains various types of acid–base transporters to control pH (Liu et al., 2012). Any condition that causes a disturbance of acid–base balance in the reproductive tract or epithelium will cause infertility or at least subfertility (Chan et al., 2009; Lishko et al., 2012; Pastor-Soler, Pietrement, & Breton, 2005).
Sperm cells are exposed to changes in the ionic composition of their surrounding fluid in the different stages they pass through until reaching the ovum. In most mammalian species, the sperm is immotile in testis because of the acidity of sperm intracellular pH (pHi). Sperm motor protein (dynein ATPase), which causes the flagellar beat, is highly pH dependent (Giroux-Widemann, Pignot-Paintrand, & Feneux, 1991). In epididymis, spermatozoa face acidic media with low bicarbonate (HCO) concentration. In uterus and oviduct, the environment becomes alkaline because of high HCO concentration (Nishigaki et al., 2014). In addition, oviductal lumen pH values dramatically increase at ovulation because of HCO production in the epithelial cells lining it. These pHi and ionic changes in the oviduct should be considered to understand the physiological sperm responses (Nishigaki et al., 2014). We hypothesize that the pH modifies sperm rheotaxis in a microfluidic system. Therefore, the aim of this study was to investigate the relationship between rheotactic behaviour of bull spermatozoa and pH of the surrounding media. In addition, the effect of pH on the sperm-surrounding media of potassium (K+), calcium (Ca+2) and nitric oxide (NO) was investigated. Such relationship will help optimize the environment for assisted reproductive technologies (ARTs).
2 MATERIAL AND METHODS
2.1 Semen collection and pH calibration
The study was approved by the Veterinary Teaching Hospital's Animal Care Committee.
Semen from four healthy bulls (Holstein Friesian breed, aged 3–5 years, weight 400–600 kg) housed at Veterinary Teaching Hospital (Assiut University) was used for this study. The bulls were kept under identical feeding and managemental conditions during the whole period of the investigation. Bulls are regularly collected 2 or 3 times per week. A total of 10 ejaculates from each bull were collected with artificial vagina (AV). If a sample of poor quality was collected on first AV, a second and final semen sample was collected by AV after a 20-min rest period. Each ejaculate was diluted 1:10 (vol:vol) with synthetic oviductal fluid medium (SOF). Synthetic oviductal fluid medium (SOF) is a common medium used for in vitro fertilization (IVF) and cleaving embryos of sheep and cattle. This medium was based on the biochemical analysis of bovine oviductal fluid (Tervit, Whittingham, & Rowson, 1972). The SOF medium used in this study was based on this original formulation and subsequent modifications (Gardner, Lane, Spitzer, & Batt, 1994). pH of the medium was adjusted by adding HCL to achieve the different pH values.
2.2 Motility evaluation
All kinetic parameters of sperm (n = 3385) were determined through a home-made computer-assisted sperm analysis (CASA) system (Department of Mechanical Engineering, Faculty of Engineering, Assiut University, Egypt; the plugin can be downloaded from the following URL:http://www.assiutmicrofluidics.com/research/casa) (Elsayed, El-Sherry, & Abdelgawad, 2015). Videos of sperm cells were taken with an Optika XDS-3 inverted microscope with phase contrast (also at 40 × objectives) coupled to a Tucsen ISH1000 camera at 30 frames per second. Recorded videos were processed using a home-developed CASA and the following parameters were determined: total motility (TM%), progression parameters such as straightline velocity (VSL, μm/s), average path velocity (VAP, μm/s), linearity (LIN, as VSL/VCL, %) and vigorous parameters such as beat cross-frequency (BCF, Hz) and curvilinear velocity (VCL, μm/s).
2.3 CASA image analysis
All kinetic parameters were determined through a computer-assisted sperm analysis (CASA) program (CASA plugin for Image-J; http://imagej.nih.gov/ij/) that we previously developed for characterization of sperm motion in microfluidic environments (Elsayed et al., 2015). It has to be mentioned here that definition of motility in our CASA plugin (URL:http://www.assiutmicrofluidics.com/research/casa) is based solely on sperm swimming speed versus flow speed without including other parameters such as side-to-side movement as this was found to be more reliable in fluid flow.
2.4 Nitric oxide (NO) assay

2.5 Ionized potassium (K+) assay

2.6 Ionized calcium (Ca+2) assay


2.7 Microfluidic device fabrication
Unless otherwise specified, all chemicals used were from Elgomhoria Pharmaceuticals (Cairo, Egypt). Material for microchannel fabrication included glass wafers (Howard Glass, Worcester, MA), SU-8-25 negative resist (MicroChem, Newton, CA), diacetone alcohol (Sigma Aldrich, Steinheim, Germany) and polydimethylsiloxane PDMS (Sylgard-184, Dow Corning, Midland, MI).
Microchannels were fabricated using soft lithography (Duffy, McDonald, Schueller, & Whitesides, 1998). First, a transparency mask bearing the required microchannel design was printed using a high-resolution printer (Prismatic, Cairo, Egypt and Pacific Arts and Design, Markham, ON). Masters were prepared using glass wafers as a substrate. Wafers were cleaned in acetone, isopropyl alcohol and DI water and then coated with a 20-μm-thick layer of SU8-25 by spin coating (3,000 rpm, 1 min). SU-8 layer was then soft-baked (65°C, 2 min, and 95°C, 10 min) and exposed to UV light for 50 s. A post-exposure bake was done at (65°C, 1 min; and 95°C, 4 min) to cross-link the exposed SU-8 layer, which is then developed in diacetone alcohol for 6.5 min. The wafers were hard-baked (200°C, 15 min) to further harden the SU-8 layer.
Polydimethylsiloxane (PDMS) was prepared by mixing the monomer and curing agent at a ratio of 10:1 by weight, respectively, and then was degassed in a vacuum desiccator and poured on the SU-8 master. PDMS was cured in an oven (120°C, 30 min), and channels were then cut, peeled off the master and punched to allow for tubing connections at inlet and outlets of microchannels. Finally, a portable corona treater (Electro-Technic Products, Chicago, IL) was used to bond the PDMS microchannels permanently to a microscope glass slide as previously described (Haubert, Drierb, & Beebe, 2006) (Figure 1a). Dimensions of microchannels used in this study were 200 μm × 20 μm (WxH). Channel height was chosen to be 20 μm to keep sperm cells in focus during the experiment to facilitate data extraction with the CASA system.

2.8 Flow generation
 (1)
(1)where ρ is the liquid density, g is the gravitational acceleration, Dh is the channel hydraulic diameter, Δh is the height difference between reservoirs, C = friction factor (f) × Reynolds number (Re), μ is the liquid viscosity and L is the microchannel length (Munson et al., 2002).
 (2)
(2) (3)
(3) (4)
(4)Average liquid velocity in all experiments reported here was kept at 30 μm/s that is mimic natural fluid flow velocity inside female genital tract (Tung et al., 2014).
2.9 Experimental design
2.9.1 Experiment I
The sperm kinematic and rheotaxis assessment at different pH values were investigated. Consequently, pH of the medium was adjusted by adding HCL to achieve the following pH values: 6.0, 6.2, 6.4, 6.8 and 7.0. The normality of HCL was calculated according to the following equation:

Normality of HCL = 11.3 N.
PH was measured (at fixed room temperature) using a digital pH meter (AD1030, ADWA Hungary KFT, Hungary), which was calibrated according to the manufacturer's instructions before each measurement. The calibration was performed with at least two standard buffer solutions that span the range of pH values to be measured (the buffers at pH 4.01 and pH 10.00). Distilled water was used to clean the probe after each measurement to remove any traces of the previous measured sample. The probe was wiped to absorb any remaining water before inserted in the new sample to avoid diluting it.
2.9.2 Experiment II
NO, K+ and Ca+2 concentrations in sperm-surrounding media and effect of added NO and K+ on sperm rheotaxis at pH 6.6 were examined. Consequently, pH of the medium was adjusted by adding HCL to achieve the pH 6.6. Then, a) sodium nitroprusside (an NO donor) was added in the following concentration (30, 40 and 50 ng/ml). b) KCL (a K+ donor) was added to the following concentration (14 and 21 mmol/L).
2.10 Statistics
Data of sperm swimming speed, VAP (μm/s) and sperm motility percent were expressed as mean ± SEM. PR percentage was defined as number of PR sperm cells divided by number of motile sperm cells. All data were analysed by two-way analysis of variance (ANOVA) to determine main effects of group in addition to significant interactions within the group. The PR percentage was analysed using the chi-square test. The different means were significant at p < .05. To analyse the relation between VSL, VAP, VCL, Lin and BCF, a linear relationship has been used.
3 RESULTS
3.1 Percent of motility and rheotaxis
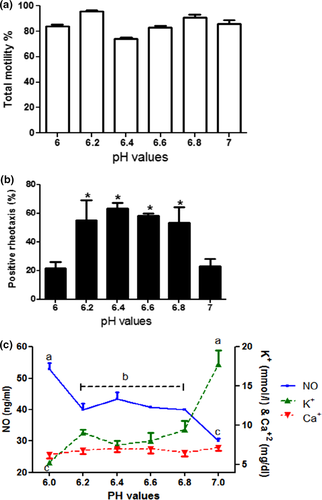
The results showed that the TM% in all ejaculate were not affected by pH (6–7) of the medium. TM% had similar values (78%–90%) with pH (6–7) (Figure 2a). On the other hand, the positive rheotaxis (PR) was sensitive to pH of the same range. A significant drop (p < .05) in the PR was found at pH 6 and 7 (21.4 ± 4.3% and 22.8 ± 5.1%, respectively), while the PR was higher in the pH, 6.2–6.8 (53–63%) (Figure 2b).
3.2 NO, K+ and Ca+2 concentration in semen
The concentration of Ca+2 did not change at pH (6–7) (Figure 2c). The mean NO values decreased with the increase of pH; however, the mean values of K+ increased with the increase of pH. NO values were higher at pH 6 (p < .05), and lower at pH 7 (p < .05) than NO values at pH 6.2 to 6.8 (Figure 2c). In contrast, the mean values of K+ were higher at pH 7 (p < .05) and lower at pH 6 than the values at pH 6.2 to 6.8 (Figure 2c).
3.3 Analyses of sperm progression and vigour parameters
CASA was used to understand changes in sperm motility and dynamics at each pH value. Two categories of parameters were used for this purpose. Progression parameters include average path velocity (VAP), straightline velocity (VSL) and linearity (LIN = VSL/VCL × 100), whereas the second category is vigour parameters which include curvilinear velocity (VCL) and beat/ cross-frequency (BCF).
The results showed that both progression and vigour parameters were affected by the change of pH values. VSL had a positive correlation with VCL in all pH values (p < .0001), while it has a negative correlation with BCF (p < .02) starting at pH 6.2 until pH 7 (p < .0001; Figure 3).
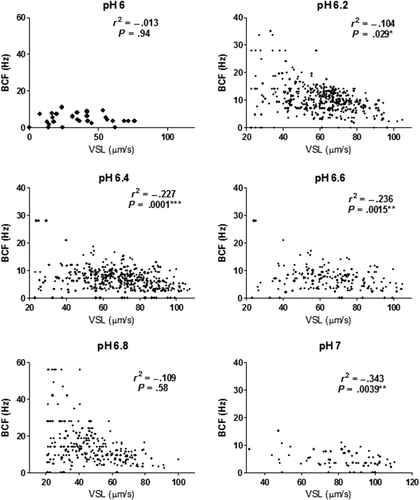
The VCL, VSL and VAP increased at pH (6.2 to 7) with exception of pH 6.8. On the other hand, BCF was lower at pH 6, 6.4 and 7, whereas it was higher at pH 6.2 and pH 6.8.
The best motility of the sperm through the flow occurred when the VSL, VAP and VCL were high and the BCF was at its lowest value which means that the sperm can swim for a long distance without much side-to-side movement, which decrease the sperm speed (Figure 4.). Best swimming velocity was detected at pH 6.4 and pH 7.

At pH 6 (sperm flushed by the flow), VAP, VSL, VCL and BCF were significantly lower than other pH values. However, sperm cells exhibited positive rheotaxis (i.e. swimming against the flow) (Figure 5, Figure 6a).

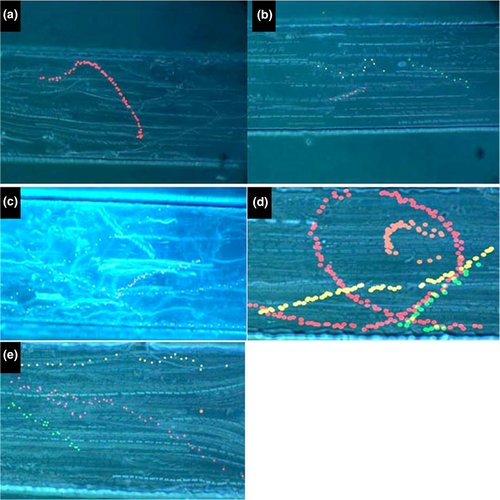
At pH 6.2 (the resistance of the flow), the sperm can resist the flow especially near the wall but is still weak to make real progression. Sperm cells stay in their position and cannot go forward. The high VCL and BCF indicated a high vigorous motility by which sperm resisted the flow but still keeping his position. As the sperm stay in his position, the LIN was higher than other pH values (Figure 5, Figure 6b).
At pH 6.4 and pH 6.6 (sperm swimming against the flow), sperm shows significant increase in parameters (VAP, VSL and VCL) with significant decrease of BCF (Figure 5, Figure 6c).
At pH 6.8, VCL, VSL and VAP decreased, while the BCF increased. The sperm swim for small distance. At that stage, the sperm can make a manoeuvre inside the channel to manage the flow. One of those manoeuvre is that the sperm swims near the wall of the channel, and if the flow moves him out on the path, the sperm can get in a circle and return back to his path or even swim through to the other side in a vertical path to reach the other side and continue his PR swimming (Figure 5, Figure 6d).
At pH 7, although the sperm has high VCL, VAP and VSL, the sperm at this stage cannot go through the flow and mainly kept its position or got flushed by the flow, as the sperm showed some degree of hypermotility (Figure 5, Figure 6e).
3.4 Effect of added NO and K on sperm rheotaxis and motility percent
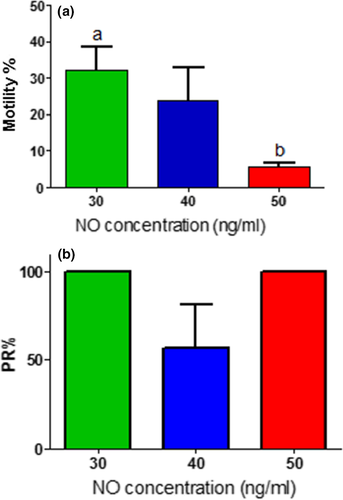
The results showed that the motility percent of the sperm decreased concomitant with the increase of the NO concentration. TM% and PR % were the best at NO 30 ng/ml (Figure 7).
Adding K+ to media decreases TM% to 16.4 ± 11.4, while PR% was 61.4 ± 10.5 at 14 mmol/L. On the other hand, all sperms at 21 mmol/L of K+ made were immotile.
4 DISCUSSION
The effect of pH on sperm motility was reported by several studies. Sperm cells are stored in the tail of epididymis at pH 5.8 immotile. Sperms become motile after mixing with the seminal plasma at pH 6.8 (Acott & Carr, 1984). Several studies suggest that when sperm cells are inseminated (naturally or artificially), they are exposed to different environmental pH. In cow, it was reported that uterine pH in heifer was 6.96 (Hugentobler, Morris, Kane, & Sreenan, 2004) while fallopian tube pH was higher than uterus and reach 7.4. pH was estimated to be (6.9 ± 0.5) for vagina, (6.2 ± 0.3) for cervix and (6.6 ± 0.3) for uterus (Wehrend, Trasch, Failing, & Bostedt, 2003).
Our result showed that the percent of motile sperms (TM%) was not significantly affected by narrow limit of pH (6–7). It was found that total motility of spermatozoa had similar values at pH 6 to pH 7; however, the sperm motility was reduced at pH 5 and 8.5. (Contri et al., 2013). Rheotaxis, on the other hand, was sensitive to pH value. PR% was high within pH value in the range between 6.4 and 6.8, whereas below 6.4 or above 6.8 PR% decreased significantly.
In our study, the lower pH 6 reduced the PR% significantly in comparison with the other pHs; moreover, all CASA parameters were reduced significantly. The sperm could not swim against the flow but get flushed. The effect of acidic pH of the sperm motility was reported on human sperm (Makler, David, Blumenfeld, & Better, 1981). It was found that the acidic pH exhibits a significant reduction of the human sperm through decreased mitochondrial activity. In bull sperm, it was observed that the acidic pH 5.5 reduced the sperm motility by causing membrane damage (Contri et al., 2013). It seems that rheotaxis is a very important mechanism for sperm selection and so combination of sperm PR and sperm integrity in the different pH values represents the most challenging test for the sperm.
At pH 7, the sperm showed high values for VSL, VCL and VAP, but the BCF and LIN were significantly lower than at other pHs. The sperm cannot move forward, but swim form one side to another. Hence, sperm cells return to the same point of progression but on the other side of the channel that explain why the LIN was lower. It was found that the pH 7 and 7.5 give the maximum potential motility of sperm (Contri et al., 2013). In our study, we found that the vigour parameters were high, but the ability to swim against the flow was lower. It was reported that the oviduct was slightly alkaline (pH 7.6) (Hugentobler et al., 2004) and that alkalinity may initiate the hypermotility of sperm. The hyperactive beating is characterized with asymmetric flagellum kinematics, increased wave amplitudes, high VCL and lateral head movement (measured through BCF) (Phillips, 1972) and explains why sperm showed high vigour parameters with reduced progression ability.
Our results showed that NO in semen had three levels; high and low levels of NO at pH 6 and pH 7 at which PR% were 21.4 ± 4.3% and 22.8 ± 5.1%, respectively. Whereas, the PR% was high at medium concentration of NO at pH 6.2–6.8. Higher and lower levels of NO have a negative effect on rheotaxis. Supporting this observation are two theories about the effect of NO on the sperm motility and viability. Adding exogenous NO to semen had inhibitory effects (Rosselli, Dubey, Imthurn, Macas, & Keller, 1995; Weinberg, Doty, Bonaventura, & Haney, 1995). On the other hand, Donnelly, Lewis, Thompson, and Chakravarthy (1997) found that the spermatozoon itself is a source of NO. Basal release of NO by spermatozoa from normal sperm samples tended to be greater than that from abnormal sperm samples, suggesting a physiological and beneficial role for endogenous NO in the preservation of sperm motility (Donnelly et al., 1997). Only basal NO level is beneficial to sperm motility while NO burst by adding an external dose of NO reduces sperm motility within 10 min (Donnelly et al., 1997). Furthermore, controlling the NO concentration to be similar to that of the normal semen increased the percentage of progressive sperm motility and sperm capacitation in vitro (Wang, He, Yan, Cai, & Chen, 2014). To confirm the effect of NO on the sperm motility and PR%, we added three levels of NO on the same sample with fixed pH. The motility decreased significantly, as we increased the NO concentration and the PR%. At high concentration of NO, all motile spermatozoa show PR and so the percent of PR was 100%. Those sperm showed PR was the strongest sperm that can resist the negative effect of the NO.
In alkaline medium, the K+ ions affect the intracellular pH (Babcock & Pfeiffer, 1987) and increase the intracellular Ca2+, causing asymmetrical beating of sperm similar to hypermotility (Ho, Granish, & Suarez, 2002).
Our results showed that at pH 7, K+ values increased significantly while the rheotaxis was decreased. The K+ was reported as a natural metabolic inhibitor and a high concentration in seminal plasma decreased sperm metabolism (Massanyi et al., 2003). To confirm our result, we added external source of K+ to the semen and we found that high level of K+ immobilized the sperm. In carp sperm (Deep-bodied freshwater fish), the media with high K+ content immobilized the flagellar movement of sperm while dilution of these media (low K+ content) triggered sperm motility (Perchec, Jeulin, Cosson, Andre, & Billard, 1995).
The results showed that the Ca was not affected by pH. It was reported that increase in the sperm internal Ca+2 and cAMP was considered as a second messenger to activate the sperm motility but it depends mainly on external trigger (Dacheux & Dacheux, 2002).
Taking together, sperm rheotaxis was significantly affected by pH values. Sperm motility and rheotaxis were optimum at pH 6.4–6.6. It seems that the PR sperm can resist the different environmental condition and so reach the fallopian tube. In conclusion, the rheotaxis, as a parameter, can provide a novel approach for semen analysis and eventually will be useful as a method for sperm selection in the management of assisted reproduction techniques.
ACKNOWLEDGEMENT
This project was supported financially by the Science and Technology Development Fund, Egypt (grant numbers 4850 and 4081).
DECLARATION OF INTERESTS
We declare that there is no conflict of interest that could be perceived as prejudicing the impartiality of the research reported.
AUTHOR CONTRIBUTIONS
We declare that all listed authors have made substantial contributions to: the research design, or the acquisition, analysis or interpretation of data; and to drafting the paper or revising it critically; and that all authors have approved the submitted version.


