Diversity, Variance, and Stability of Root Phenes of Peanut (Arachis hypogaea L.)
Abstract
Root phenes are associated with the absorptive efficiency of water and fertilizers. However, there are few reports on the genetic variation and stability of peanut (Arachis hypogaea L.) root architecture under different environments. In this study, the diversity, variance and stability of root phenes of 89 peanut varieties were investigated with shovelomics (high throughput phenotyping of root system architecture) for two years in both field and laboratory experiments. The root phenes of these peanut genotypes presented rich diversity; for example, the value of total root length (TRL) ranged from 347.84 cm to 1013.80 cm in the field in 2018, and from 55.14 cm to 206.22 cm in the laboratory tests. The root phenes of different genotypes varied differently; for example, the coefficient of variation (CV) of TRL ranged from 24.0 to 83.5 across the two-year field test. Field and laboratory evaluations were highly correlated, especially on lateral root density (LRD) and root angle (RA), and the quadrant graph analysis of LRD and RA implied that 69.7% of the roots belong to the same type. These not only further reflect root phenes stability through different environment but also demonstrate that some root phenes identified at early stage can indicate their status at later growth stage. In addition, root phenes showed a strong correlation with shoot growth, especially root dry weight (RDW), TRL and(nodule number)NN. Thus, laboratory tests in combination with field shovelomics can efficiently screen and select genotypes with contrasting root phenes to optimize water and nutrient management.
1 INTRODUCTION
Plant root systems comprise a set of phenes, or traits, that interact with each other. Phenes are the measurable component of the phenotype (analogous to the relationship between gene and genotype), which is an individual manifestation of the phenome of a species (Lynch 2011). The particular combination of states for all phenes constitutes the root architecture, morphology, anatomy, or physiology (York et al. 2013). The root phenes are of the number, length and growth angle of the different types of roots; primary, seminal, adventitious (crown roots and brace roots), and lateral roots developed from all of these root types (Bianco and Kepinski 2018). In peanut (Arachis hypogaea L.), a dicot, the root phenes that modify root distribution include the number, length and angle of basal roots, lateral root branching density and elongation, root hair, length and density (Burridge et al. 2020).
One of the key roles of roots is to secure access to water and nutrients for the plant, often in a highly heterogeneous and challenging environment. To cope with such function, plants have evolved a highly plastic, responsive and diverse root system (Lynch 1995, 2013). The predominant form of nitrogen (N) in agronomic systems is nitrate, which is highly mobile in soil and moves into deeper soil strata with the precipitation leaching or water level falling during the crop's growing season (Lynch 2013). Phosphorus (P) is immobile and is concentrated in the topsoil (Schachtman and Ayling 1998). Rapid development of root foraging in deep soil strata would increase the capture of nitrate in such environments (Lynch and Tobias 2015). Root phenes that enhance topsoil foraging were proven to be beneficial for P acquisition (Lynch 2011), while the root phenes that enhance deep-soil foraging were proven to be important for the acquisition of water and nitrate (Lynch 2013). The main factors that determine root depth distribution are the length and number of lateral roots and root angle (Araki et al. 2000, Singh et al. 2010). Maize with the few/long lateral roots (Zhan et al. 2013, Trachsel et al. 2013), the ‘steep’ root (Trachsel et al. 2013) and less crown roots (Saengwilai et al. 2014) had more root distribution in deep soil and subsequently greater N and water acquisition ability compared with the “shallow” ones with more/short lateral roots and more crown root (Gao and Lynch 2016). Maize genotypes with densely spaced and short lateral roots are optimal for phosphorus acquisition (Postma et al. 2014, Jia et al. 2018). The shallower root angle of axial roots, i.e. larger angles between primary root from the seedlings and the seminal and crown roots for primary roots, acquired more phosphorus from topsoil in maize, bean (Phaseolus vulgaris), and soybean (Glycine max) (Lynch et al. 2011, Miguel et al. 2015). In addition, several root architectural traits may be useful in balancing the needs for topsoil and subsoil foraging. Lateral root branching density can be optimized to balance the needs for intensive soil foraging for P and more extensive, deeper soil foraging for mobile resources such as nitrate (Postma et al. 2014).
Due to the opaque, heterogeneous nature of the soil and the dynamic nature of the plant–soil relationship, understanding the relationship between root system architecture and resource capture is complicated (Burridge et al. 2020). Advances in imaging software such as magnetic resonance imaging (MRI), computed tomography (CT), and positron emission tomography (PET), which implement a non-invasive measurement procedure that allows capturing times series of 3D root architecture traits (Schulz et al. 2013, Metzner 2015, Clark et al. 2012), have expanded the throughput of root phenotyping platforms, but are expensive, low-throughput, and ill-suited to field-grown plants (Burridge et al. 2020). In general, information about root system architecture in the field and information about the genetic control of root system architecture remains scarce (Trachsel et al. 2011). Recently, Trachsel et al. (2011) proposed an easily handled, efficient and cheap tool for phenotyping mature roots in a natural environment under field conditions, that are complicated and involved in multiple environmental stress, such as high/low temperature, drought and salinity stress, affecting plant growth and development, including root development (Rehman et al. 2023, Saeed et al. 2023). “Shovelomics” can identify several important phenes that affect root distribution, including root number, root branch density, root growth angle, etc. in multiple crops (Trachsel et al. 2011, Burridge et al. 2016). This may inform on their values in breeding for real-world conditions. Water and nutrient management depends on root phenotype (integration of phenes, York et al. 2013) of crop species and genotypes and may be fine-tuned by our root understanding via “shovelomics”.
Root phenes or traits, describing root system architecture, have got more and more attentions, because it is necessary and urgent to obtain more crop yield output with less fertilizers and water input in sustainable and green agriculture (Lynch 2018, 2019). Peanut is an important legume grain and oil crop. China is the largest peanut producer in the world, with 4.64 Mha planting area and 17.39 metric ton production in 2018, which accounted for about 40% of the total annual global yield (http://www.fao.org/statistics/en/). However, the nutrient and water management status of peanut is unparalleled to its rapid growth, and there were few reports of peanut's nutrient and water management according to peanut root structure. Nodules are an important part of peanut root as they supply nitrogen and they should not be neglected in studying legume root phenes. Until now, there have been few reports on the genetic variation and stability through different environments of peanut root architecture. In this study, 89 peanut varieties were used to study the root architecture of different peanut genotypes at the harvesting stage in the field by shovelomics method and at the seedling stage in the laboratory experiment by paper pouching. In addition, the consistency of root architecture between years in the field and between the field experiments and laboratory experiments was investigated. This study provides a theoretical basis for optimizing water and nutrient management measures based on peanut root architecture during peanut cultivation.
2 MATERIALS AND METHODS
2.1 Experimental design
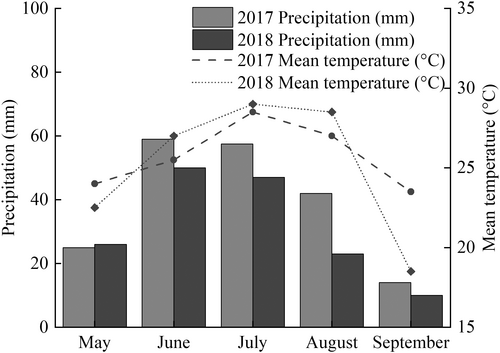
Field: This study was performed in 2017 and 2018 at the Yanjin Experimental Station, Xinxiang, Henan Province, China. The test field is sandy soil, pH 8.5, containing 0.60% organic matter, available nitrogen 18.6 mg kg−1, available phosphorus 16.2 mg kg−1, available potassium 158.5 mg kg−1. The seeds of 89 peanut varieties were provided by Xinxiang Academy of Agricultural Sciences, Henan Province (Table S1). Peanuts were planted in a randomized complete block design with three biological replications at a distance of 0.4 m between rows and 0.17 m between plants to reach a total density of about 166,000 plants ha−1 on May 10, 2017 and May 21, 2018. Each plot had an area of 10 m2 and a length of 5 m. Based on soil analysis at the beginning of the cropping season, nitrogen fertilizer (urea), phosphorus fertilizer (triple superphosphate) and potassium fertilizer (potassium chloride) were applied at rates of 25.0, 20.0 and 30.0 kg ha−1 at pre-sowing, respectively. Pest control and irrigation were carried out as needed. The weather data during the experiment (April–September) at the experimental site in 2017 and 2018 are shown in Figure 1.
Laboratory: The 89 peanut varieties were also tested in the laboratory experiment. Seeds of the same size were selected and surface-sterilized for 5 min with 10% (v/v) H2O2, then washed with water for 3–4 times, and soaked in distilled water for 12 hours. Each 8 soaked seeds were placed in the middle of the double-layer absorbent paper at a distance of 3–4 cm from the top; the distance between peanut seeds was about 2 cm. Finally, the double-layer absorbent paper was wrapped around the PVC tube and fixed with a rubber band. The rolls were placed upright in 4.5-L plastic bucket containing 2 L of 0.5 mM CaSO4. The seeds were allowed to germinate in darkness at 28°C for 3–4 days. The seedlings were then placed in a plant culture room at 28°C for 4 days with 12 h of light (120 μmol m−2 s−1). The dry weight and root phenes were dertemined on 7-day-old seedlings. During the cultivation process, carbendazim was used for sterilization when bacteria were growing.
2.2 Sampling method and preservation
Field: On September 10, 2017 and September 25, 2018, three plants were selected and excavated for shovelomics (Burridge et al. 2016). The excavation volume was defined by a cylinder with a radius of 15 cm around the shoot and a depth of 25 cm. The cylinder was taken out and roots were gently washed with water, and then the shoots were separated from the roots. Shoots were dried and weighted, while roots were soaked in 30% alcohol to determine root phenes state and dry weight.
Laboratory: After 7 days of greenhouse culture, the absorbent paper was unfolded, and 4 plants with the same growth were selected from each roll. The aboveground part and the root system were separated and labeled respectively for the determination of dry weight and root phenes state.
2.3 Evaluation of root phenes state
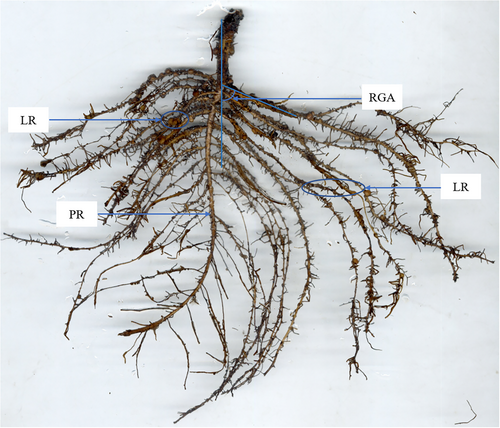
Table S2 lists all measured root phenes and their abbreviations. The primary root length (PRL), the length of lateral root zone (LLRZ) and the first lateral root growth angle (LRGA) were visually evaluated on a linear scale. Counts were taken for the number of primary lateral root (LRN) and the nodules number (NN). The lateral root density (LRD) was obtained by calculating the ratio of LRN to LLRZ.
Root samples were then scanned in greyscale at 600 dpi using a desktop scanner (EPSON Perfection V700 Photo) to record the phenotypic data on total root length (TRL, cm), total root surface area (RSA, cm2), average root diameter (ARD, mm) and root volume (RV, cm3). The greyscale images obtained in tiff format were analyzed using WinRHIZO Pro software (Regent Instruments Inc.). The lateral root length (LRL) was obtained by calculating the difference between the TRL and the PRL. In this study, three biological replicates were analyzed per peanut varieties.
2.4 Measurement of dry weight of shoot and root
The dry weights shoots and roota (after root image acquisition) of each plant were obtained after oven-drying at 80°C for 24 h or until constant weight.
2.5 Statistical analysis
Data from laboratory and field experiments in 2017 and 2018 were analyzed using SPSS 19.0 statistical software (SPSS Inc.). Means were tested by the Tukey test using a 0.05 level of significance. The boxplot method was used to analyze the differences in plant growth and root structure characteristics in the field (2017–2018) and in the laboratory. Genotype and year were considered fixed effects for field experiments. Pearson correlation analysis was performed to determine the relationship among phene descriptors, and to compare laboratory versus field results. The two-way average quadrant diagram was drawn based on the LRD and LRGA through RStudio V 1.2 software. The tested varieties were divided into four types: Class I、Class II、Class III and Class IV, which represented shallow root angle and large lateral root density, shallow root angle and small lateral root density, deep root angle and small lateral root density, deep root angle and large lateral root density, respectively.
3 RESULTS
3.1 The root architecture index of different peanut varieties in the field
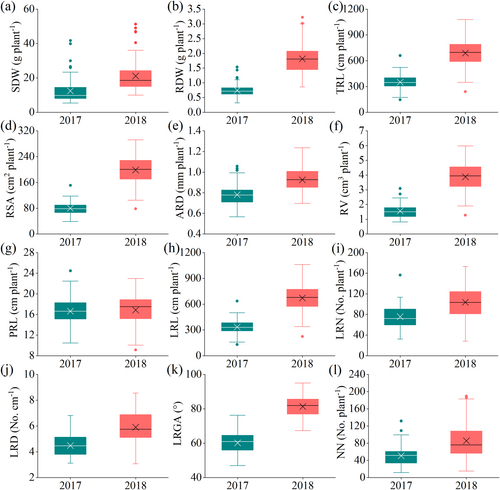
We observed large phenotypic variation for most shoot and root descriptors (Figure 2) evaluated in the field in 2017 and 2018 (Figure 3, Tables S3 and S4). On the whole, the values of shoot dry weight (SDW), root dry weight (RDW) and various root morphological indexes (including TRL, RSA, RD, RV, MRL, LRN, LRD, RA and NN) in 2017 were all less than those in 2018. ANOVA of the two peanut seasons revealed significant variation associated with genotype and year with generally normal distributions (Table 1). Significant differences among genotypes and between the two years were observed for SDW, RDW, TRL, RSA, ARD, RV, LRL, LRN, LRD, RA and NN. These traits were also significantly affected by the interactions of genotype and year, except for the LRL.
| Source of variation | SDW (g plant −1) | RDW (g plant −1) | TRL (cm) | RSA (cm2) | ARD (mm) | RV (cm3) | PRL (cm) | LRL (cm) | LRN (No.) | LRD (No. cm −1) | LRGA (°) | NN (No. plant −1) |
|---|---|---|---|---|---|---|---|---|---|---|---|---|
| Year | ** | *** | *** | *** | *** | *** | ns | *** | *** | *** | *** | *** |
| Geno | *** | *** | *** | *** | *** | *** | *** | *** | *** | *** | *** | *** |
| G*Y | *** | *** | ** | *** | ** | *** | ** | ns | *** | *** | ns | *** |
- Level of significance: *** = significant at p < 0.001, ** = significant at p < 0.01, * = significant at p < 0.05, ns = not significant. G = genotype and Y = year.
- Note: dry weights of shoots (SDW) and roots (RDW), and root phenes include total root length (TRL), root surface area (RSA), average root diameter (ARD), root volume (RV), primary root length (PRL), primary lateral root length (LRL), primary lateral root number (LRN), primary lateral root density (LRD), lateral root growth angle (LRGA) and nodule number (NN).
3.2 The root architecture index of different peanut varieties in the laboratory
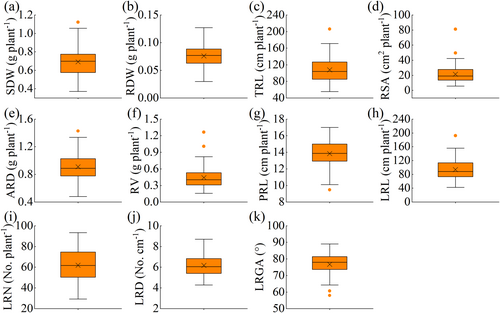
The range of values of SDW, RDW, TRL, RSA, ARD, RV, LRL, LRN, LRD, RA were also determined in the laboratory experiments (Figure 4 and Table S5). As shown in Table S6, there were significant differences between the biomass traits including SDW and RDW, and root traits including TRL, RSA, RV, ARD, PRL, LRL, LRN, LRD and RA of the 7-day old seedlings (p < 0.05), which indicates greater variability among the 89 varieties.
3.3 Root phenotypic variability in the field and the laboratory
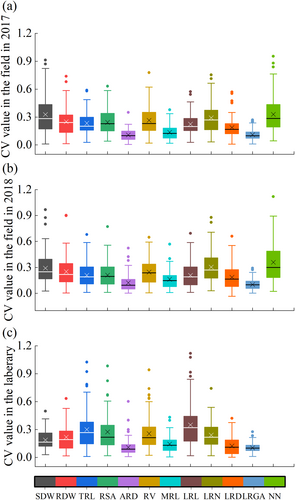
A graphical representation of the range, mean and median indicates which traits may be better suited to differentiate genotypes. As shown in Figure 5, the average coefficient of variation of the root architecture index varied from 11.13% to 32.95% in the field experiment in 2017, from 10.21% to 35.92% in 2018, and from 10.28% to 34.93% in the laboratory experiment. The average coefficient of variations of ARD, PRL, and LRN and RA were always lower than 20% in 2017 and 2018 in both field and laboratory tests.
3.4 Pearson's correlation between root phenotypic indicators in the field and laboratory experiments
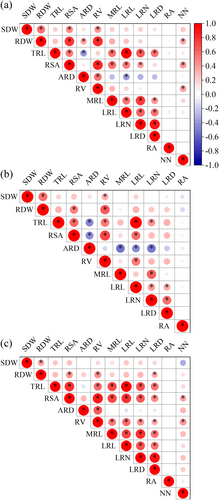
SDW was always positively correlated with RDW, RSA and RV in both field and lab experiments in both 2017 and 2018 (Figure 6). RDW was always positively correlated with RDW, RSA, RV and LRL, and NN in the field. TRL was always positively correlated with RSA, RV, LRL, LRN and LRD. RSA was always positively correlated with RV, LRL, LRN and LRD, and NN in the field. RV was positively correlated with LRL, and NN in the field. PRL was always positively correlated with LRL and LRN. LRL was always positively correlated with LRN and LRD. LRN was always positively correlated with LRD. LRN and LRD were positively correlated with LRL.
3.5 Pearson's correlation between root phenotypic indicators of different peanut genotypes in the laboratory and in the field
As shown in Table S7, trait values obtained in 2017 were reproducible in 2018 as indicated by moderate (LRD: 0.75, LRN: 0.71, RA: 0.64, LRL: 0.60, TRL: 0.34, and SDW: 0.32, ARD: 0.28, P < 0.01) or weak (RSA: 0.25, and RDW: 0.24, P < 0.05) correlations among trait values between 2017 and 2018 in the field. In addition, the LRL, LRN, LRD and RA values determined in the laboratory were highly correlated with those in the field in 2017 and 2018 (p < 0.01).
3.6 Response relationship between RA and LRD of different peanut varieties in the field and laboratory
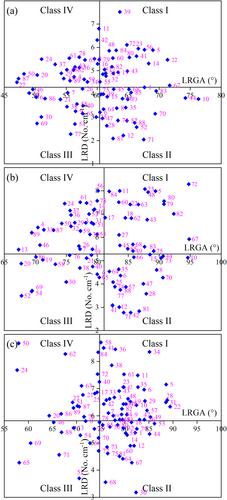
Four quadrants were divided by RA and LRD of different peanut varieties (Class I, Class II, Class III, Class IV), representing shallow RA and large LRD, shallow RA and small LRD, deep RA and small LRD, deep RA and large LRD, respectively (Figure 7). There were 24, 25, 18 and 22 peanut varieties belonging to Class I, Class II, Class III and Class IV, respectively, in the field experiments in 2017 (Figure 7a). There were 18, 26, 20 and 25 peanut varieties belonging to Class I, Class II, Class III and Class IV, respectively, in the field experiments in 2018 (Figure 7b) and 23, 26, 22 and 18 peanut varieties belonging to Class I, Class II, Class III and Class IV, respectively, in the laboratory experiments (Figure 7c). In addition, by comparing the two years' field experiments, there were 14, 21, 11 and 16 varieties always belonging to Class I, Class II, Class III, and Class IV, respectively, and the ratio of the number of these varieties to the total number of varieties was 69.67%. By comparing the laboratory experiment and the field experiments in 2017, there were 10, 11, 10 and 9 varieties always belonging to Class I, Class II, Class III, and Class IV, respectively, and the ratio of the number of these varieties to the total number of varieties was 44.94. Last, by comparing the laboratory experiment and the field experiments in 2018, there were 7, 9, 10, and 7 varieties always belonging to Class I, Class II, Class III, and Class IV, respectively, and the ratio of the number of these varieties to the total number of varieties was 37.07%.
4 DISCUSSION
4.1 Root characteristics variation among different peanut varieties and stability through different environments
Because roots grow underground, they are the first organ to sense external environmental condition and adjust their genetic program of postembryonic development to survive (Lynch, 1995). Therefore, the modulation of root system architecture is affected when the external environmental conditions such as soil moisture, nutrients, temperature, pH, and microbial communities is sensed and integrated into the intrinsic root development program (Bao et al. 2014). The degree of root plasticity depends on changes in the number, extension, position, and growth direction of individual root phene or trait of root system (Khan et al. 2016). Root shovelomics was widely investigated to unravel the components of the root system in soybean, cowpea (Burridge et al. 2016) and maize (Trachsel et al. 2011), but no report was reported in peanut. In this study, we measured the 89 peanut varieties' root phenes, including NN, by shovelomics and found that most peanut phenes had high CV values, such as TRL, RSA, LRN and LRGA. The higher CV value of peanut root traits suggests an adaptive strategy; that is, plasticity itself is a beneficial trait, allowing phenotypic matching and responding to a given environment, as shown in maize (Zhu et al. 2005) and soybean (Burridge et al. 2016).
Almost all root characteristic parameters of peanut in the field experiment in 2018 were significantly higher than those in the field experiment in 2017. This may be because peanut was planted earlier in the field experiment in 2017 and, when harvesting and sampling, the severe senescence resulted in more foliage shedding as well as fine root and nodule decay and disappearance. In addition, the lower precipitation in 2017 (Figure 1) likely reduced the number of observable lateral roots and made the LRGA smaller. Rellán-Álvarez et al. (2015) also found that water deficiency in the upper soil suppresses lateral root growth and root growth angle in Arabidopsis, as their more horizontal growth makes them susceptible to soil drying. Trachsel et al. (2011) found that soil drought can reduce the occurrence of maize's lateral roots. At the same time, we found significant correlations between the SDW, RDW, TRL, LRN, LRD, and NN of different varieties measured in the two years' field experiments, indicating the strong stability of these indicators during the two years of field experiments. As LRD has been proven to be a very stable index and can reflect the development of lateral root (Kellermeier et al. 2014) and LRGA is an important index to reflect the distribution of the root system, we used these two indexes for quadrant graph analysis. Most root architectures of peanut in the two years' field experiment belong to the same root type, which also reflects the stability of root system architecture.
As an invasive measurement, shovleomics is currently a method that allows researchers to easily obtain some root phenes, but when screening substantial crop materials for ideal object root traits, it needs a longer experimental period, become less efficient, and more laborious than the evaluation of phenes in a laboratory. Therefore, we also validated a laboratory-based ‘roll-up’ phenotyping of LRD, which simplifies the evaluation for these important phenes in peanut. We observed fewer LRD in the field compared to the laboratory, which we interpret as root loss due to biotic and abiotic stresses. Correlation analysis showed that the LRD and LRGA measured in the laboratory had a significant positive correlation with those measured in the field for two years. The root architectures of some peanut varieties tested in the laboratory and the two years' field experiment belong to the same root type obtained by quadrant graph analysis of LRD and LRGA. This investigation demonstrates that some plant root traits identified at the early growing stage can indicate their status at the late growing stage, therefore providing a rapid and easy way to screen and select ideal root traits. The ideal root parameters screening in the laboratory also were widely used for other plant species, including maize (Trachsel et al. 2013), wheat (Watt et al. 2013), and soybean (Colombi and Walter 2016).
Correlation analysis showed that there was a significant positive correlation between the SDW and root traits in two years of field experiment and laboratory experiment, which indicates that the growth of the above ground was closely related to the growth of the root system, and the growth of root system would directly affect the growth of the above ground. At the same time, the RDW is positively correlated with TRL, RSA and RV, which shows that root growth is closely related to root characteristic parameters.
Peanuts, like other legumes, can establish a symbiotic relationship with rhizobia that leads to the formation of new organs called nodules, where bacteria reduce atmospheric N into ammonia, used by the host plants (Mondal et al. 2020). As shown in Figure 6, NN were significantly positively related to SDW, RDW, RSA and RV of peanuts in field trials in 2017 and 2018. This indicates peanut nodulation is a process of mutual regulation between root nodules and root systems. It also implies that more nodules fix more N2, producing more N for root and shoot growth (Wang et al. 2019). Although peanuts can fix N2 and produce N, beneficial N uptake root traits like steep lateral roots still can compensate for N absorption and reduce N pollution, especially in conditions of N fertilizer application, which is popular in peanut fields (Gao et al. 2019).
4.2 Potential nutrient absorption characteristics being shown by peanut root's shovelomics
The ideal root system configuration can improve the efficiency of water and nutrient acquisition and utilization (Shu et al. 2007), and promote plant growth and yield formation as well as coordinate root development and defense response (Feng et al. 2022, Li et al. 2021, 2023). Root shovelomics has been used to select varieties with different root structures, and further experiments showed that the nutrient and water use efficiency of these varieties were different (Zhan et al. 2015, Trachse et al. 2013). The absorption efficiency of nutrients and water depends on root distribution being consistent with nutrient and water distribution. For instance, deeper soil roots forage deeper soil water than shallower roots. According to the results of the quadrant graph analysis of LRGA, we found that 45 and 40 peanut varieties in 2017 and 2018 had root structure with deep LRGA (Figure 7). The deep root structure phene will be beneficial only if water and dissolved nutrients mainly exist in the deeper soil layer, i.e. under the condition of extreme drought or high potential of nutrient leaching (soil with high precipitation and low nutrient retention capacity) (Lynch 2013). Lateral roots, the main determinants of ultimate RSA, are influenced strongly by moisture and nutrient distribution in the soil (Postma et al., 2014). Depending on the results of quadrant graph analysis of LRD, the peanut varieties with deep roots are divided into root architectures with large lateral roots and few lateral roots. The root phenotype with deep LRGA and small LRD can not only absorb deep water and nutrients but also has less root's respiratory and metabolic costs, which is more conducive to the growth of shoot (Lynch 2013). In 2017 and 2018, 23 and 18 peanut varieties were classified into root structure types with large LRD and shallow LRGA. This shallow root structure phene is beneficial under fertile conditions, when nutrients are mainly derived from the decomposition of organic matter on the soil surface, or when phosphorus or potassium (mainly present in topsoil) is restricted (Lynch 2013, Lynch and Brown 2001). Research shows that genotypes with both large root hairs and shallow roots had higher phosphorus acquisition efficiency and greater biomass accumulation than short-haired, deep-rooted phenotypes (Miguel et al. 2015). Moreover, 29.21% of peanut varieties were classified into root structure types with small LRD and shallow LRGA in both 2017 and 2018. Peanut varieties with short and few lateral roots and shallow LRGAare more sensitive to water and nutrient deficiency. Therefore, compared with varieties with deeper root growth angles and larger lateral root lengths, more fertilizers and water should be used in their cultivation. Measures such as deep fertilization (Wu et al. 2022, Chen et al. 2024) and exogenous application of plant hormones (Kosakivska et al. 2022) can be taken to promote root elongation and lateral root development to enhance the absorption and utilization of water and nutrient. In summary, this study once again demonstrates that shovelomics is beneficial for effectively screening and selecting plant genotypes with contrasting root traits, and optimizing nutrient and water management based on root types. At the same time, it was verified that some plant root traits identified in the early growth stage can also indicate their status in the later growth stage, thus providing a quick and easy method for screening and selecting ideal root traits.
AUTHOR CONTRIBUTIONS
Z.Z. and B.Z. conceived and designed the experiments. Q.L., Y.L., H.X., X.Z, B.W and L.L. collected and analysed the data. L.L. wrote the manuscript. Q.L. and Y.L helped to interpret the results and prepare the manuscript. X.P, Z.Z. and B.Z. revised the manuscript. All authors read and approved the final manuscript.
ACKNOWLEDGMENTS
This work was supported by the Leading Talent Project in Science and Technology Innovation of Central Plain of China (214200510021); the Key Science and Technology Special Project of Xinxiang City of China (ZD2020004); the Program for Innovative Research Team (in Science and Technology) in University of Henan Province (21IRTSTHN023); and the Key R & D and promotion projects of Henan Province (202102110181, 212102110070).
Open Research
DATA AVAILABILITY STATEMENT
All data generated and analyzed during this study are included in the published article and its supplementary materials.


