Dual transcriptomic and metabolomic analyses provide novel insights into the role of vitamins A and B metabolism in ectomycorrhizal symbiosis between Pinus yunnanensis and Lactarius deliciosus
Abstract
Ectomycorrhizal (EM) fungi play important roles in nutrient cycling and plant community establishment in forest ecosystems. Effects of EM formation on global alterations of the transcriptome and metabolome during plant-fungal interaction and the key metabolites involved in EM development are largely unknown. Here, dual RNA-Seq and untargeted metabolomic analyses were used to reveal stage-specific and core responses of Pinus yunnanensis and Lactarius deliciosus during mycorrhizal colonization. We found that L. deliciosus colonization in P. yunnanensis roots induced different transcriptional changes across three interaction stages, with a small core of genes consistently regulated at all stages. Concentrations of retinol (vitamin A) and retinoic acid increased while that of B group vitamins decreased during EM formation, which was coordinately regulated by these two plant-fungus partners, with L. deliciosus possibly playing a dominant role. Exogenous retinol altered the diameter and mantle thickness of P. yunnanensis - L. deliciosus EM tips and affected host plant growth and phosphorus acquisition. In the absence of L. deliciosus, exogenous retinol increased the root diameter and the number of root tips of P. yunnanensis. Furthermore, the concentration of auxin increased, but that of abscisic acid decreased during EM formation, and the genes involved in plant hormone signal transduction were gradually activated, and auxin and cytokinin signal transduction potentially played a positive role in this EM symbiosis. In conclusion, we propose that the interaction of P. yunnanensis and L. deliciosus alters vitamin metabolism, which may further affect plant hormone biosynthesis and signal transduction, modulating root morphology and EM traits.
1 INTRODUCTION
Forest mushrooms of the genus Lactarius section Deliciosi are ectomycorrhizal (EM) fungi widely distributed in temperate and subtropical forests (Looney et al., 2018), where they are commonly associated with pines (Nuytinck et al., 2007). EM fungi are beneficial to woody plant survival and growth by enhancing plant nutrient acquisition and mediating nutrient transfer through mycorrhizal networks, helping to shape plant communities, as well as forest restoration and management (Martin et al., 2016; Policelli et al., 2020). Additionally, there are about 40 edible Lactarius species belonging to the section Deliciosi worldwide, and China alone hosts over a quarter of these (Wang et al., 2019). In many rural areas, wild L. deliciosus provides an important element of livelihood as a valuable food source and income, which, unfortunately, currently due to deforestation and overharvesting has resulted in a dramatic decline of mushroom yields (Hall et al., 2003; Tomao et al., 2017). However, artificial cultivation of L. deliciosus has made great progress, which is very promising for sustainable use and management of this commercially valuable species (Guerin-Laguette, 2021). The development of L. deliciosus cultivation requires the production of high-quality mycorrhizal seedlings, making it crucial to understand the interactive mechanisms between L. deliciosus and its host plants, which includes identification of key genes and metabolites that can be crucial in regulating the development of the L. deliciosus – plant symbiosis establishment. Additionally, as a host specialist L. deliciosus is strictly associated with pines, and it thus also provides a suitable model to study EM host-specificity (Looney et al., 2018; Tang et al., 2021).
Generally, EM formation has three stages: (1) a pre-symbiotic stage, when signal recognition is initiated between EM fungi and host roots; (2) a physical integration stage, when the fungus proliferates on the root surface and starts growing within the root, and (3) a functional symbiotic stage when stable EM structures are fully established on the epidermal root cells and within a network of inward-growing hyphae that extend into the root, penetrating the intercellular spaces between cortex cells of ectomycorrhizal plants, and the bidirectional nutrient exchange begins between the two symbiotic partners (Plett et al., 2015; Hill et al., 2022). During these stages, the EM fungi invade and cohabit with the roots of their hosts, impacting a number of transcriptional and metabolic pathways in both fungi and host plants. In the pre-symbiotic stage, plants usually first perceive signal molecules, such as small peptides and soluble and/or volatile metabolites that are secreted by the EM fungi (Splivallo et al., 2009; Cope et al., 2019; Wong et al., 2019), followed by down-regulating the expression of genes involved in the plant immune system (Garcia et al., 2015; Wong et al., 2019; Hill et al., 2022) and increasing accumulation of flavonoids, fatty acids, terpenoids and carotenoids, as well as altering hormone levels which stimulate lateral root formation (Wong et al., 2019; Hill et al., 2022). At the physical integration stage, plant immune and stress responses are further triggered (Sebastiana et al., 2009; Plett et al., 2015; Liao et al., 2016; Wang et al., 2022). At the functional symbiotic stage, plant nutrient transporter genes are induced, and nutrient exchange between the two partners takes place (Garcia et al., 2015; Plett et al., 2020; Plett et al., 2021).
Global transcriptome analyses and/or metabolome analyses have usually been applied to understand the transcriptional and metabolic pathways impacted by EM associations (Wong et al., 2019; Hill et al., 2022). Studies have highlighted the important roles of carotenoids and carotenoid-derived metabolites in EM development. For instance, carotenoids can alleviate oxidation damage caused by plant-fungi interactions (Alvarez et al., 2009; Hamilton and Bauerle, 2012). Carotenoid-derived metabolites, such as abscisic acid, strigolactones and blumenin, play crucial roles in the establishment of AM symbioses (Maier et al., 1995; Akiyama et al., 2005; Stauder et al., 2018; Lou et al., 2021), and abscisic acid also in the EM symbioses (Luo et al., 2009; Calvo-Polanco et al., 2019; Hill et al., 2022). Most of these studies have specifically focused on a small number of host plants to reveal core responses in roots when colonized by model mycorrhizal fungi like Laccaria bicolor and Pisolithus microcarpus (Luo et al., 2009; Wong et al., 2019; Hill et al., 2022), while little is known on transcriptional and metabolic responses to EM symbiosis of Pinus, a genus with around 115 species distributed throughout the world; as well as L. deliciosus, a genus with a number of edible EM mushrooms (Pérez-Moreno et al., 2021).
In this study, we first used dual transcriptome and untargeted metabolome analyses across three stages of P. yunnanensis - L. deliciosus EM development to identify core responses or metabolites associated with P. yunnanensis colonization by L. deliciosus. The omics dataset suggested that a carotenoid-derived metabolite, retinol (vitamin A), might be involved in the EM symbiosis between P. yunnanensis and L. deliciosus. Vitamins are required for the culture of many EM fungal mycelia, and some mycorrhizal fungi produce vitamin B, which is supposed to be necessary for EM formation (Strzelczyk et al., 1991; Arenas et al., 2018). Retinal also plays an important role in lateral root initiation (Dickinson et al., 2021; Ke et al., 2022), but whether retinal or retinol is involved in EM development remains largely unknown. Hence, we tested the role of vitamin A in P. yunnanensis - L. deliciosus EM formation by applying exogenous retinol, retinal, and retinoic acid to the EM synthesis systems.
2 MATERIALS AND METHODS
2.1 Pinus yunnanensis-Lactarius deliciosus mycorrhizal synthesis in a Pouch system and sampling
The host plant Pinus yunnanensis Franch. (Kunming) and the Lactarius deliciosus isolate NZ (New Zealand) were used in this study. An in vitro “Pouch” co-culture system (see Supplementary Method S1) was established for P. yunnanensis - L. deliciosus EM formation (Guerin-Laguette et al., 2000; Wang et al., 2019; Tang et al., 2021). One day (EMD1), 12 days (EMD12), and 23 days (EMD23) after inoculation (from the same experimental units), which corresponds to their early signal recognition, initial (a few number of almost transparent enlarged root tips appeared, and no Hartig net was observed at this stage according to Tang et al. 2021) and fast development (a considerable number of mature EM tips appeared and more EM tips were still in formation) stage of EM formation, based on morphological features (Figure S1), root, root tips and hyphae material were sampled. At EMD1, we collected both fungal mycelia and rootlets in the vicinity; at EMD12, since only a few EM tips were formed, both young EM root tips (primordia) and mycelia and rootlets in the vicinity were collected; while at EMD23, only the roots segments with EM tips were collected. Free-living hyphae without roots on the same medium covered with a cellophane membrane were prepared as the EM fungal control (n = 3), while seedlings that were not inoculated with hyphal plugs were treated as the plant control (n = 3). Samples (root-fungal complex of 2–3 inoculated seedlings pooled as one sample) were prepared at the indicated times, flash-frozen in liquid nitrogen, and stored at −80°C until use. For samples at each time point, three samples were selected for transcriptome and qRT-PCR analysis. The same three samples that were used for transcriptome analysis, plus one extra sample for each time point, were selected for non-targeted metabolome analyses. Because it is difficult to distinguish the metabolites from plants and fungi, and the EM formation started at around EMD12, samples of the root-fungal complex at EMD1 were used as control for metabolome analyses. Another four samples from a new independent experimental setup were used for abscisic acid (ABA) and auxin (IAA) measurements.
2.2 RNA extraction, quality control, sequencing, and analysis
Total RNA was extracted using an RNA extraction kit (Tiangen, Cat. No DP441). RNA quantity and quality were assessed by a NanoDrop NC2000 spectrophotometer (ThermoFisher Scientific) and Agilent 2100 Bioanalyzer (Agilent Technologies). RNA samples with RIN (RNA integrity number) > 8.0 were used for RNA-Seq. The cDNA libraries were prepared according to the Illumina's TruSeq® RNA Sample Preparation Guide, and 150-bp paired-end reads were sequenced subsequently using an Illumina HiSeq platform (Personalbio®). The raw data were submitted to the National Center for Biotechnology Information Sequence Read Archive under the BioProject of PRJNA961221. FastQC (Andrews, 2010) was run for quality control, and Cutadapt (Martin, 2011) was used to trim adapters and filter low-quality reads. The numbers of clean reads for each sample are listed in Table S1.
The filtered clean reads from each RNA-Seq library were first aligned with the L. deliciosus genome (L. deliciosus 48) available at the MycoCosm database (https://mycocosm.jgi.doe.gov/mycocosm/home), using HISAT2 (Kim et al., 2019), to pick out fungal reads (with a minimum mapping rate of 88.15% for the L. deliciosus control samples). The rest of the reads in plant-fungal complex samples were treated as P. yunnanensis reads. For these P. yunnanensis reads, two strategies, de novo assembling using Trinity, and alignment with HISAT2 using the genome of P. taeda (Pita.2_01.fa) as a reference, were used and compared. After annotation using multiple databases (e.g. NCBI protein sequences; Gene Ontology; Kyoto Encyclopedia of Genes and Genome; evolutionary genealogy of genes, non-supervised Orthologous Groups; Swiss-Prot and Pfam), only 12.39% (27895) unigenes could be annotated for de novo assembly, but 100% (51751) genes could be annotated for referenced alignment with reads mapping rate of 65% for the P. yunnanensis control samples (Table S1). Therefore, for P. yunnanensis reads, a referenced transcriptome analysis was further used. Gene expressions were calculated and normalized using fragments per kilo bases per million fragments (FPKM), and the distribution, density, and saturation of FPKM, as well as the Pearson correlation matrix among samples, were further examined before further analysis.
2.3 Real-time quantitative reverse transcription PCR analysis
First-strand cDNA was synthesized from about 2.0 μg RNA using a PrimeScript™ 1st stand cDNA Synthesis Kit for real-time quantitative reverse transcription PCR (qPCR). The qPCR reactions (see Method S2) were performed with an MA-6000 real-time system (Yarui) using AceQ® qPCR SYBR® Green Master with transcript-specific primers (Table S2). The expression of endogenous reference genes U2af and GAPDH was respectively used for P. yunnanensis and L. deliciosus to normalize the expression level, and the qPCR data were represented as fold-change compared with the control from relative normalized expression level from three biological replicates and further compared with RNA-Seq results (fold-change of FPKM means).
2.4 Metabolite extraction and ultra-high performance liquid chromatography -quadrupole time-of-flight mass spectrometry (UHPLC-Q-TOF/MS) analysis
Frozen samples of 100 mg (±10%) root-fungal complex were ground into a fine powder with a mortar and pestle under freezing conditions with liquid nitrogen. To each sample was added 1000 μL precooled (−20°C) methanol/acetonitrile/H2O (2:2:1, v/v/v), and then shaken for 15 min at 4°C. Subsequently, the mixture was centrifuged for 15 min (14000 g, 4°C), and the supernatant was recovered, dried in a vacuum centrifuge, and stored at −80°C. The dried samples were re-dissolved in 100 μL acetonitrile/water (1:1, v/v) solvent.
An UHPLC (1290 Infinity LC, Agilent Technologies) coupled to a quadrupole time-of-flight mass spectrometry (AB Sciex Triple TOF 6600) was used for UHPLC-Q-TOF/MS analysis (Method S3). The raw MS data (wiff.scan files) were converted to MzXML files using ProteoWizard MSConvert. CAMERA (Collection of Algorithms of MEtabolite pRofile Annotation) was used for annotation of isotopes and adducts. Compound identification of metabolites was performed by comparing the accuracy of the m/z values (<10 ppm) and MS/MS spectra with an in-house database established with available authentic standards. To monitor the stability and repeatability of instrument analysis, quality control (QC) samples were prepared by pooling 10 μL of each sample and analyzed together with other samples. The QC samples were regularly inserted and analyzed after every five samples.
2.5 Effects of exogenous retinoids on root colonization of Pinus yunnanensis by Lactarius deliciosus
Pinus yunnanensis - L. deliciosus mycorrhization was achieved in two systems: (1) the “Pouch” system as described above; (2) a nursery container (pot, see Method S5) using vegetative inocula (Wang et al., 2019). For exogenous retinoid application, we first dissolved commercial retinol (Aladdin), retinal (J&K Scientific) and retinoic acid (Solarbio) in ethanol, but the retinoic acid precipitated again when diluted in distilled water. Therefore, retinoic acid was dissolved in DMSO (dimethyl sulfoxide). For the Pouch system, retinol and retinoic acid were, respectively, dissolved in ethanol and DMSO, and 1, 10, 20, 50 and 100 μM retinol and retinoic acid were added to the Pouch system to test their effects on mycorrhiza formation, while 0.1% (v/v) ethanol or DMSO were used as the control. Moreover, non-inoculated seedlings were used to see their effects on root morphology. For the pot experiment, based on the results from the Pouch system, 0.3 mg retinol, retinal and retinoic acid diluted in 10 mL distilled water were applied to the rhizosphere of each pot (with one seedling per pot). Free-living mycelia grown on M + P plates with 1 μM retinol, retinal and retinoic acid were used as the fungal control.
Four weeks or three months post-inoculation for the Pouch or pot system, respectively, root EM formation and types including single (mono), double (dichotomic), quadruple and clusters (Guerin-Laguette et al., 2014), as well as the total number of L. deliciosus mycorrhizal tips were examined and photographed under a dissecting microscope (Leica S8AP0). The root morphology, including root length, root surface area, diameter and number of root tips, was then analyzed by WinRHIZO (WinRHIZO Pro2003b, Regent Instruments Inc.) as described by Wang et al. (2015). The percentage of root EM colonization was calculated based on root length (total number of EM tips / total root length) and number of root tips (total number of EM tips / total number of root tips). Finally, 10 EM tips from each seedling were collected and fixed in 4% paraformaldehyde in PBS overnight at 4°C. For the pot system, plant material was harvested and dried to determine biomass and nutrient concentrations (Wang et al., 2021).
2.6 Microscopic analysis of EM root tips
EM tips were dehydrated by a series of ethanol solutions (15, 30, 50, 70, 90, 95, and 100% (v/v)), cleared with Histo-clear II (HS-202, National Diagnostics) and then embedded in pure paraffin wax for sectioning. About 30-μm transverse sections were prepared at around the middle zone of each EM tip (indicated by the red line in Figure S2A) using a microtome (HM340E, Thermo Scientific). All sections were first observed and snapped with a stereomicroscope (Leica M205C), and then a Leica TCS SP8 confocal scanning laser microscope equipped with an HCX PL APO 40x/0.85 objective was used for high-quality images. High-quality sections were stained with 5 μg mL−1 WGA (wheat germ agglutinin) conjugated with FITC (fluorescein isothiocyanate) (L4895, Sigma-Aldrich) to better observe EM structures (Tang et al., 2021).
The diameter and mantle thickness of the EM tips were measured using ImageJ software. EM tip diameters were measured using both a dissecting microscope (quick procedure for measuring large numbers of EM tips, hereafter referred to as DDM: diameter scale photographs from a dissecting microscope) and a stereomicroscope (time-consuming procedure for small numbers of samples after sectioning, hereafter referred as DSM: diameter scale photographs from a stereomicroscope) captured photographs as illustrated by Figure S2. For DSM, the diameter of EM tips was determined from two perpendicular measurements, and the mantle thickness was determined from four separate measurements equidistant from another along the mantle, as explained by Figure S2C.
2.7 Measurements of root ABA and IAA
Roots were first ground to a fine powder with liquid nitrogen, and then 0.10–0.30 g root powder was homogenized and extracted at 4°C for 12 h with 1 mL methanol/distilled water (80:20). After centrifugation (13,400 g, 10 min) and debris removal, the supernatant was vacuum-evaporated to remove methanol. The solid residue was re-suspended in 1 mL distilled water and passed through a preconditioned HLB cartridge. The HLB cartridges were washed with distilled water and methanol, respectively, and the retained phytohormones were eluted with 1 mL 80% (v/v) methanol. Subsequently, the solution was vacuum-evaporated, and the residue was dissolved in distilled water and filtered through a 0.22 μm cellulose acetate filter (Durgbanshi et al., 2005; Hou et al., 2008). Liquid chromatography–electrospray ionization tandem mass spectrometry (LC–ESI-MS/MS, Waters Alliance) was applied (Method S4) to the determination of IAA and ABA simultaneously (Hou et al., 2008).
2.8 Statistical analyses
For RNA-Seq data, differential expression was analyzed by DESeq (Wang et al., 2010) and up−/down-regulation of genes was considered to be significant if |log2FoldChange| > 1 with P < 0.05 (Wang et al., 2018). Normalized gene expression data were used for the principal component analysis (PCA) using the DESeq2 package in R. The top ten genes with the highest eigenvalues (>0) and the lowest eigenvalues (<0) for PC1 were selected and treated as genes that had the largest contribution to this PC. Cluster analysis of gene expression dynamics was performed using the Pheatmap package in R, and the DEGs (differentially expressed genes) were clustered in nine profiles based on their gene expression patterns, with DEGs belonging to the same group having similar patterns of expression. The GO (gene ontology) and KEGG (Kyoto Encyclopedia of Genes and Genomes) enrichment analysis were performed by topGO (Ashburner et al., 2000) and the KEGG mapper tool (http://www.genome.jp/kegg/), respectively. The above statistical analyses were performed on the Genescloud platform (https://www.genescloud.cn/). For metabolome analysis, the processed data were analyzed by SIMCA 14.1 and Origin 2021, where they were subjected to multivariate statistical analysis, including PCA and OPLS-DA (orthogonal partial least-squares discriminant analysis). The VIP (Variable Importance for the Projection) value of each variable in the OPLS-DA model, together with t-test was performed to screen significantly different metabolites (OPLS-DA VIP >1, fold-change >1.5 or <0.67 and P < 0.05), then the different metabolites were qualitatively hierarchical-clustered and submitted to KEGG (http://www.genome.jp/kegg/) and MetaboAnalyst (www.metaboanalyst.ca/) for metabolic pathway analysis. For other data in this study, R software (version 3.2.2) and one-way ANOVA were used to examine significant differences at P < 0.05, followed by post hoc pair-wise Tukey honest significant difference tests for multiple comparisons when applicable.
3 RESULTS
3.1 Pinus yunnanensis - L. deliciosus EM formation modifies global gene expression of both partners
A total of 18,571 genes were expressed (FPKM >1) in the non-inoculated P. yunnanensis roots, and 12,164 genes were expressed (FPKM >1) in the free-living mycelium of L. deliciosus. The transcriptomic data were highly replicable across samples, with Pearson correlation coefficients of r ≥ 0.88 and r ≥ 0.82 for P. yunnanensis and L. deliciosus, respectively. Colonization of P. yunnanensis root systems by L. deliciosus led to 4,748 and 3,122 plant and fungal differentially-expressed genes (DEGs), respectively, across the three integration stages. A total of 13 genes (eight plant and five fungal genes) were further verified using qPCR analysis (Figure S3), and a significant correlation between the gene-expression profiles (Log2 Fold-Change) was detected by RNA-Seq and qPCR (R2 = 0.48, F (1,152) = 106.2, P < 2.2e−16).
3.1.1 Gene-expression patterns of P. yunnanensis during colonization stages
For P. yunnanensis, the lowest number (451) of DEGs was observed at the early signal-recognition stage (EMD1) of EM formation, compared with the non-inoculated control samples (Figure 1A). DEGs at EMD1 were mainly enriched by GO terms of response to stimulus, catalytic activity, extracellular region and antioxidant activity, and KEGG terms of phenylpropanoid biosynthesis and glutathione metabolism. Moreover, GO terms of catalytic activity and antioxidant activity, and KEGG terms of phenylpropanoid biosynthesis, ascorbate and aldarate metabolism, terpenoid backbone biosynthesis, and fatty acid degradation pathways were also enriched at EMD12 and EMD23. At the EM fast-development stage (EMD23), GO terms of nutrient reservoir activity and transporter activity, as well as KEGG terms of fructose and mannose metabolism, nitrogen metabolism and cyanoamino acid metabolism were significantly enriched (Table S3). A total of 210 persistently regulated genes in P. yunnanensis were identified during mycorrhization (Figure 1B). These persistently-regulated genes (Table S4) were mainly enriched into GO terms of response to stimulus, antioxidant activity, catalytic activity, transporter activity, nutrient reservoir activity and defense process (Figure 1C).
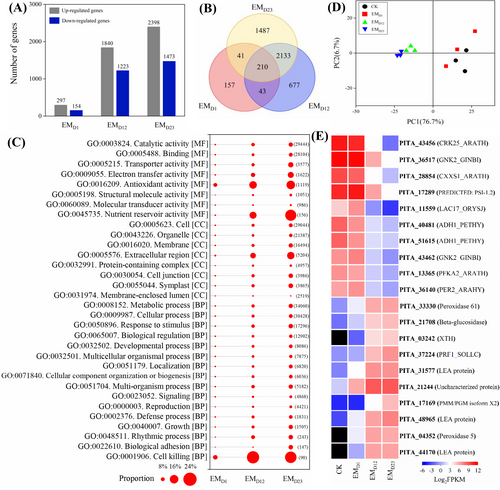
The PCA analysis showed differences between the four groups, while some overlap and high variation within the samples of the same group were observed (Figure 1D). The PCA analysis also indicated a little difference between EMD12 and EMD23, and between Control and EMD1. As PC1 explained 76.7% of the variation, the top 20 up-regulated and down-regulated genes that had the largest contribution to this PC were identified (Table S5). These genes were significantly differentially regulated across the three interaction stages: activated genes mainly including late-embryogenesis abundant protein, peroxidase and glucosidase; and repressed genes included cysteine-rich receptor-like protein kinase, antifungal protein and thioredoxin-like protein (Figure 1E). The DEGs were clustered into nine clusters based on their expression patterns; among these clusters, up-regulated genes at early interaction stage (cluster 1), EM initial (cluster 4) and fast-development stage (cluster 7), respectively, were mainly enriched into KEGG pathways of nitrogen metabolism, terpenoid backbone biosynthesis, pyruvate metabolism, fatty acid degradation, and carotenoid biosynthesis (Figure S4).
Furthermore, 227 transcripts contributing to the enriched GO defense term, annotated as TIR-NBS-LRR gene family, NB-ARC domain containing resistance proteins, and dirigent-like protein family, were extracted and analyzed. There were 90 genes with FPKM >1, and 34 genes were significantly differentially regulated in at least one stage across mycorrhization (Figure S5 and Table S6).
3.1.2 Gene-expression patterns of L. deliciosus during colonization stages
For L. deliciosus, the lowest number of DEGs was also observed at the early signal-recognition stage (Figure 2A). The GO terms of fatty acid biosynthesis, oxidation–reduction process, acetyl-CoA carboxylase activity, thiamine (vitamin B1) pyrophosphate binding, and biotin (vitamin B7) carboxylase activity containing 112 persistently regulated genes were identified during mycorrhization (Figure 2B, C; Table S7). Moreover, genes involved in proteasome, purine metabolism and vitamin B6 metabolism were also enriched at EMD12. The KEGG analysis suggested that organic acid metabolism was generally repressed at EMD12, and peptidase, hydrolase and catalytic activity pathways were generally activated at EMD23 (Table S3).
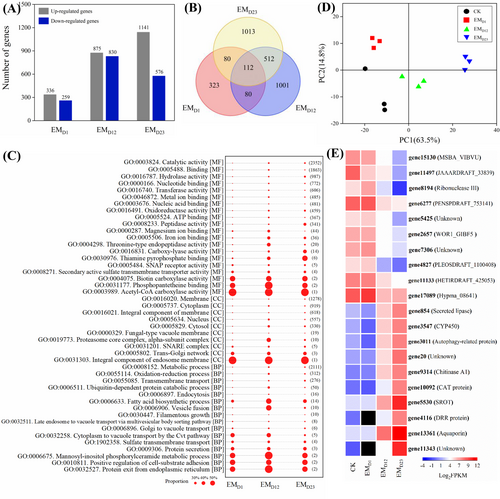
The PCA analysis clearly defined the difference between the four groups and PC1 represented about 63.5% of the variation (Figure 2D). The top 20 up- and down-regulated genes contributed greatly to PC1, including up-regulated genes of aquaporin, DNA repair and recombination protein, RNA methyltransferase, carboxylic acid transporter, chitinase, autophagy-related protein and cytochrome P450 monooxygenase. Down-regulated genes included those encoding lipid export protein, ribonuclease, transcription regulator and some unknown genes (Figure 2E; Table S5). In EMF, the DEGs up-regulated at the three investigated stages (clusters of 2, 6 and 8) were mainly enriched into KEGG of arginine biosynthesis, sugar metabolism, and base-excision repair, while the repressed genes at the initial EM stage (cluster 4) were mainly enriched in KEGG pathways of proteasome, TCA cycle, and aminoacyl-tRNA biosynthesis (Figure S6).
3.2 Metabolic changes during P. yunnanensis - L. deliciosus EM formation
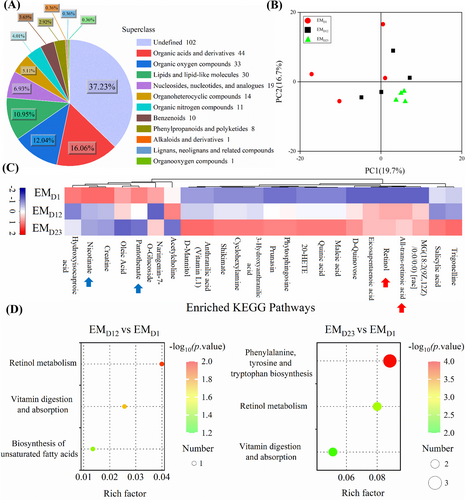
For untargeted metabolome analysis, data reliability analysis on quality control (QC) samples revealed that metabolomic data were highly replicable (Pearson correlation coefficient of r > 0.98) and qualified for further analyses. A total of 274 metabolites (Table S8) were identified, mainly organic acids and derivatives, lipids and lipid-like molecules, organic nitrogen compounds, benzenoids and phenylpropanoids and polyketides (Figure 3A). The PCA analysis defined the difference among groups, while some overlap with high variation was within the samples of the same group, especially for the early interaction stage. The principal component one (PC1) explained 19.7% of the variation, followed by 16.7% for PC2 (Figure 3B). We identified 24 metabolites that were significantly differentially regulated at least at one time-point: increased concentrations of compounds such as trigonelline, salicylic acid, maleic acid, retinol (vitamin A) and retinoic acid; and decreased concentrations of oleic acid, creatine, nicotinate (vitamin B3 derivate), pantothenate (vitamin B5) (Figure 3C; Table S8). Compared with metabolites at the early signal recognition stage, differentially-expressed metabolites at the EM initial and fast development stages were mainly enriched into KEGG pathways of retinol metabolism, vitamin digestion and absorption, and biosynthesis of fatty acids, phenylalanine, tyrosine and tryptophan (Figure 3D, E).
3.3 Genes involved in carotenoid degradation, retinol and vitamin B metabolism were differentially regulated throughout mycorrhization
Both transcriptome and metabolome data suggest that carotenoid metabolism changes significantly over the course of P. yunnanensis - L. deliciosus EM ontogeny. Retinal and its derivatives represent essential compounds in many biological systems; they are usually synthesized through a symmetrical cleavage of β-carotene catalyzed by β-carotene 15, 15′-mono (di) oxygenases; then retinal can be converted to retinol and retinoic acid via reduction or oxidation reactions, respectively (Hu et al., 2022). In plants, abscisic acid (ABA) and strigolactones are also produced from β-carotene; thus, known genes involved in β-carotene degradation were extracted and analyzed in P. yunnanensis and L. deliciosus (Figure 4; Table S9). No gene annotated as β-carotene 15, 15′-mono (di) oxygenase was identified from P. yunnanensis or L. deliciosus. Three genes annotated as retinol dehydrogenase and one gene annotated as all-trans-retinol 13, 14-reductase in P. yunnanensis were up-regulated during mycorrhization, while two genes annotated as retinol dehydrogenase were down-regulated in L. deliciosus. Genes annotated as CCD (carotenoid cleavage dioxygenase) 4, 7 and 8 that are responsible for strigolactone and apocarotenoid biosynthesis in P. yunnanensis were generally not affected by EM formation, except for PITA_50417 (but with FPKM <1), and PITA_34154 and PITA_10351. Some genes involved in plant ABA production were differentially regulated, and the genes annotated as NCED (9-cis-epoxycarotenoid dioxygenase), which are important for ABA biosynthesis, were down-regulated during EM formation (Figure 4B; Table S9).
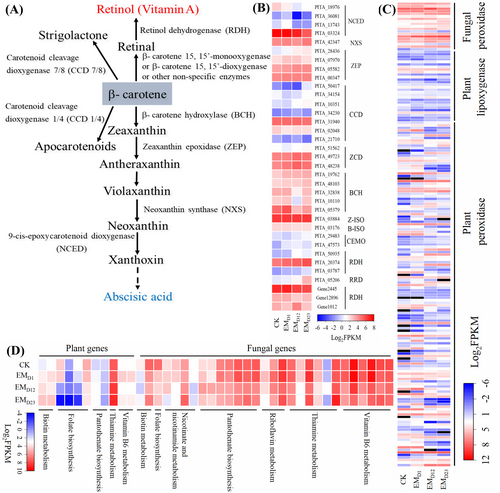
Carotenoid degradation can also be catalyzed by non-specific enzymes, including lipoxygenases and peroxidases, and by non-enzymatic oxidation such as photochemical oxidation, resulting in the production of unspecific apocarotenoid products by random cleavage, and the oxidation of the terminal double bond in apocarotenoid 14 would generate retinal (Ramadoss et al., 1978; Dickinson et al., 2021). Therefore, gene expression of lipoxygenases and peroxidases in P. yunnanensis and L. deliciosus were analyzed, and the results showed that a large set of genes annotated as plant lipoxygenases and peroxidases and almost all the genes annotated as fungal peroxidase were up-regulated at least at one time-point during EM formation (Figure 4C; Table S10).
For B group vitamin, 11 and 29 DEGs from P. yunnanensis and L. deliciosus, respectively, were identified to be enriched in KEGG pathways of biotin metabolism, folate biosynthesis, pantothenate biosynthesis, thiamine metabolism, vitamin B6 metabolism, riboflavin metabolism and nicotinate metabolism. These genes generally showed higher expression level in L. deliciosus than in P. yunnanensis, and most genes contributed to biosynthesis of B group vitamins were down-regulated (Figure 4D). Particularly, all genes involved in vitamin B6 metabolism in L. deliciosus were continually down-regulated during EM formation (Figure 4D; Table S11), including the pyridoxine biosynthesis enzyme PDX, which is crucial for vitamin B6 biosynthesis in Arabidopsis (Chen and Xiong, 2009).
3.4 Exogenous retinol increases diameter but decreases mantle thickness of P. yunnanensis- L. deliciosus EM tips
Exogenous retinol, retinal and retinoic acid were separately applied to the P. yunnanensis - L. deliciosus symbiosis using the Pouch and pot systems to test if such retinoids affect EM formation and development. In both systems, P. yunnanensis - L. deliciosus EMs were successfully produced and confirmed by morphological and molecular methods (Figure 5A-C; Figure S7). The ANOVA analysis suggests that exogenous retinoids mainly (P < 0.0001) affected diameter, mantle thickness, and root P concentration (Table S12).
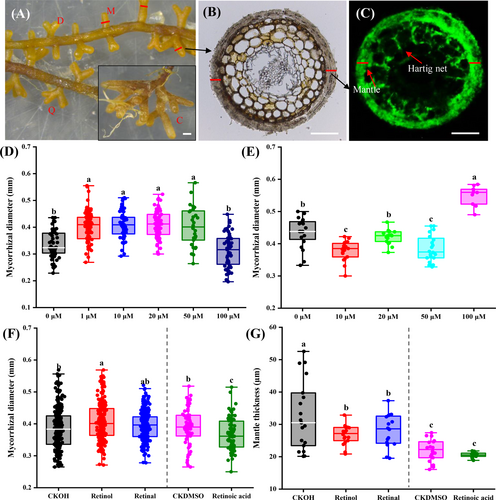
In the Pouch system, low concentrations of retinol (1–50 μM) increased the diameter (DDM) of P. yunnanensis - L. deliciosus EM tips, but retinoic acid showed contrasting patterns (Figure 5D, E). Exogenous retinol and retinoic acid did not affect the numbers of EM tips or EM colonization rates (Tables S13, S14), although 1 μM retinol noticeably increased the number of EMs, especially for clustered EM tips (P > 0.05). In the pot system, exogenous retinol increased diameter (DDM) by 5.3% but decreased mantle thickness by 17.9% of EM tips, retinal decreased mantle thickness (14.0%) and retinoic acid decreased diameter (5.6%) of EM tips (Figure 5F, G). The diameter of EM tips measured from the stereomicroscope photographs (DSM) showed similar trends but without statistical significance (Figure S8). Additionally, retinol increased aboveground biomass (29.6%), root (22.4%) and shoot (14.8%) P concentration of P. yunnanensis (Table 1). Similarly, exogenous retinoids neither significantly affected the numbers of EM tips and EM colonization rates, despite retinol slightly increasing the number of EMs (Figure S9), nor did they influence the growth of non-inoculated host plant (Figure S10) and free-living L. deliciosus mycelium (Figure S11).
| CKOH | Retinol | Retinal | CKDMSO | Retinoic acid | |
|---|---|---|---|---|---|
| Plant height(cm) | 8.6 ± 1.12b | 9.0 ± 1.32ab | 8.6 ± 1.40b | 10.1 ± 1.00a | 9.1 ± 1.34ab |
| Shoot biomass (g) | 0.115 ± 0.031b | 0.149 ± 0.045a | 0.129 ± 0.031ab | 0.152 ± 0.021a | 0.139 ± 0.040ab |
| Root biomass (g) | 0.053 ± 0.022b | 0.063 ± 0.025ab | 0.059 ± 0.024b | 0.080 ± 0.020a | 0.069 ± 0.015ab |
| Shoot C (mg g−1) | 469.12 ± 3.15ab | 470.58 ± 5.69a | 471.76 ± 3.10a | 463.66 ± 5.32b | 474.34 ± 2.63a |
| Shoot N (mg g−1) | 9.63 ± 0.87ab | 10.44 ± 1.02a | 8.73 ± 0.38bc | 7.60 ± 0.91cd | 7.10 ± 1.00d |
| Shoot P (mg g−1) | 3.05 ± 0.34ab | 3.50 ± 0.35a | 2.79 ± 0.21ab | 2.98 ± 0.48ab | 2.67 ± 0.73b |
| Root C (mg g−1) | 451.22 ± 4.32a | 417.20 ± 51.73a | 443.77 ± 5.60a | 440.98 ± 4.82a | 446.99 ± 6.88a |
| Root N (mg g−1) | 9.69 ± 1.34a | 10.07 ± 1.44a | 9.03 ± 1.26a | 6.75 ± 0.57b | 5.93 ± 1.23b |
| Root P (mg g−1) | 3.17 ± 0.51b | 3.88 ± 0.35a | 2.95 ± 0.47b | 2.31 ± 0.30c | 2.65 ± 0.31bc |
3.5 Vitamin metabolism may affect plant hormone biosynthesis and signal transduction
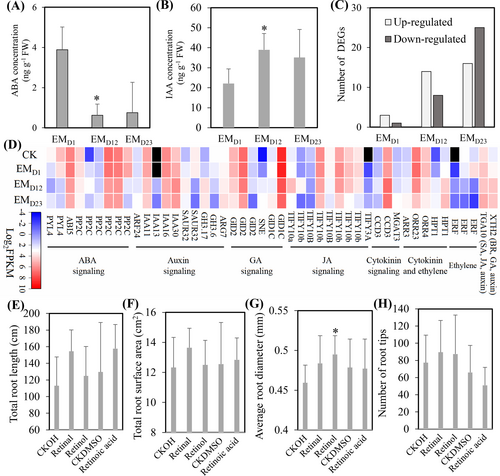
Analysis of ABA and IAA concentrations showed that ABA concentration decreased while the IAA concentration increased in the root-fungal complex at the EM initial and fast-development stages, compared with the early interaction stage (Figure 6A, B). Moreover, the number of DEGs that enriched into KEGG pathway of plant hormone signal transduction was gradually increased during EM symbiosis (Figure 6C). These DEGs involved in various plant hormone biosynthesis and signal transduction, with DEGs involved in IAA and cytokinin signal transduction were generally up-regulated, while those DEGs involved in ABA, gibberellins and ethylene signal transduction were generally down-regulated (Figure 6D, Table. S15). Three genes (gene1245, gene3617 and gene3618) encoding indole-3-acetaldehyde reductase, and one gene (gene4705) potentially encoding indole-3-pyruvate monooxygenase YUCCA3, which might be involved in auxin biosynthesis, were identified in L. deliciosus, with gene3617 was slightly down-regulated but gene3618 was slightly up-regulated during EM formation (Table. S15). Furthermore, in the absence of L. deliciosus, exogenous retinol increased the diameter of root tips significantly, and the number of root tips insignificantly in P. yunnanensis (Figure 6, 7).
4 DISCUSSION
In this study, we identified differentially expressed genes across the three developmental stages of P. yunnanensis - L. deliciosus EM within both roots and L. deliciosus, as well as the global changes of the metabolome of the root-fungal complex. We showed various GO and KEGG pathways at different time points of the P. yunnanensis - L. deliciosus EM formation; we also showed that vitamin metabolism was significantly affected during the EM development, with increased concentrations of vitamin A but decreased concentrations of B group vitamins. Exogenous retinol impacted the development of P. yunnanensis - L. deliciosus EM and thus influenced the growth and P acquisition of host plant P. yunnanensis. Further results showed that plant hormone (especially auxin) biosynthesis and signal transduction might be involved in this process. The implications of these findings and other points of interest are discussed below.
4.1 Pinus yunnanensis - L. deliciosus interaction alters global gene expressions and metabolism of EM roots
According to the PCA results (Figures 1D, 2D), the responses were quicker in fungi than in plant roots, suggesting that the L. deliciosus may sense the presence of its host and trigger the colonization process in a very short time. For host root gene expression of P. yunnanensis during EMF L. deliciosus colonization, our data show that various defense response genes, including TIR-NBS-LRR proteins, NB-ABC domain contain proteins and dirigent-like proteins were differentially regulated, which was similar to results reported in previous studies (Duplessis et al., 2005; Le Quéré et al., 2005; Plett et al., 2015; Liao et al., 2016; Hill et al., 2022). In terms of KEGG metabolic pathways, we found that genes involved in phenylpropanoid biosynthesis and terpenoid backbone biosynthesis were enriched (Table S3), consistent with previous studies (Weiss et al., 1997; Plett et al., 2015; Hill et al., 2022). For gene expression in L. deliciosus during colonization, we identified many more DEGs than Tang et al. (2021), who applied more strict standards (|log2FoldChange| > 2). Other differences between our study and Tang et al. (2021) include different sampling time points (1, 12 and 23 days vs 14, 28 and 42 days post inoculation), L. deliciosus strains (NZ from New Zealand vs 48 from France) and host plants (P. yunnanensis vs P. taeda). However, both studies showed the lowest number of DEGs at the early interaction stage and DEGs involved in core metabolism pathways. Interestingly, genes involved in vitamin B metabolism were significantly regulated during EM formation in this study. These findings suggest that there are not only common responses but also interspecific differences and host-specificity of ectomycorrhizal symbiosis (Plett et al., 2015; Tang et al., 2021).
Previous studies focusing on metabolic changes in response to ectomycorrhizal symbiosis mainly compared the differences between EM and non-EM roots (Szuba et al., 2020; Sebastiana et al., 2021; Xia et al., 2023). Compared with non-inoculated roots, mycorrhization mainly changes primary metabolites including amino acids, organic acids and carbohydrates (Xia et al., 2023), which were also regulated during symbiosis establishment in our dataset (Figure 3). Additionally, metabolism of long-chain fatty acids and vitamin B6 were altered in roots of Quercus suber colonized by Pisolithus tinctorius (Sebastiana et al., 2021), which is similar to our results (Figure 3). While we found contrasting alteration patterns of retinol vitamin A and vitamin B families, which all are important in plant metabolism (Jiang et al., 2021). In this study, the same samples were used for transcriptome and metabolome analyses, but according to the PCA analysis, the variances of the metabolome between samples from the same time points were greater than that in the transcriptome dataset (Figures 1B, 2B and 3B), which probably due to the undefined metabolites were not included in the PCA analysis, and enhanced gene expression does not necessarily result in enhanced enzyme abundance and/or enzyme activities.
4.2 EM formation alters vitamin A and B metabolism
It is widely accepted that vitamin A (retinoids) can be synthesized in animal cells, bacteria and fungi but not in plant cells, whereas the carotenoid precursors are de novo synthesized in plant plastids (Ahrazem et al., 2016; Zhou et al., 2021; Sun et al., 2022). In animal cells, β-carotene is enzymatically cleaved at the central 15, 15′ carbon double bond by β -carotene-15, 15′-oxygenase, yielding two molecules of retinal (von Lintig & Vogt, 2004). Retinal can then be converted into retinol and retinoic acid by retinol and retinal dehydrogenases, respectively. Some bacteria and fungi have similar enzymes (Ahrazem et al., 2016). In plant cells, no known enzymes that can cleave β-carotenoids at C15–C15’ double bounds have been identified (Ahrazem et al., 2016). However, endogenous retinal can be detected in Arabidopsis thaliana roots (Dickinson et al., 2021), and retinal is almost exclusively associated with an opsin to form a light-sensitive rhodopsin-like proteins in vascular plants (Lorenzi et al., 1994). New species-specific CCDs with yet unknown functions and non-specific enzymes such as lipoxygenases and peroxidases, as well as non-enzymatic oxidation like photochemical oxidation, may produce retinal by a random cleavage of carotenoids in plants (Ramadoss et al., 1978; Lorenzi et al., 1994; Ahrazem et al., 2016; Dickinson et al., 2021). We found a large set of genes encoding lipoxygenases and peroxidases that were significantly up-regulated during EM formation (Figure 4). We also found that genes annotated as retinol dehydrogenase were activated in both roots of P. yunnanensis and hyphae of L. deliciosus during colonization which should contribute to the conversion of retinal into retinol (Figure 4).
Carotenoid degradation also produces phytohormones ABA and strigolactones (SLs), which have been extensively investigated (Sun et al., 2022). Both ABA and SLs are involved in AM symbiosis (Akiyama et al., 2005; Herrera-Medina et al., 2007; Ruiz-Lozano et al., 2016). ABA also affects EM symbiosis as some studies showed that ABA concentrations increased and, ABA signalling was activated during EM symbiosis, and exogenous ABA altered EM traits (Luo et al., 2009; Hill et al., 2022). However, there are also other studies that reported contrasting results: ABA concentrations and ABA signalling genes were not affected by EM colonization (Coleman et al., 1990; Calvo-Polanco et al., 2019). Here, we found two genes encoding NCED were activated at the early interaction stage, but afterwards, all identified NCEDs were down-regulated, and ABA concentrations in EM roots decreased during colonization (Figures 4 and 6A). Our data suggest that ABA may play a role at the early stage of P. yunnanensis - L. deliciosus symbiosis, likely a response to a biotic stimulus. The ABA reduction might be partly explained by the consumption of β-carotene via the production of vitamin A.
Genes involved in B group vitamin biosynthesis were generally down-regulated in both plant and fungal partners in this study, which is consistent with the reduction of vitamin B concentrations in our metabolome dataset (Figures 3C and 4D). Great progress has been made to understand the biosynthesis of B group vitamins in plants. It should be noted that there are possible interactions among vitamins in plant metabolism, for instance, vitamin B1 metabolism pathway can provide precursors for provitamin A(carotenoids) (Jiang et al., 2021). For EM fungi, some mycorrhizal fungi produce vitamin B, and vitamin B is required for mycorrhizal fungal cultures and probably EM formation (Strzelczyk et al., 1991; Arenas et al., 2018). In this study, P. yunnanensis and L. deliciosus seem to coordinately modulate vitamin metabolism, but based on the number of DEGs that are involved in vitamin A and B metabolism and the FPKM values, L. deliciosus is likely to play a dominant role.
4.3 Vitamin A and B metabolism may affect EM characters by modulating plant hormone metabolism and signal transduction
The function of retinoids in plant development remains largely unknown, while a study has reported that retinal can promote lateral root organogenesis by regulating the root clock in Arabidopsis thaliana (Dickinson et al., 2021). Given that EMs develop as short lateral roots covered in a thick mantle of fungal hyphae, we applied exogenous retinoids to study their impact on EM formation. We found that retinol increased the diameter but decreased mantle thickness (e.g. on average of 5.9 μm in the pot experiment) of P. yunnanensis - L. deliciosus EM tips, as well as slightly increasing the number of EM tips per plant and eventually promoting plant P acquisition (Table 1; Tables S12, S13; Figure 5; Figure S9). The increased diameter of EM tips can increase the surface area of root tips that interact with the soil texture, hereby promoting nutrient uptake, and the decreased mantle thickness means less carbon allocation from the host plant to the mycorrhizal fungi, thus improving the carbon economy of this symbiosis relationship. Additionally, similar results (i.e., increased number of root tips and average root diameter) were obtained in the absence of L. deliciosus (Figure 6E-H). These data suggest that retinol affects EM characters by regulating root morphology. Our data also showed slight differences between the pouch and pot system, likely due to different growth conditions and significant variation among individuals under the same treatment. Further studies focusing on the metabolism of retinoids within plant roots, the role of retinol and its various derivates in root development and root-EMF interaction, retinoid absorption by roots, and the effects of exogenous retinoids on diversity and function of the rhizosphere microbiome are needed in order to have a deeper insight of this phenomenon.
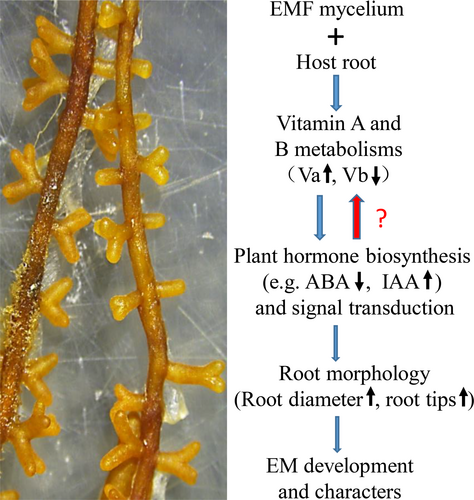
Interestingly, vitamin B metabolism may impact auxin production in various mycorrhizal fungi (Strzelczyk and Pokojska, 1990) and roots of Arabidopsis (Chen and Xiong, 2009), and provitamin A (carotenoids) accumulation increases ABA concentrations in storage roots of cassava (Beyene et al., 2018). These studies suggest that vitamin metabolism may correlate with plant hormone biosynthesis during plant-fungus interaction. Indeed, we found decreased vitamin B but increased auxin and increased vitamin A but decreased ABA during L. deliciosus colonization of P. yunnanensis (Figures 3C and 6B, C). Furthermore, Laccaria bicolor produces a high concentration of IAA to modify root growth during the EM formation (Vayssières F., 2015), and ABA is involved in EM symbiosis (Hill et al., 2022). In our transcriptome dataset, the KEGG pathway of plant hormone signal transduction was gradually activated, and almost all the types of plant hormone likely to be modulated with auxin and cytokinin play a positive role on EM symbiosis. We also found that exogenous retinol increased the average root diameter and number of root tips but did not affect the growth of L. deliciosus (Figure 6E-H and Figure S11). Taken together, plant-fungus interaction regulates vitamin metabolism, which further modulates plant hormone biosynthesis and signal transduction, eventually controlling EM development. However, the relationships between vitamin metabolisms and plant hormone biosynthesis, as well as the molecular mechanisms underlying these relationships, remain largely unexplored. Future studies in this direction are urgently needed.
5 CONCLUSION
The colonization of P. yunnanensis by L. deliciosus significantly altered transcriptomic and metabolomic profiles of both symbiotic partners, and vitamin A and B may play a pivotal role in P. yunnanensis - L. deliciosus EM development by modulating plant hormone biosynthesis (Figure 7). This study provides evidence to show the potential roles of vitamin A and B in ectomycorrhizal symbiosis, and further insights into the mechanisms underlying vitamin A- and B-regulated EM symbiosis are of importance in the production of high-quality ectomycorrhizal plants, which would benefit the cultivation of highly-valued edible EM mushrooms, e.g., Lactarius deliciosus. The results may inspire follow-up investigations in other symbiotic environments and call for studies on the relationships between vitamin metabolism and hormone metabolism in EM symbiotic relationships.
AUTHOR CONTRIBUTIONS
YW and FY planned and designed the research. KS, JY, YW, XZ, LH, SW and RW performed experiments. YW, KS, JY and JZ analyzed data and plotted the figures. YW wrote the first version of the manuscript. XH and HL provided valuable comments and edits during manuscript writings and revisions. All authors contributed to the manuscript revision and approved publication. KS and JY contributed equally.
ACKNOWLEDGEMENT
We thank Fei Li and Wei Chang for technical supports.
FUNDING INFORMATION
This work was funded by the National Natural Science Foundation of China (31901204), the Yunnan High Level Talent Introduction Plan (YNQR-QNRC-2019-057), and the Kunming Institute of Botany (Y9627111K1) to YW.
CONFLICT OF INTEREST STATEMENT
The authors declare that they have no conflict of interest.
Open Research
DATA AVAILABILITY STATEMENT
The RNA-seq data that support the findings of this study are available and have been deposited in the National Center for Biotechnology Information Sequence Reads Archive (SRA) with accession number PRJNA961221. Other data are available in the supplementary material of this article, or from the corresponding author upon reasonable request.


