Exploring the role of FBXL gene family in Soybean: Implications for plant height and seed size regulation
Abstract
F-box proteins constitute a significant family in eukaryotes and, as a component of the Skp1p-cullin-F-box complex, are considered critical for cellular protein degradation and other biological processes in plants. Despite their importance, the functions of F-box proteins, particularly those with C-terminal leucine-rich repeat (LRR) domains, remain largely unknown in plants. Therefore, the present study conducted genome-wide identification and in silico characterization of F-BOX proteins with C-terminal LRR domains in soybean (Glycine max L.) (GmFBXLs). A total of 45 GmFBXLs were identified. The phylogenetic analysis showed that GmFBXLs could be subdivided into ten subgroups and exhibited a close relationship with those from Arabidopsis thaliana, Cicer aretineum, and Medicago trunculata. It was observed that most cis-regulatory elements in the promoter regions of GmFBXLs are involved in hormone signalling, stress responses, and developmental stages. In silico transcriptome data illustrated diverse expression patterns of the identified GmFBXLs across various tissues, such as shoot apical meristem, flower, green pods, leaves, nodules, and roots. Overexpressing (OE) GmFBXL12 in Tianlong No.1 cultivar resulted in a significant difference in seed size, number of pods, and number of seeds per plant, indicated a potential increase in yield compared to wild type. This study offers valuable perspectives into the role of FBXLs in soybean, serving as a foundation for future research. Additionally, the identified OE lines represent valuable genetic resources for enhancing seed-related traits in soybean.
1 INTRODUCTION
Protein degradation stands as the predominant mechanism for regulating diverse cellular processes in all living organisms, including plants. This mechanism governs metabolic control, hormone signalling, circadian rhythms, photo-morphological development, embryogenesis, flower development (Maurya et al. 2020; Qin et al. 2020; Huang et al. 2021; Liu et al. 2021), various signal transduction stressor responses (Chen et al. 2020b; Lin et al. 2021; Melo et al. 2021) and seed size of plants (Zhao et al. 2016; Li et al. 2019; Hu et al. 2021). The ubiquitin-proteasome pathway is a fundamental mechanism within cells that governs the degradation of proteins. The entire ubiquitination pathway is primarily dependent on the chronological actions of three distinct proteins named E1s (ubiquitin-activating enzymes), E2s (ubiquitin-conjugating enzymes), and E3s (ubiquitin-protein ligases) (Sadanandom et al. 2012; Morreale & Walden 2016; Shu & Yang 2017; Zheng & Shabek 2017; Xia et al. 2020; Ban & Estelle 2021). Among these, E3s are the most assorted group, which usually offers a wide range of substrate selection (Sadanandom et al. 2012). The SKP1-Cullin-F-box (SCF) complex is one of the well-characterized and prominent types of E3s made up of suppressor of Arabidopsis SKP1-like (ASK)/KINETOCHORE PROTEIN 1 (SKP1), CELL DIVISION CONTROL PROTEIN 53 (CDC53)/CULLIN1 (CUL1), the REGULATOR OF CULLIN1 (ROC1)/RING-BOX 1 (RBX1) and an F-box protein (Vierstra 2009; Chen & Hellmann 2013). A scaffold is formed from the first three subunits, which consequently assemble a distinct group of F-box proteins. The F-box proteins are substrate-recruiting components of the E3 ubiquitin ligase complexes, which specify the substrates that need to be degraded through recognizing and binding certain target proteins (Lechner et al. 2006; Somers & Fujiwara 2009).
F-box proteins, prevalent in eukaryotes, feature a 40–50 amino acid F-box motif at their N-terminal region, crucial for interacting with the Skp1 protein. The C-terminal domain, typically determining substrate-specific recognition, spans the basis for classifying F-box proteins. Previous studies have categorized the extensive F-box family into subfamilies based on this domain. Generally, these subfamilies include FBXL (leucine-rich repeats), FBXW (WD40 repeats), and FBXO (other secondary structures or unknown domains) (Gagne et al. 2002; Yumimoto et al. 2020). This classification aids in studying the diverse functions of F-box proteins. Leucine-rich repeat proteins normally contain repeats made of 20–29 residues, such that they form an unbroken parallel β-sheet, which usually makes solenoid and helically twisted structures and plays a significant part in protein–protein and protein-ligand interactions as well as in different plant immune responses (Kobe & Kajava 2001). The evolution process of this domain, selective pressures, and their role in plant and seed development in soybean (Glycine max (L.) Merril) largely remain elusive. In Oryza sativa, Zea mays, and Arabidopsis, numbers of those LRR-containing F-box proteins were reported to be 61, 61, and 160, respectively (Gagne et al. 2002; Jain et al. 2007; Jia et al. 2013). However, information on soybean LRR-containing F-box genes (GmFBXLs) is still quite limited.
The F-box family is considered the largest in the plant kingdom. Various studies have documented varying gene counts across different plant species. For instance, soybean (G. max) contains 359 F-box genes, Oryza sativa has 971, Cicer arietinum contains 285, Zea mays possesses 359,Vitis vinifera showcases 156, Gossypium hirsutum contains 599, Malus domestica has 517, Medicago truncatula features 972, Populus trichocarpa has 425, and Arabidopsis thaliana encompasses 897 F-box genes (Gagne et al. 2002; Kuroda et al. 2002; Jain et al. 2007; Yang et al. 2008; Hua et al. 2011; Jia et al. 2013; Cui et al. 2015; Gupta et al. 2015; Jia et al. 2017; Zhang et al. 2019). In other kingdoms, the F-box genes are also abundant, with 20, 33 and 69 genes in the Saccharomyces, Drosophila, and human genome, respectively (Ou et al. 2003; Skaar et al. 2009). Given their vast presence in plants, it is not surprising that F-box proteins play extensive regulatory roles in numerous physiological processes (Liu et al. 2020; Venkatesh et al. 2020), such as root hair growth (Carbonnel et al. 2020), leaf senescence regulation (Gong & Huo 2015; Zhang et al. 2016), flower and fruit development, biotic and abiotic stressors, and phytohormones signalling (Stefanowicz et al. 2016; Ding & Ding 2020; Gong et al. 2020). However, no systematic classification of this crucial subfamily (GmFBXLs) has been conducted to date, leaving their biological significance in soybean not fully understood. To address this, we searched the entire genome of soybean using the Hidden Markov Model (HMM), which resulted in the identification of 45 F-Box genes. These genes were then used to establish phylogenetic relationships among A. thaliana, M. truncatula, and C. arietinum FBXLs. In this study, we also explored the role of GmFBXLs by overexpressing GmFBXL12 (Glyma.06 g068400) in soybean and conducted a comprehensive expression analysis of GmFBXL12 at various stages of seed development. This research not only provides evolutionary insights, but also lays the groundwork for future functional characterization and validation of other members of the F-box gene family in soybean. Furthermore, result from this study offers insights into the role of GmFBXL12 in modulating soybean seed and plant architecture. This work, therefore, represents a significant contribution to our understanding of the FBXL genes in soybean.
2 MATERIALS AND METHODS
2.1 Data Resources for Sequence Retrieval
The investigation of soybean open reading frame (ORF) translations and the identification of the GmFBXL domain signature PF13516 were conducted using the HMM approach (HMMER Version 3.0) (Finn et al. 2011). Additionally, the GmFBXL domain signature PF13516, sourced from Pfam (Version 33.1), was employed as a reference during the search (http://pfam.xfam.org/, accessed on 19/03/2023) (Finn et al. 2014).
The authenticity of the LRR motifs were assessed using the SMART online tool (with a specified e-value threshold of <0.1) (http://smart.embl-heidelberg.de) to verify and characterize the LRR motifs within the context of the analyzed biological sequences (Letunic et al. 2012). To validate the existence of GmFBXL domains, the sequence of each individual putative gene was examined using two distinct resources: the NCBI Conserved Domain Search (Version 3.18) and Pfam database (http://www.ncbi.nlm.nih.gov/Structure/cdd/wrpsb.cgi: http://pfam.sanger.ac.uk/search, accessed on 19/03/2023) (Marchler-Bauer et al. 2003).
2.2 Analysis of Multiple Sequence Alignments and Gene Duplication
To analyse the phylogenetic relationships within the FBXL gene family across various species, including G. max, A. thaliana, C. aretineum, and M. trunculata, protein sequences were retrieved from Phytozome Version 12.1 (http://phytozome.jgi.doe.gov/pz/portal.html, accessed on 19/03/2023) (Goodstein et al. 2012). The analysis of Multiple sequence alignments for 45 GmFBXLs protein sequences was conducted using Multiple Sequence Comparison by Log-Expectation (Edgar 2004). For the construction of the phylogenetic tree, the MEGA7 software was used (Kumar et al. 2016). The phylogeny was generated using the neighbour-joining method (Saitou & Nei 1987) along with Poisson corrections applied to account for multiple substitutions, and 1,000 replications were chosen for the bootstrap analysis. In addition, gene duplication analysis was performed, including synonymous to non-synonymous mutation rates and the computation of the divergence rate (Khan et al. 2019a; Khan et al. 2019b).
2.3 Conserved Motifs, Gene Structure, and Physiochemical Properties of GmFBXLs
The prediction of conserved motif prediction in GmFBXLs proteins was carried out using the online MEME Suite (Version 5.1.1) (http://meme.ebi.edu.au/meme/intro.html, accessed on 19/03/2023). The zero or one occurrence per sequence site distribution and model was used for this analysis. To customize the parameters for MEME Suite, the maximum motif number was set to 10. Additionally, the motif width was constrained to a range of 100 and 150, while the remaining parameters were kept consistent with the default setting (Bailey et al. 2015). The structural details of GmFBXLs genes, including exons and introns were downloaded in Generic File Format (GFF3) from Phytozome (http://www.phytozome.org, accessed on 19/03/2023). TBtools was then utilized to visualize and analyse the gene structure, presenting a clear and informative representation of the exon-intron arrangement and genomic locations (Goodstein et al. 2012; Chen et al. 2020a). Further, the ExPASY PROTPARAM tool (http://web.expasy.org/protparam/, accessed on 19/03/2023) was used to estimate physicochemical properties of individual proteins, including isoelectronic points (pI), molecular weight (Mw), GRAVY values and aliphatic index for each gene (Gasteiger et al. 2005). For the prediction of subcellular localization, WoLF PSORT (https://wolfpsort.hgc.jp/, accessed on 19/03/2023) was employed (Horton et al. 2007).
2.4 Cis-acting Regulatory Elements Prediction in the Promoter Regions and Chromosomal Locations of GmFBXLs
The potential cis-acting regulatory elements (CAREs) were retrieved by examining the 2,000 bp upstream region of the start codon in the identified GmFBXLs using Plant CARE database (http://bioinformatics.psb.ugent.be/webtools/plantcare/html/, accessed on 20/03/2023) (Lescot et al. 2002). The output of CARE analysis was visualized by categorizing them into light, phytohormone and other-related CAREs with the help of Gene Structure Display Server (http://gsds.gao-lab.org/, accessed on 15/06/2023) (Lescot et al. 2002). Further, the exploration into collinearity and gene duplication employed soybean genomic sequences, protein sequences, and GFF3 data. This analysis was executed with the help of TBtools (Chen et al. 2020a).
2.5 Expression Pattern of Different Tissue and Pearson Correlation Coefficient
The expression data for the identified 45 GmFBXLs across multiple tissues were retrieved from the soybean eFP browser (http://bar.utoronto.ca/efpsoybean). Subsequently, RStudio (Version 3.6.2) was used, using the factoMineR and sensitivity packages, to compute the Pearson Correlation Coefficient (PCC) and conduct Principal Component Analysis (PCA) on the fragments per kilobase of transcript per million fragments mapped values at a significance level of 0.05 (α). Additionally, a bidirectional heatmap was generated using ClustVis with the parameters set to maximum algorithm and complete linkage method (Metsalu & Vilo 2015).
2.6 Overexpression Vector Construction and Agrobacterium-mediated Transformation
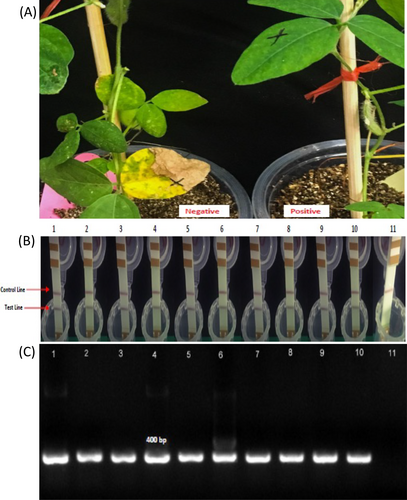
Based on previous quantitative trait loci mapping results of Hina et al. (2020), the GmFBXL12 (Glyma.06G068400) gene was chosen for cloning to experimentally validate its function. The complementary DNA (cDNA) from Williams-82 (W82) cultivar was used as a template for PCR amplification of the coding sequence (CDS) of GmFBXL12, which spans 1917 base pairs (bp). The specific details of the primer used for this amplification are provided in Table S3. The CDS of GmFBXL12 was introduced to pJRH-0641 using cauliflower mosaic virus CaMV 35S promoter (35S: GmFBXL) following procedure outlined by Zhang et al. (2014). Following the sequencing validation, the recombinant pJRH-0641-GmFBXL plasmid vector was transformed into Tianlong No. 1 (G. max L.) using Agrobacterium-mediated transformation, following the methodology outlined by Li et al. (2017). Positive transgenic soybean plants were identified through herbicide (glufosinate) application, presence of BAR gene via PCR and LibertyLink® Strip (bar) test, as recommended by Li et al. (2017).
2.7 RNA Extraction, cDNA Preparation and qRT-PCR
In this study, total RNA was extracted utilizing the RNA prep Pure Plant Kit (TIANGEN). The samples selected for RNA extraction comprised fully developed trifoliate leaves and various stages of seed maturity (R3-R5) at days after flowering (DAF). For DNA quantification, NanoDrop 2000C spectrophotometer was employed (Thermo Fisher Scientific). Furthermore, the expression levels of GmFBXL12 transcripts were assessed. For quantitative RT-PCR, cDNA synthesis was performed using two steps HiScript® II-RT super Mix for qPCR (+gDNA wiper) from Vazyme. During the initial step, 12 μL of RNA +RNase Free ddH2O for each sample underwent treatment with 4 μL of 4 x gDNA wiper mix, at 42 °C for 2 min. Subsequently, 4 μL of 5x Hi script II-RT Super Mix II was combined with the previous 16 μL solution, resulting in a total volume of 20 μL, and synthesized through a PCR program (55 °C for 15 min and 85 °C for 5 s). qPCR was conducted using the ChamQ SYBER qPCR Master Mix (Vazyme) on a T100™ Thermal Cycler manufactured by Bio-Rad. qRT-PCR was conducted to profile expression of GmFBXL12 with GmACTIN11 (Glyma.18 g290800) used as housekeeping gene. Three biological and technical replicates were used for each reaction. The primer pairs used for the qRT-PCR are listed in Table S3. The PCR amplification conditions were configured with an initial denaturation at 95 °C for 3 min, followed by 40 cycles of denaturation at 95 °C for 10 s, and annealing at 60 °C for the 30 s. In this reaction, specificity was validated by melting curve analysis. Moreover, the relative mRNA level for a single gene was determined using the formula ratio = 2(-ΔΔCt) = 2(Ct,t - Ct,r), where Ct represents the cycle threshold, Ct,t is the cycle threshold of the target gene and Ct,r is the cycle threshold of the control gene (Schmittgen & Livak 2008).
2.8 Agro-morphological Indices of Transgenic Plants and Wild Type, and Statistical analyses
Two overexpression lines (OE1 and OE2), along with the wild type (WT), were grown under field conditions until reproductive stage R8. Measurements of plant height (PH, cm), number of seeds per plant (NSP), 100-seed weight (100-SW, g) and number of pods (NPP) following recommended procedures. In addition, seed shape and size were recorded following a previous study (Hina et al. 2020).
Agro-morphological and qPCR data collected from WT and either of OE lines were subjected to t-test in Microsoft Excel (Microsoft Corporation, 2018) at P < 0.05. The means ± standard error (SE) were visualized with the help of GraphPad Prism statistical software (version 8, GraphPad Software, www.graphpad.com).
3 RESULTS
3.1 Identification of GmFBXLs
This study identified a total of 45 GmFBXLs (GmFBXL1 to GmFBXL45) from the soybean genome (Table 1). The CDS of GmFBXLs spanned from 405 bp (GmFBXL22) to 2127 bp (GmFBXL7), resulting in protein lengths of 134 and 708 amino acid residues, respectively. The Mw of putative GmFBXLs vary from 15.27 to 77.46 kDa, while the pI ranged from 4.61 to 9.5 (Table 1). The GmFBXLs exhibit a range of GRAVY values with GmFBXL34 having the lowest value (0.01) and GmFBXL22 the highest (0.63) (Table 1). The majority of the GmFBXLs genes depicted negative GRAVY values, demonstrating a profound dissolving tendency, while a small subset of genes demonstrated a limited affinity for water. Upon investigating the subcellular localization, it was observed that GmFBXLs proteins are present in various cellular organelles, including the cytoplasm, Golgi apparatus, cytoskeleton, extracellular chloroplast, mitochondria and the nuclear region (Table 1).
| Gene Name | Gene Locus | Chromosomal Location: (Start-End) | CDS (Bp)a | Protein (aa)b | Mw (kDa)c | pId | Aliphatic Index | Gravye | Subcellular Predictionf |
|---|---|---|---|---|---|---|---|---|---|
| GmFBXL1 | Glyma.01G036200 | Chr01:3790680-3812091 | 1821 | 606 | 65.11 | 8.29 | 101.19 | −0.04 | chlo: 12, mito: 2 |
| GmFBXL2 | Glyma.01G128200 | Chr01:44038519–44043967 | 2016 | 671 | 73.33 | 7.06 | 113.95 | 0.19 | cyto: 5, nucl: 3, plas: 2, chlo: 1, mito: 1, E.R.: 1, pero: 1 |
| GmFBXL3 | Glyma.01G049300 | Chr01:5740729–5741566 | 642 | 213 | 23.51 | 5.94 | 125.31 | 0.56 | cyto: 9, cysk: 2, nucl: 1, extr: 1, golg: 1 |
| GmFBXL4 | Glyma.02G029800 | Chr02:2729332–2740269 | 1821 | 606 | 65.18 | 8.44 | 101.34 | −0.06 | chlo: 14 |
| GmFBXL5 | Glyma.02G147200 | Chr02:15196606–15199496 | 1602 | 533 | 57.75 | 4.69 | 91.78 | −0.28 | chlo: 12, nucl: 1, mito: 1 |
| GmFBXL6 | Glyma.02G152800 | Chr02:15691678–15694938 | 1758 | 585 | 65.52 | 6.31 | 96.84 | −0.02 | chlo: 8, nucl: 3, cyto: 2, cysk: 1 |
| GmFBXL7 | Glyma.03G042600 | Chr03:5393167–5398284 | 2127 | 708 | 77.46 | 7.6 | 114.48 | 0.17 | chlo: 12, nucl: 2 |
| GmFBXL8 | Glyma.03G234000 | Chr03:43465829–43471527 | 1926 | 641 | 70.54 | 8.06 | 118.75 | 0.31 | E.R.: 4, cyto: 3, chlo: 2, nucl: 2, mito: 1, extr: 1, vacu: 1 |
| GmFBXL9 | Glyma.04G242700 | Chr04:51064744–51067380 | 966 | 321 | 35.02 | 8.17 | 99.07 | 0.15 | cyto: 6, nucl: 4, chlo: 2, vacu: 1.5, E.R._vacu: 1.5 |
| GmFBXL10 | Glyma.04G066900 | Chr04:5591410–5594952 | 1911 | 636 | 67.88 | 7.33 | 103.93 | 0.16 | nucl: 6.5, cyto_nucl: 5, chlo: 4, cyto: 2.5, golg: 1 |
| GmFBXL11 | Glyma.04G147000 | Chr04:28750437–28753859 | 1953 | 650 | 69.72 | 6.21 | 104.98 | 0.18 | nucl: 8.5, cyto_nucl: 6.5, cyto: 3.5, chlo: 2 |
| GmFBXL12 | Glyma.06G068400 | Chr06:5239236–5242914 | 1917 | 638 | 67.93 | 8.1 | 103.9 | 0.16 | nucl: 9.5, cyto_nucl: 6.5, cyto: 2.5, chlo: 2 |
| GmFBXL13 | Glyma.06G095400 | Chr06:7530783–7533737 | 1764 | 587 | 65.98 | 5.73 | 94.36 | −0.01 | nucl: 10, cyto: 3, plas: 1 |
| GmFBXL14 | Glyma.06G120600 | Chr06:9821042–9824933 | 1119 | 372 | 40.63 | 8.27 | 100.67 | 0.13 | cyto: 6, chlo: 5, nucl: 2, vacu: 1 |
| GmFBXL15 | Glyma.07G028300 | Chr07:2268355–2277693 | 1887 | 628 | 68.57 | 6.87 | 105.56 | −0.04 | chlo: 8, nucl: 3, extr: 2, cyto: 1 |
| GmFBXL16 | Glyma.07G254400 | Chr07:43127190–43128641 | 1056 | 351 | 38.88 | 8.47 | 106.7 | 0.06 | nucl: 6, cyto: 4, chlo: 2, plas: 1, cysk: 1 |
| GmFBXL17 | Glyma.07G026200 | Chr07:2051841–2054034 | 1503 | 500 | 56.01 | 5.6 | 118.5 | 0.24 | nucl: 8, cyto: 4, extr: 1, golg: 1 |
| GmFBXL18 | Glyma.07G026100 | Chr07:2047119–2049504 | 1734 | 577 | 63.59 | 5.84 | 109.06 | 0.25 | nucl: 6.5, cyto_nucl: 6.5, cyto: 5.5, chlo: 1, plas: 1 |
| GmFBXL19 | Glyma.08G214500 | Chr08:17333345–17342698 | 1455 | 484 | 53.12 | 5.74 | 102.33 | −0.02 | chlo: 9, nucl: 2, extr: 2, cyto: 1 |
| GmFBXL20 | Glyma.08G216300 | Chr08:17550784–17553042 | 1683 | 560 | 62.77 | 5.8 | 113.79 | 0.19 | nucl: 8, cyto: 3, chlo: 1, extr: 1, golg: 1 |
| GmFBXL21 | Glyma.08G059500 | Chr08:4550613–4556360 | 1740 | 579 | 65.17 | 6.82 | 87.69 | −0.15 | nucl: 9.5, cyto_nucl: 6.5, cyto: 2.5, chlo: 1, cysk: 1 |
| GmFBXL22 | Glyma.09G107600 | Chr09:20356992–20359486 | 405 | 134 | 15.27 | 9.5 | 118.58 | 0.63 | chlo: 7, cyto: 3, nucl: 2, extr: 1, E.R.: 1 |
| GmFBXL23 | Glyma.09G105500 | Chr09:19575092–19580374 | 1137 | 378 | 42.66 | 8.55 | 107.78 | −0.07 | nucl: 8, mito: 2.5, plas: 2.5, cyto_mito: 2, golg_plas: 2 |
| GmFBXL24 | Glyma.10G286600 | Chr10:50621082–50627984 | 1260 | 419 | 45.17 | 6.04 | 101.96 | 0.13 | cyto: 7, nucl: 4, chlo: 1, cysk: 1, golg: 1 |
| GmFBXL25 | Glyma.10G026700 | Chr10:2325893–2328526 | 1605 | 534 | 57.86 | 4.65 | 93.07 | −0.28 | chlo: 13, mito: 1 |
| GmFBXL26 | Glyma.10G250400 | Chr10:47845125–47848173 | 1602 | 533 | 58.04 | 4.68 | 93.02 | −0.34 | chlo: 10, nucl_plas: 2, nucl: 1.5, plas: 1.5, cyto: 1 |
| GmFBXL27 | Glyma.10G021500 | Chr10:1868581–1871561 | 1758 | 585 | 65.63 | 6.21 | 96.15 | −0.06 | chlo: 5, cyto: 4, nucl: 3, cysk: 2 |
| GmFBXL28 | Glyma.11G227300 | Chr11:32211891–32216053 | 1773 | 590 | 66.9 | 6.27 | 100.1 | −0.13 | cyto: 8, nucl: 3, chlo: 1, mito: 1, plas: 1 |
| GmFBXL29 | Glyma.13G036600 | Chr13:11468489–11472883 | 1128 | 375 | 40.96 | 6.79 | 95.47 | 0.10 | nucl: 8, cyto: 4, chlo: 2 |
| GmFBXL30 | Glyma.13G163500 | Chr13:27876748–27886905 | 1737 | 578 | 63.29 | 7.43 | 105.59 | −0.09 | nucl: 7, cyto: 3, chlo: 2, mito: 1, plas: 1 |
| GmFBXL31 | Glyma.14G118200 | Chr14:15781701–15786117 | 1116 | 371 | 40.35 | 7.39 | 102.51 | 0.18 | cyto: 5, chlo: 4, nucl: 4, cysk: 1 |
| GmFBXL32 | Glyma.14G200300 | Chr14:46531678–46537434 | 1959 | 652 | 72 | 8.38 | 109.22 | 0.06 | nucl: 4, cyto: 4, mito: 2, plas: 2, extr: 1, E.R.: 1 |
| GmFBXL33 | Glyma.15G101100 | Chr15:7886334–7892769 | 1176 | 391 | 42.54 | 8 | 106.98 | 0.04 | nucl: 7, cyto: 3, chlo: 1, mito: 1, plas: 1, cysk: 1 |
| GmFBXL34 | Glyma.16G050500 | Chr16:4853237–4856710 | 1719 | 572 | 64.42 | 8.32 | 98.01 | −0.01 | nucl: 6, cyto: 4, chlo: 3, golg: 1 |
| GmFBXL35 | Glyma.16G146400 | Chr16:30725651–30728927 | 1722 | 573 | 64.14 | 8.62 | 97.8 | 0.09 | cyto: 8, chlo: 6 |
| GmFBXL36 | Glyma.17G192600 | Chr17:27762094–27763158 | 819 | 272 | 29.38 | 5.88 | 120.37 | 0.55 | cyto: 7, nucl: 3, extr: 3, golg: 1 |
| GmFBXL37 | Glyma.17G107400 | Chr17:8427796–8437235 | 1744 | 581 | 63.9 | 7.14 | 104.39 | −0.08 | nucl: 6, cyto: 3, chlo: 2, mito: 1, plas: 1, cysk: 1 |
| GmFBXL38 | Glyma.17G019800 | Chr17:1475182–1480986 | 1755 | 584 | 63.52 | 8.33 | 106.35 | 0.14 | nucl: 7, chlo: 3, cyto: 2, plas: 1, cysk: 1 |
| GmFBXL39 | Glyma.17G113900 | Chr17:9011720–9016930 | 1920 | 639 | 68.39 | 6.14 | 108.34 | 0.19 | nucl: 11.5, cyto_nucl: 6.5, chlo: 2 |
| GmFBXL40 | Glyma.17G211000 | Chr17:34811716–34815367 | 1833 | 610 | 65.06 | 7.07 | 102.13 | 0.14 | nucl: 9.5, cyto_nucl: 6, chlo: 2, cyto: 1.5, plas: 1 |
| GmFBXL41 | Glyma.19G231200 | Chr19:48182493–48188258 | 1926 | 641 | 70.75 | 7.7 | 120.42 | 0.32 | E.R.: 4, cyto: 3, chlo: 2, nucl: 1, mito: 1, plas: 1, extr: 1 |
| GmFBXL42 | Glyma.19G206800 | Chr19:46220427–46224265 | 1764 | 587 | 66.24 | 5.71 | 97.99 | −0.02 | nucl: 6, chlo: 5, cyto: 2, cysk: 1 |
| GmFBXL43 | Glyma.19G100200 | Chr19:34719621–34722963 | 1719 | 572 | 64.2 | 8.2 | 97.15 | 0.01 | nucl: 6, cyto: 5, chlo: 3 |
| GmFBXL44 | Glyma.20G102500 | Chr20:34538883–34540903 | 1257 | 418 | 45.01 | 6.4 | 103.61 | 0.12 | cyto: 5, nucl: 4, cysk: 3, chlo: 1, golg: 1 |
| GmFBXL45 | Glyma.20G143300 | Chr20:38191791–38194755 | 1599 | 532 | 53.2 | 4.61 | 95.23 | −0.30 | chlo: 9, nucl: 2, cyto: 2, mito: 1 |
- a Coding sequencing length.
- b Protein length.
- c Molecular weight.
- d isoelectronic points.
- e Grand average of hydropathy.
- f subcellular localization prediction by WoLF PSORT (https://wolfpsort.hgc.jp/, accessed on 19/March/2023): Chlo = chloroplast; cyto = cytoplasm; nucl = nuclear; mito = mitochondria; cysk = cytoskeleton; plas = plasma membranes; E.R. = endoplasmic reticulum; golg = Golgi apparatus; extr = extracellular.
3.2 Phylogenetic Analysis and Genomic Distribution of FBXL Gene Sub-Family
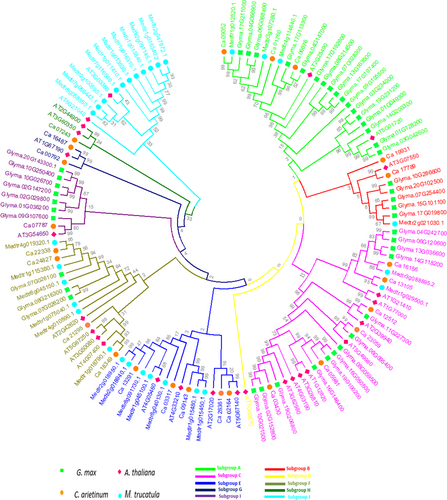
The investigation into the evolutionary progression of GmFBXLs (45) and their interconnections with A. thaliana (26), M. truncatula (30), and C. arietinum (26) involved the construction of the neighbour-joining phylogenetic tree in MEGA 7.0 software (Figure 1). The results from the phylogenetic analysis demonstrated the classification of FBXL members from these four species into 10 distinct subgroups (A-J). Group C stood out with 29 FBXL genes, while group D had only one member (from A. thaliana). Out of ten identified subgroups, four groups (A, B, C, and F) include FBXLs from all four species (Figure 1). The phylogenetic analysis highlights a robust and close association between GmFBXLs, AtFBXLs, CaFBXLs, and MedtrFBXLs. This proximity may be attributed, in part, to the dicotyledonous nature shared by Glycine, Cicer, Medicago, and Arabidopsis.
3.3 Structural characteristics of GmFBXLs
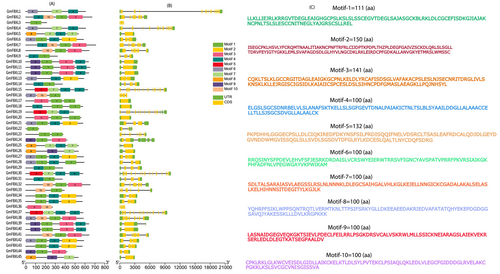
The phylogenetic tree is organized into ten distinct subgroups based on protein sequences retrieved from Phytozome (Figure 1). It was further observed that genes within the same branch displayed identical structure, whereas those in different branches exhibited variations in gene structure. The number of introns ranged from 1 (GmFBXL 4) to 16 (GmFBXL 34) (Figure 2B). The diversity in the number of introns could potentially be attributed to an evolutionary process, wherein a significant portion of these intron might have been lost over time. Using the MEME webserver, it was determined that predominant motifs in the GmFBXL family are 1, 3, 4 and 7, while a smaller subset displayed 2, 5 and 8 motifs (Figure 2C).
3.4 Chromosomal Location & Gene Duplication
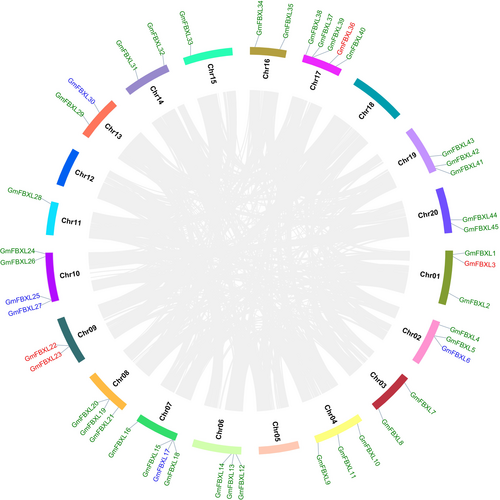
The distribution of all 45 GmFBXLs spanned across 16 chromosomes, except for chromosomes (chr) 5, 12, 18 and 20 (Figure 3). Remarkably, chr07, chr10 and chr17 stood out with the highest count of GmFBXLs, harbouring 5, 4, and 4 GmFBXLs, respectively. In contrast, chromosomes 1, 2, 4, 6, 8, and 19 have three GmFBXLs each, while chromosomes 3, 9, 13, 14, 16 and 20 contain two GmFBXLs each. Singular occurrences of GmFBXL gene were observed on each of chromosomes 11 (GmFBXL28) and 15 (GmFBXL33). The gene duplication analysis suggested that segmental duplication significantly influences the diversification and expansion of GmFBXLs genes. Thirty-six segmental duplication events (green colour), 5 tandem duplication (blue colour) and 4 dispersed (red colour) events were identified among the 45 GmFBXLs (Figure 3). Further, the collinear analysis suggested high conservation among GmFBXLs, and a total of 29 possible pairs interact with each other (Table S1). Moreover, non-synonymous and synonymous mutation analyses were performed and 28 pairs showed purifying selection and only one pair (GmFBXL28-GmFBXL4) had positive selection (Table 2). Therefore, based on the greater proportion of purifying selection among GmFBXLs, it was hypothesized that purifying selection in such genes contributes to the conservation of functional genes, protein structure, and adaptive traits. Also, their average rate of divergence analysis suggested that about 16.24 million years ago (MYA), GmFBXLs were originated from a duplication event (Table 2).
| Gene1 | Gene2 | Ks | Ka | Ka/Ks | Selection Pressure | Duplication Time (MYA) |
|---|---|---|---|---|---|---|
| GmFBXL1 | GmFBXL4 | 0.09 | 0.02 | 0.21 | Purifying | 2.87 |
| GmFBXL2 | GmFBXL7 | 0.17 | 0.03 | 0.16 | Purifying | 5.73 |
| GmFBXL5 | GmFBXL13 | 0.78 | 0.12 | 0.15 | Purifying | 26.10 |
| GmFBXL8 | GmFBXL28 | 0.11 | 0.02 | 0.18 | Purifying | 3.50 |
| GmFBXL10 | GmFBXL32 | 0.77 | 0.09 | 0.12 | Purifying | 25.73 |
| GmFBXL9 | GmFBXL35 | 0.15 | 0.04 | 0.28 | Purifying | 4.87 |
| GmFBXL11 | GmFBXL34 | 0.17 | 0.08 | 0.49 | Purifying | 5.53 |
| GmFBXL10 | GmFBXL42 | 0.66 | 0.10 | 0.15 | Purifying | 21.83 |
| GmFBXL9 | GmFBXL42 | 0.61 | 0.08 | 0.13 | Purifying | 20.40 |
| GmFBXL11 | GmFBXL41 | 0.13 | 0.01 | 0.11 | Purifying | 4.23 |
| GmFBXL10 | GmFBXL12 | 0.13 | 0.02 | 0.13 | Purifying | 4.30 |
| GmFBXL12 | GmFBXL13 | 0.16 | 0.03 | 0.16 | Purifying | 5.20 |
| GmFBXL14 | GmFBXL14 | 0.16 | 0.03 | 0.18 | Purifying | 5.23 |
| GmFBXL13 | GmFBXL31 | 0.13 | 0.01 | 0.06 | Purifying | 4.23 |
| GmFBXL12 | GmFBXL39 | 0.57 | 0.12 | 0.22 | Purifying | 19.07 |
| GmFBXL18 | GmFBXL40 | 0.41 | 0.18 | 0.44 | Purifying | 13.73 |
| GmFBXL15 | GmFBXL40 | 0.62 | 0.06 | 0.10 | Purifying | 20.60 |
| GmFBXL16 | GmFBXL20 | 0.60 | 0.13 | 0.21 | Purifying | 20.03 |
| GmFBXL15 | GmFBXL19 | 0.44 | 0.19 | 0.43 | Purifying | 14.63 |
| GmFBXL16 | GmFBXL21 | 0.64 | 0.16 | 0.26 | Purifying | 21.43 |
| GmFBXL16 | GmFBXL33 | 0.60 | 0.07 | 0.11 | Purifying | 19.87 |
| GmFBXL26 | GmFBXL38 | 0.64 | 0.11 | 0.18 | Purifying | 21.40 |
| GmFBXL24 | GmFBXL42 | 0.59 | 0.17 | 0.28 | Purifying | 19.63 |
| GmFBXL28 | GmFBXL45 | 1.03 | 0.40 | 0.39 | Purifying | 34.47 |
| GmFBXL28 | GmFBXL44 | 2.37 | 3.06 | 1.29 | Positive | 78.83 |
| GmFBXL29 | GmFBXL31 | 0.11 | 0.01 | 0.13 | Purifying | 3.63 |
| GmFBXL33 | GmFBXL33 | 0.65 | 0.37 | 0.57 | Purifying | 21.60 |
| GmFBXL34 | GmFBXL38 | 0.46 | 0.12 | 0.25 | Purifying | 15.37 |
| GmFBXL35 | GmFBXL39 | 0.55 | 0.19 | 0.35 | Purifying | 18.23 |
| GmFBXL34 | GmFBXL37 | 0.15 | 0.06 | 0.40 | Purifying | 5.03 |
- Note: Actual gene IDs (GmFBXL1- GmFBXL45) are given in Table S1. Ks: synonymous substitutions, Ka: nonsynonymous substitutions, MYA: million years ago.
3.5 Expression analysis of GmFBXLs
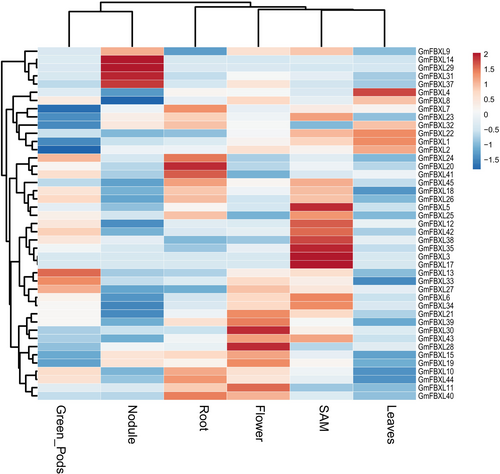
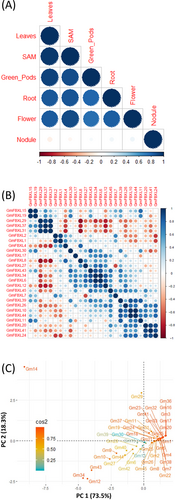
To investigate the expression patterns of 45 GmFBXLs, expression data sourced from public database (http://bar.utoronto.ca/efpsoybean) were used. The study focused on six different tissues: shoot apical meristem (SAM), flower, green pods, leaves, nodules, and roots. Through heatmap analysis, significant variation was observed in the expression levels of the 43 GmFBXLs across these tissues, excluding GmFBXL16 and GmFBXL36. Noticeably, the majority of these genes were observed to exhibit varied expression in multiple tissues (Figure 4). A substantial number of the GmFBXLs genes displayed higher expression levels in SAM and flowers than in the other plant parts (Figure 4). Strikingly, four genes (GmFBXL31, GmFBXL37, GmFBXL14 and GmFBXL29) exhibited specifically high expression in root nodules, suggesting an evolutionary adaptation of GmFBXLs with an enhanced role in the underground parts. The diversity of expression patterns implies the possible involvement of GmFBXLs in the regulation of various tissues and their responses to different abiotic and biotic stressors. The Pearson correlation analysis (P = 0.05) was performed to comprehend the relationship among GmFBXLs, examining their responses within specific tissue and among genes within the FBXL family (Figure 5). A significant positive correlation (P < 0.05) was found among different tissues and within the genes of GmFBXLs (Figure 5). Furthermore, PCA analysis was employed to elucidate the single gene contributions to the overall variation. The results for all studied variables revealed a variance of up to 91.8% along the two principal axes (PC1 and PC2). A PCA biplot was constructed based on PC1 and PC2, revealing distinct variations in gene expression. This dispersion of genes in the biplot signifies the maximum available variation, suggesting that genes located closer to each other have similar expression levels. Conversely, genes positioned further from the origin point exhibit higher levels of variation in terms of gene expression and may be suitable for further validation through qPCR (Figure 5).
3.6 Cis-acting Regulatory Elements in GmFBXLs
CAREs play a significant role in gene expression regulation (Wittkopp & Kalay 2012). The GmFBXLs sequences exhibited a significant presence of the CAREs associated with seed-specific regulation, endosperm expression, circadian regulation and cell cycle regulation. These include the RY-element, CAT-box, AT-rich element O2-site, GCN4_motif, circadian motif and MSA-like, identified in their promoter region (Figure S1, Table S2). Remarkably, every gene within the GmFBXLs family possesses one or more elements regulated by abscisic acid (ABRE), methyl jasmonate (G-box), and salicylic acid (TCA-element) (Figure S1).
3.7 GmFBXL12 Expressed in Young Leaf and Seed at Different Stages of Development
The GmFBXL12 (Glyma.06 g068400), which encompasses a 1917-bp ORF encoding a protein of 638 amino acids (aa) (Table 1), was transformed into Tianlong No.1 (soybean cultivar) under the control of the 35S promoter. A total of 20 T0 transgenic plants were randomly chosen and selected via various techniques (see material and methods) and selected again in T1 and T2 generation (Figure 6).Two homozygous T2 overexpression lines (OE1 & OE2) were chosen for subsequent screening.
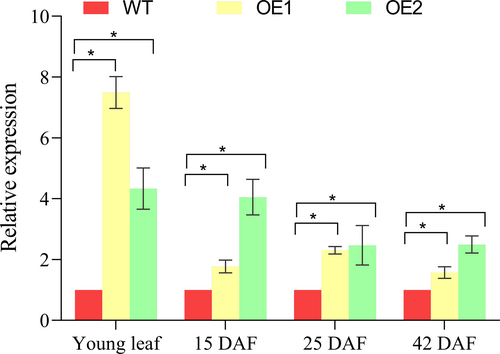
The expression pattern of GmFBXL12 was analyzed at various developmental stages, specifically at 15, 25, and 42 days after flowering (DAF). In all stages of young leaf development and across three development phases, both OE1 and OE2 consistently had elevated expression compared to the wild type (Figure 7). Particulaly, it was observed that transcript levels were more pronounced during the initial stage of endosperm formation. In both OE1 and OE2, the expression of GmFBXL12 peaked at 15 DAF and began to decline as the seeds matured, and had lowest expression level at 42 DAF (Figure 7).
3.8 Seed-related Traits and Yield Components of Overexpression Lines and Wild Type
To assess the effect of GmFBXL12 overexpression on soybean seed architecture, the shape and size of seeds in WT, OE1 and OE2 were measured and analyzed. It was observed that the seeds of OE1 and OE2 were relatively longer, wider, and thicker than the WT. Significant differences were observed in seed length (SL), seed width (SW), and seed thickness (ST) when comparing the transgenic lines to the WT. However, no significant differences were noted for three seed ratio traits (SWT, SLT, SLW) among WT, OE1, and OE2 (Figure 8).

Furthermore, plants overexpressing GmFBXL12 exhibited significant boosts in seed yield-related traits and plant height compared to the WT. OE1 and OE2 had a higher number of pods, increased number of seeds per plant, greater 100-seed weight, and taller plant height than the wild type (Figure 8). This suggests that GmFBXL12 overexpression can potentially modulate soybean seed and plant architecture.
4 DISCUSSION
4.1 The Evolutionary Trajectory and Expansion of GmFBXLs Proteins in Soybean
During its evolutionary history, soybean genome has undergone two successive whole-genome duplication (WGD) events approximately 59 million years ago and 5 to 13 million years ago, respectively. This gave rise to a massively duplicated genome, where 75% of genes are found as paralogous copies (Gill et al. 2009; Schmutz et al. 2010). Moreover, the increase in gene copies and genetic diversity is largely influenced by both segmental and tandem duplications (Zhao et al. 2018). In many plant species, a large number of F-box genes has experienced significant modifications throughout the evolutionary history of land plants and has experienced numerous gains and losses specific to particular lineages or species (Zhang et al. 2021). A comparative analysis of F-box genes in soybean and 17 other plants was conducted to illustrate the evolutionary selection, functional correlation, and expansion of the F-box genes. The studies suggested that genetic drift could be a contributing factor to the existing diversity in F-box gene family (Gagne et al. 2002; Hua et al. 2011; Bellieny-Rabelo et al. 2013). The comparative analysis of soybean genomes in this study highlighted the evolutionary dynamics of the FBXL gene family across different plant species (C. aretineum, M. trunculata, and A. thaliana) (Figure 1). Our study revealed two important scenarios about the implication of gene duplication in their evolutionary process. Firstly, among the 45 GmFBXLs, a total of 36 GmFBXLs had undergone segmental duplication event, while 5 genes were duplicated by tandem and 4 genes were duplicated in a dispersed manner. This finding is in accordance with previous studies, revealing that the extension of the Gm-Fbox gene family was mainly due to WGD or segmental duplication (Hua et al. 2011; Bellieny-Rabelo et al. 2013; Jia et al. 2017; Xu et al. 2022). Similarly, the F-box gene family expanded significantly in Triticum aestivum L., Pyrus communis, Gossypium hirsutum, Oryza sativa and Cicer aretineum with a predominant influence from segmental and WGD (Gupta et al. 2015; Cao et al. 2016; Wang et al. 2016; Zhang et al. 2019; Xiao et al. 2020). Secondly, the analysis of mutation rates indicated that 28 pairs underwent purifying selection, with an average rate of duplication divergence events approximately at ≈16.24 MYA. The divergence analysis at 16.24 MYA suggests that GmFBXLs exhibited high similarity to Brassica rapa and Arabidopsis thaliana from 9.6–16.1 MYA (Wu et al. 2017). These findings suggest that the continuous evolution of duplicate genes is an ongoing process in soybean. This phenomenon likely played a role in the transformation of soybean from a wild, vine-like plant into the unwavering economic force it currently represents.
4.2 Physiochemical Properties and Expression Pattern of GmFBXLs
In the C-terminal region of the F-box proteins, various domains, including FBD, FBA and LRRs, have been recognized. Among these domains, the LRR domain stands out as the most prevalent type, contributing to the structural stability of protein–protein interactions in both eukaryotes and viruses (Kobe & Kajava 2001; Gagne et al. 2002; Jain et al. 2007). In this study, we identified 45 non-redundant F-box proteins with diverse physiochemical characteristics (including predicted PI, aa, GRAVY and mW) (Table 1), suggesting that GmFBXLs proteins may constitute a versatile gene family with functions not yet fully realized.
Soybean F-box proteins also exhibit considerable variation in biochemical characteristics and subcellular localizations. The majority are foreseen to reside in the cytoplasm, nucleus and other organelles, whereas fewer are anticipated to be in the plasma membrane, endoplasmic reticulum, Golgi apparatus and vacuole (Table 1). A significant number of F-box proteins were also localized in multiple organelles. Previously, F-box proteins were tested in Arabidopsis and revealed the predominant localization within intracellular components, with a single F-box protein forming multiple SCF complexes, highlighting their distinct roles in regulating numerous plant biological mechanisms (Kuroda et al. 2012). It aligns with the study indicating that the majority of F-box proteins in soybean are distributed across multiple subcellular organelles (Jia et al. 2017). The analysis of conserved motifs revealed the presence of seven motifs conserved across all 45 GmFBXLs proteins (Figure 2). Remarkably, most of them share motifs 1, 3, 4 and 7, suggesting a close phylogenetic relationship among these members. Given the limited understanding of plant F-box genes, it is valuable to explore the functions of these recognized conserved domains in relation to their substrates and the regulation of cellular activities.
Analysing the expression of soybean ubiquitin genes can offer crucial insights into their potential functions. To enhance our understanding of the roles played by ubiquitination-related genes in soybean immunity, we investigated the expression patterns of GmFBXLs across various growth and developmental stages by using public transcriptomic data covering five different tissues (SAM, Flower, Leaves, Nodule, Root). The results revealed varying expression levels across different tissues, suggesting the presence of functional diversity among GmFBXLs. This warrants further functional studies to unravel their roles in soybean development.
Gene structure, crucial for gene family analysis, is influenced by intron positions, dictating coding sequences and protein structures (Wang et al. 2016; Yan et al. 2019). The examination of exon-intron arrangement proves valuable in exploring the evolutionary interrelationship within gene families (Yang et al. 2008; Koralewski & Krutovsky 2011). In this study, a comprehensive examination of exon-intron organization uncovers remarkable resemblances among various GmFBXLs genes within the same phylogenetic group, with only minor inconsistencies. It is noteworthy that a few exceptional cases exhibit slight variations in the numbers of exons and introns across different GmFBXLs genes (Figure 2). The results of Jain et al. (2007) equally corroborate our findings, where a similar gene structure for F-box protein has been observed in rice. These findings indicate a considerable level of conservation within GmFBXLs, and the presence of diverse gene structures is likely a result of continuous mutations during the evolutionary process (Yan et al. 2019).
Key motifs such as the GTAC, SKn-like motif, RY-element, CATTC motif, CACTA, CAAT-box motif, which were commonly observed in our study (Figure S1, Table S2), have been considered essential for grain shape and quality (Wang et al. 2015), seed development and size (Guo et al. 2019), plant height and grain yield (Xie et al. 2018), seed size, width and seed weight (Huang et al. 2020; Shi et al. 2020, Wang et al. 2020b), respectively. Furthermore, CAREs involved in hormone responses, such as ABREs, ABA-responsive element, and the AuxRR-core were also observed (Figure S1, Table S2), suggesting role of GmFBXLs in hormone signalling, regulation of stomatal closure, initiation and maintenance of seed dormancy, acting as intermediaries in plant reactions against salt stress, water scarcity, and low temperate (Xu et al. 2015; Yoshida et al. 2015). Hence, further investigations are needed to validate the functional significance of these genes.
4.3 The Seed Size and Plant Architecture are regulated by GmFBXL12
While various signaling pathways governing seed size under maternal influence have been discovered in Arabidopsis and rice, including ubiquitin-proteasome signaling (Li et al. 2019), the molecular network orchestrating seed size regulation in soybean is currently less elucidated in comparison to model plants. Rice and Arabidopsis have 40 and 35 known seed size-related genes, respectively, while only one soybean seed size gene (GmPP2C1) has been identified (Lu et al. 2017). The discovery of the RING-type E3 ligase GW2 within a QTL underlying rice grain size and weight emphasized its regulatory function in both crop yield and seed size (Song et al. 2007; Yamaguchi et al. 2020; Achary & Reddy 2021; Rasheed et al. 2022). However, how GmGW2 controls the regulation of soybean seed size is unknown. In our study, the upregulation of GmFBXL12 led to modifications in seed morphology, resulting in enhancements in various seed size and shape traits (SL, SW, ST, and SWT) when compared to the wild type (Figure 8). These changes resulted primarily from an expansion in cell number and a marginal increase in cell size (Shi et al. 2019). Previous studies indicate that the overexpression of GmSWEET10a / GmSWEET10b leads to a substantial increase in soybean seed size in contrast to wild type (Wang et al. 2020a). Similarly, the overexpression of GmSS1 results in the production of larger seeds. The modulation of GmSS1 has the potential to positively influence cell division and expansion in transgenic plants (Zhu et al. 2022). GmKIX8-1, an ortholog of ATKIX8 in soybean, plays a role in regulating cell proliferation and organ size. The mutants of GmKIX8-1 exhibited a profound increase in leaf and size attributed to the overexpression of CYCLIN D3;1–10 and enhanced cell proliferation (Nguyen et al. 2021).
Our study also suggests that overexpressing GmFBXL12 has the potential to increase seed yield, number of pods, seed number per plant, plant height, and 100-SW in the transgenic lines, highlighting its significance in regulating seed size and plant architecture (Figure 8). Previous studies show that in soybean, GmILPA1, encoding an APC8-like protein, plays a significant role in plant architecture modification. The gmipla1 mutant displays changes in petiole angle and leaf development (Gao et al. 2017). Similarly, an increase in the expression level of GmmiR156b has the potential to enhance the number of branches and number of nodes, significantly improving soybean plant architecture and ultimately improving yield (Sun et al. 2019). Other studies have reported an increase in seed size and pod number through overexpressing GmPIP2;9 (Lu et al. 2018). Increased expression of GmWRI1b leads to a significant rise in the node number, pod number per plant, stem diameter, branch number, yield per plant while simultaneously decreasing plant height and internode length (Guo et al. 2020). Recently, a study was conducted to elucidate the role of maternal-dependent modulation of seed size in Arabidopsis and soybean (Yu et al. 2023). However, further investigation is required to explore the molecular mechanisms of the GmFBXLs12 in the soybean yield enhancement.
5 CONCLUSION
In conclusion, this study provides a detailed and comprehensive genome-wide characteristics of GmFBXLs in soybean. In total, 45 putative GmFBXLs genes in soybean were identified and their physiochemical properties, gene structures, phylogeny, and other aspects were analyzed, revealing that GmFBXL may play diverse roles in soybean. Overexpression of GmFBXL12 in the Tianglong 1 soybean cultivar resulted in significant change in seed shape and size, number of pods and seeds per plant, 100-seed weight, and plant height compared to the WT. These findings lay the foundation for unravelling the function of GmFBXLs in breeding climate-smart and high-yielding soybean.
AUTHOR CONTRIBUTIONS
A.H. and T.Z. conceived the idea and designed the experiment. A.H., N.K. and B.K. performed data analysis. A.H. prepared the original draft of this work. A.H., B.K., N.K. A.A., K.K., and W.L. contributed to the revision and proofreading of this manuscript. All authors have read and agreed to the published version of the manuscript.
FUNDING INFORMATION
For this research work funding was provided by the National Natural Science Foundation of China (32171965), the Jiangsu Collaborative Innovation Centre for Modern Crop Production (JCIC-MCP) Program and the Core Technology Development for Breeding Program of Jiangsu Province (JBGS-2021-014).
Open Research
DATA AVAILABILITY STATEMENT
The data used during the current study are available from the corresponding author upon reasonable request.


