Photosynthetic adaptation mechanisms of waterlogged wheat (Triticum aestivum) at flowering under exogenous nitric oxide donor application
Abstract
The effects of nitric oxide (NO) on the photosynthetic adaptation mechanisms of wheat plants in waterlogging during the flowering stage are poorly understood. Field and pot experiments using two cultivars were conducted with three treatments: waterlogging (WL), waterlogging plus NO donor sodium nitroprusside (WLsnp), and adequate water (CK). The results indicated that the WLsnp and CK treatments exhibited significantly higher 1000-kernel weight and yield than the WL treatment because of high photosynthetic potential(P<0.05). We found that the photosynthetic performance, including photosynthetic rate (Pn), stomatal conductance (gs), mesophyll conductance (gm), carbon dioxide concentration at the carboxylation site (Cc), maximum carboxylation rate (Vcmax), maximum electron transfer rate (Jmax), actual electron transfer rate (J), actual PSII efficiency (ΦPSII) and potential maximum efficiency in PSII (Fv/Fm), was significantly improved in the WLsnp treatment compared to the WL treatment, both during waterlogging and after de-waterlogging. Little difference was observed in the photosynthetic performance between the WLsnp and CK treatments during waterlogging for cultivar YM15 and after de-waterlogging for cultivar YM24. Further analysis indicated that gs, gm and J were identified as key physiological indicators that synergistically regulate Pn of waterlogged wheat plants. Overall, the improvement of wheat's waterlogging resistance capacity after spraying NO is mainly related to high gs, great gm, and high J.
1 INTRODUCTION
Waterlogging is a significant factor hindering the optimal yield of wheat (Pampana et al., 2016; de S. Nóia Júnior et al., 2023; Liu et al., 2023). With the projected increase in global temperatures, precipitation patterns are expected to exhibit a rising trend in the future (Du et al., 2021; Kai et al., 2022), which may further exacerbate the detrimental impacts of waterlogging on wheat yield and pose a threat to food security, not only in China but also worldwide (Herzog et al., 2016; Pampana et al., 2016). Therefore, enhancing waterlogging tolerance and achieving high yields in wheat production have become crucial challenges for the future, and it is imperative to develop effective technologies to address this crisis.
Cultivation of robust plants is an effective approach for improving plant tolerance to various abiotic stresses, including waterlogging, drought, and extreme temperatures (He et al., 2021). Alternatively, the exogenous application of hormones has been recognized as a timely and effective method for improving waterlogging tolerance in wheat plants (Zhang et al., 2022a). Several hormones, such as abscisic acid (Kim et al., 2018), methyl jasmonate (Ghasem et al., 2022), salicylic acid (Koramutla et al., 2022), 6-benzylaminopurine (Zhang et al., 2022a), ethylene (Iqbal et al., 2011), and ethephon (Wang et al., 2016) have been reported to promote grain yield in waterlogged wheat plants. In recent years, several investigations have focused on nitric oxide (NO) as a signalling molecule that plays a crucial role in enhancing waterlogging resistance in plants (Zangani et al., 2018; Zhang et al., 2021a). When wheat is subjected to flooding, its roots synthesize endogenous NO by upregulating the nitric reductase pathway (Aakanksha et al., 2017). NO then activates downstream abscisic acid signalling and regulates mechanisms related to waterlogging resistance (Bright et al., 2006; Murata et al., 2015). Therefore, the exogenous application of NO could play a positive role in improving waterlogging resistance by regulating endogenous NO functions. Recent studies have confirmed the hypothesis that the exogenous application of NO can potentially improve waterlogging tolerance before flowering in wheat plants by enhancing oxidative defence and regulating nutritional status (Mfarrej et al., 2022). However, there are still large knowledge gaps on waterlogging tolerance mechanisms in exogenous NO for wheat plants.
The decreased grain yield in waterlogged conditions can be attributed to a complex interplay of various regulating mechanisms in plants. The existing literature have extensively summarized the potential mechanisms that contribute to this phenomenon, including physical change in soil (i.e., soil compaction, oxygen depletion, CO2 accumulation, and low diffusion coefficient for gases), chemical changes in soil (i.e., ion toxicity, secondary metabolite toxicity, low redox potential, and declined soil pH), biological changes in soil (i.e., low mineralization rate, low aerobic microbial activity, and low immobilization rate) and low growth rate and poor metabolic capability of all organs in plants (Hossain and Uddin, 2011; Arduini et al., 2016; Herzog et al., 2016; Manik et al., 2019; Kaur et al., 2020; de S. Nóia Júnior et al., 2023). From the perspective of plant growth and metabolic processes, the primary impact of waterlogging on wheat plants is the insufficient supply of assimilates due to reduced photosynthetic production capacity during waterlogging (Cotrozzi et al., 2021; Ma et al., 2022a; Olorunwa et al., 2022; Li et al., 2023; Liu et al., 2023).
In general, photosynthesis is restricted by stomatal conductance (gs), mesophyll conductance (gm) and the biochemical processes of the photosynthetic carbon fixation in plants (Lauteri et al., 2014; Ouyang et al., 2017). Previous research reported that gs is the main limiting factor associated with diminished photosynthesis in waterlogged wheat plants by demonstrating that the application of exogenous ethylene and ethephon significantly enhances photosynthetic potential by improving gs (Iqbal et al., 2011; Wang et al., 2016). However, Wu et al. (2012) suggest that non-stomatal factors have a greater impact on the reduced photosynthetic production capacity during waterlogging at the flowering stage rather than stomatal factors in wheat. These discrepancies in previous studies may be attributed to variations in the severity of waterlogging and the waterlogging resistance capacities of different cultivars (Ploschuk et al., 2020). Waterlogging-tolerant cultivars can maintain a high photosynthetic rate (Pn) during waterlogging due to their higher gs than waterlogging-sensitive cultivars (Olorunwa et al., 2022). On the other hand, low gm is considered the main factor restricting Pn in waterlogging-sensitive cultivars during waterlogging (Jahan et al., 2021; Olorunwa et al., 2022). Moreover, in the early stages of waterlogging, Pn is primarily reduced due to a decrease in gs. However, as the waterlogging period prolongs, Pn becomes constrained by a significant decrease in gm in wheat plants (Herzog et al., 2016; Ploschuk et al., 2018).
A decrease in the actual photochemical efficiency (ΦPSII) of photosystem II in wheat plants compared to conventional water management has been observed during waterlogging (Ma et al., 2022b). Several studies have also demonstrated that photochemical efficiencies are reduced in stressed plants as Pn decreases (He et al., 2014; Yi et al., 2016). More recently, it has been discovered that NO can maintain high photochemical efficiencies in the PSII system and Pn in waterlogged cotton (Zhang et al., 2021a). These findings suggest that NO can improve waterlogging resistance and that its effects are closely linked to the photosynthetic performance of plants. However, little is known about how the gs, gm, and biochemical functions, such as photochemical processes in the PSII system, synergistically mediate the Pn of wheat plants during waterlogging and de-waterlogging, particularly when exogenous NO is applied to waterlogged wheat plants.
The period from stem elongation stage to the flowering stage is considered the most vulnerable stage to waterlogging-induced yield reductions in wheat plants (de San Celedonio et al., 2014; Arduini et al., 2016; de S. Nóia Júnior et al., 2023). Furthermore, in our study region, which includes the middle and lower reaches of the Yangtze River, wheat plants commonly face waterlogging or even flooding stress during the anthesis stage in our study region of the middle and lower reaches of the Yangtze River (Xu et al., 2022). Therefore, in this present study, we applied waterlogging combined with spraying that provides exogenous NO at the flowering stage in both pot and field experiments using two different common wheat cultivars. The main objectives of this study were (1) to evaluate whether NO can enhance the yield potential of waterlogged wheat plants by maintaining high photosynthetic potential through field and pot experiments and (2) to uncover the mechanisms that gs, gm, and photochemical processes in the PSII system synergetically regulates Pn during waterlogging and de-waterlogging periods, as investigated in the pot experiment. By addressing these objectives, our study aims to provide novel insights into the photosynthetic mechanisms and potential regulatory practices for improving the waterlogging tolerance capacities of wheat plants during this critical period of waterlogging sensitivity.
2 MATERIALS AND METHODS
2.1 Experimental design
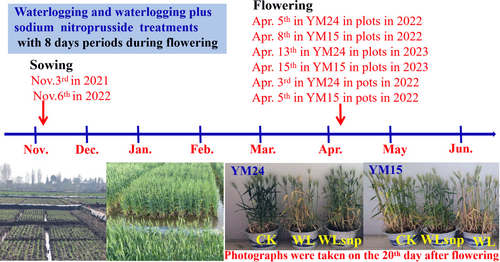
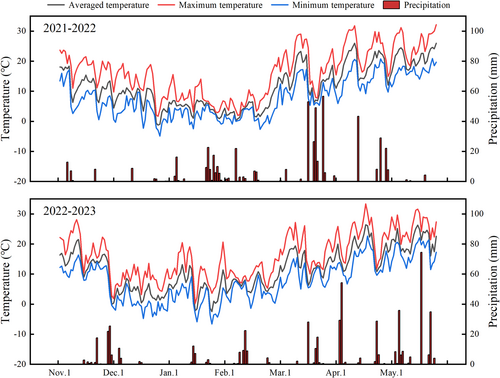
The pot and field experiments were conducted over two consecutive growing seasons, 2021–2022 and 2022–2023, at the Wanzhong Comprehensive Experimental Station of Anhui Agricultural University in China (31°48′N, 117°23′E). The experimental station is located in a region with typical subtropical monsoon climate characteristics. Figure 1 illustrates the daily minimum and maximum temperatures, daily average temperature, and daily rainfall precipitation recorded throughout the two consecutive growing seasons of the wheat plants from 2021 to 2023. For this study, two different cultivars with varying waterlogging tolerance, namely Yangmai24 (YM24) and Yangmai15 (YM15), were selected based on previous preliminary research. These cultivars are commonly grown in the middle and lower reaches of the Yangtze River in China. Notably, cultivar YM15 demonstrates strong waterlogging tolerance, whereas cultivar YM24 has poor waterlogging tolerance. All experimental plots and pots were manually sown on November 3, 2021 (Picture 1). Then, on November 6, 2022, each plot was manually sown with both cultivars (Picture 1).
2.2 Experiment 1: Pot experiment
The purpose of the pot experiment was to investigate the mechanisms by which exogenous application of sodium nitroprusside (SNP), an NO donor, promotes yield formation and enhances waterlogging tolerance in wheat plants at the flowering stage by regulating photosynthetic performance. To achieve this, three treatments were established for both cultivars: waterlogging (WL), waterlogging plus SNP (WLsnp), and control (CK). During the experiment, a water layer with a depth of 2 cm was maintained for eight consecutive days in both the WL and WLsnp treatments for both cultivars. Specifically, in cultivar YM24, the waterlogging period was from the 3rd to the 10th day of April, while in cultivar YM15, it was from the 5th to the 12th day of April (Picture 1). The duration of the waterlogging period was determined based on previous findings where it was observed that the vigorous growth of all tested cultivars was significantly reduced after seven days of waterlogging in a field experiment (Ma et al., 2022a). Meanwhile, 150 μmol L−1 of sodium nitroprusside was sprayed on the 2nd, 4th, and 6th day during waterlogging in the WLsnp treatment in both cultivars. The spraying time was conducted from 09:00 to 11:00. for each waterlogged pot to saturate the leaf to the point where the NO solution naturally dripped from the leaf surface. For the CK group, suitable soil moisture content with 75 ± 5% of field capacity at 20 cm soil layer was maintained during the same flowering periods in both cultivars. After the waterlogging period reached eight days, the water layer was immediately drained in both the WL and WLsnp treatments for both cultivars. Subsequently, the soil water content in the 20 cm soil layer was maintained at 75 ± 5% of the field capacity until maturity. The soil water content was monitored using a portable soil moisture meter in each pot across the cultivars and treatments. Supplementary irrigation, in the form of one liter of tap water per pot, was administered when the soil water content was lower than 70% of the field capacity.
The pot experiment was conducted using a completely randomized design, with each treatment consisting of 30 pots for each cultivar. The volume of the pot was 1.22 × 103 cm3 with a diameter and height of 24.5 and 26 cm, respectively. Each pot was filled with 13 kg of fine-grained soil from the field experiment. The physical and chemical properties of the soil were the same as in the field experiment in 2021 (Table 1). In each pot, 16 seeds were sown to ensure an adequate seed population. To minimize experimental error due to variations in plant population, 8 healthy seedlings were retained by removing weaker seedlings once the third leaf emerged in each pot for both cultivars. In each pot of both cultivars, the applied amounts of N, P2O5, and K2O were 1.15, 0.57, and 0.57 g, respectively. These nutrients were supplied using a combination of fertilizers, consisting of 3.80 g commercial compound fertilizer with pure nitrogen, pure phosphorus and pure potassium, each at 15%, and 0.52 g of urea fertilizer with 46% N content was used as a base fertilizer. Additionally, at the jointing stage for both cultivars, 0.75 g of urea with a nitrogen content of 46% was applied as a supplementary nitrogen source.
| 2021 ~ 2022 | 2022 ~ 2023 | |
|---|---|---|
| Organic matter content (g kg−1) | 21.02 | 23.44 |
| Total N content per kilogram soil (%) | 0.12 | 0.09 |
| Available P per kilogram soil (%) | 3.52 | 3.41 |
| Available K per milligram soil (%) | 0.014 | 0.009 |
| pH value | 6.23 | 6.30 |
| Soil bulk density (g cm−3) | 1.30 | 1.28 |
2.3 Experiment 2: Field experiment
To further validate and confirm the effects of NO in improving waterlogging tolerance in wheat based on gas exchange parameters and yield formation characteristics, a field experiment was conducted simultaneously with the same three treatments from 2021 to 2023 years. The physical and chemical properties of soil are shown in Table 1. During this field experiment in 2022, the waterlogging periods for both cultivars were from the 5th to the 12th of April for YM24 and from the 8th to 15th of April for YM15 in both the WL and WLsnp treatments (Picture 1). In 2023, wheat plants were waterlogged from the 13th to the 20th of April for YM24 and from the 15th to 22nd of April for YM15 (Picture 1). The concentration and time of SNP application were identical to those in the pot experiment. NO solution was manually sprayed from 09:00 to 11:00 for each waterlogged plot. Meanwhile, the leaf surface was sprayed to a saturated state whereby the NO solution began to naturally drip from the leaf surface for each waterlogged plot. For the CK plots, the soil water content in the 20 cm soil layer was maintained at 75 ± 5% of the field capacity for both cultivars. Additionally, in each plot, the water layer was immediately drained when the waterlogging period reached 8 days for both the WL and WLsnp treatments in both cultivars. Subsequently, 30 mm of supplementary irrigation water was provided to all treatments when the soil water content at 20 cm soil layer was lower than 70% of field capacity after draining, and this was maintained until maturity. The soil water content was also monitored using a portable soil moisture meter in each plot across the cultivars and treatments.
The field experiment was designed using a randomized block design with three replications in both study years. Each plot had a dimension of 4 m in length and 3 m in width, resulting in a total area of 12 m2. The distance between adjacent rows was set at 25 cm. In the field experiment, a seeding rate of 187.5 kg per hectare was used, equivalent to 18.75 g of dried seeds in each row for all cultivars. A total of 225 kg N ha−1, 112.5 kg P2O5 ha−1 and 112.5 kg K2O ha−1 were applied to all plots. Of the total fertilizer applied, 70% of the N fertilizer, P2O5 and K2O were used as basal fertilizer, while the remaining 30% of the N was applied at the jointing stage for both cultivars. To prevent water and NO solution exchange between adjacent plots, waterproof membranes were buried at a depth of 40 cm below the soil surface. Additionally, plastic-covered dams with a height of 20 cm were established around the edges of all plots to minimize surface runoff. Before flowering, cultivation practices, including irrigation, plant diseases, and insect pests in field and pot experiments, were the same as those used by local farmers.
2.4 Measurements
All pots were transferred from outdoor to artificial climate chambers to control environmental factors when wheat plants started to waterlog in both cultivars because photosynthetic parameters are sensitive to atmospheric conditions. Meanwhile, 30 flag leaves with flowering on the same day were randomly labelled from 15 to 20 pots in each treatment to eliminate sampling error when the wheat plants began to waterlog. In addition, all photosynthetic parameters were measured on the 8th day after flowering (referred to as the 8th day) and on the 16th day after flowering (or the 8th day of water draining, abbreviated as the 16th day) for the three treatments in both cultivars (Picture 1). The conditions in the climate chamber were set as follows: a daytime temperature of 25°C, nighttime temperature of 18°C, relative humidity of 75%, photoperiod of 12 hours, and light intensity of 1200 μmol m−2 s−1. After the measurements, all the pots of both cultivars were moved outdoors.
2.4.1 Gas exchange parameters
The net photosynthetic rate (Pn), intercellular CO2 concentration (Ci) and stomatal conductance (gs) at steady state were measured using a portable photosynthetic apparatus of an open-low gas exchange system, specifically the Li-Cor 6400XT (Li-Cor Inc.) in pot experiment and field experiment. In the pot experiment, the 6400–40 fluorescence chamber attachment was utilized. The temperature inside the chamber was set at 25°C. The CO2 concentration within the chamber was maintained at 400 μmol mol−1, supplied by a CO2 cylinder. The light intensity provided in the chamber was 1200 μmol m−2 s−1, generated by a red/blue (9:1) LED light source. Measurements were taken on five labelled flag leaves from at least 3 pots during both observed periods for each treatment and both cultivars.
In the field experiment, five representative flag leaves were randomly chosen from three plots of each treatment to obtain gas exchange parameters using a standard leaf chamber from 09:00 to 11:00 on the 8th day after flowering (20th of April) and on the 16th day after flowering (28th of April) in 2023. Unfortunately, we were unable to obtain gas exchange parameters during the two scheduled monitoring periods in the year 2022 because of cloudy and rainy weather.
2.4.2 Mesophyll conductance (gm)
Γ* represent the compensation point of CO2 without day respiration, as referenced by Yin and Struik (2009).
Rd corresponds to the respiration rate of daytime, and J represents the electron transport rate in the PSII system at a light intensity of 1200 μmol m−2 s−1, both of which were referenced by Putten et al. (2018). Three labelled flag leaves from 3 pots were used to assess the gm parameter across the cultivars, treatments, and observed periods.
2.4.3 Carbon dioxide concentration at the carboxylation site
2.4.4 Photosynthetic light-response curve (Pn-PAR)
Ic is the light compensation point.
The light saturation point (Im), the maximum net photosynthetic rate (Amax) and dark respiration rate (Rd) were calculated in all treatments.
2.4.5 Photosynthetic response to carbon dioxide
The Pn of three flag leaves from pots was measured using the Li-Cor 6400XT open-low gas exchange system (Li-Cor Inc.) with a standard chamber measuring 2 cm in width and 3 cm in length. The measurements were conducted under different ambient CO2 concentrations. The order of the CO2 concentration gradient was manually set as follows: 400, 300, 200, 150, 100, 50, 400, 400, 600, 800, 1000, 1200, and 1500 μmol mol−1 for both cultivars and treatments. The PAR was set at 1200 μmol m−2 s−1, and the block temperature and VPDla were 25 ± 0.2°C and 1.3 ± 0.1 kPa, respectively, for all measurements.
O, Kc, and Ko represent the atmospheric oxygen partial pressure and Michaelis–Menten constants for CO2 and O2, respectively.
2.4.6 Chlorophyll fluorescence parameters
To assess chlorophyll fluorescence characteristics, five light-adapted flag leaves from the pots were illuminated with actinic light of 1200 mol m−2 s−1 for approximately 6 minutes in both cultivars and treatments. The steady-state fluorescence yield (Fs) was recorded using the portable photosynthetic apparatus Li-Cor 6400XT (Li-Cor Inc.), equipped with a 6400–40 fluorescence chamber. Then, a 0.80-s saturating pulse with 8000 mol m−2 s −1 PAR was applied to obtain the maximal fluorescence level (Fm′). At dawn, the same leaves were used to determine the minimum fluorescence level (Fo) and the maximal fluorescence level (Fm) of dark-adapted leaves across cultivars and treatments. The steady-state Fo was measured using far-red light with an illumination level of less than 1 micromol m−2 s −1. Subsequently, a 0.80-s saturating pulse with 8000 mol m−2 s −1 PAR was supplied to determine the Fm in both cultivars and treatments. Then, the chlorophyll fluorescence characteristics were assessed based on the measured parameters.
The potential maximum efficiency in PSII (Fv/Fm) of dark-adapted, the PSII maximum efficiency (Fv’/Fm′) in light-adapted conditions, the actual PSII efficiency of PSII (Φ PSII) were calculated as reported by Genty et al. (1989).
The minimum fluorescence (Fo’) in a light-adapted state was referenced from Oxborough and Baker (1997).
Non-photochemical quenching (NPQ) was estimated as previously described (Bilger and Bjorkman, 1990).
The photochemical quenching coefficient (qP) was estimated as previously described (Schreiber et al., 1986).
2.5 Yield and yield components
In the pot experiment, plants from 3 pots were used to count spikes per unit area, kernels per spike, and 1000-kernel weight. Furthermore, 6 pots were selected to assess the yield for both cultivars and treatments in the pot experiment. In the field experiment, wheat plants occupying an area of 2 m2 were harvested from each plot for both cultivars to accurately calculate the yield. Additionally, other yield-related parameters at the maturity stage, such as spikes per unit area, kernels per spike, and 1000-kernel weight, were assessed from 20 randomly selected plants within each plot.
2.6 Statistical analyses
The generalized linear model (GLM) was used to perform the analysis of variance in SPSS16.0. Differences between means were compared using Fisher's least significant difference (LSD) test at a significant level of 5%. Stepwise regression and path analysis were jointly used to explore the key physiological factors regulating photosynthetic rate in waterlogging. Figures were constructed using the OriginPro 8.5 software.
3 RESULTS
3.1 Yield and yield components of field and pot experiments
In the field experiment, both the WL and WLsnp treatments decreased the yield and 1000-kernel weight for both cultivars compared to the CK treatment in both study years (Table 2). No significant differences were observed for spikelets per square meter among the treatments across the cultivars and years (Table 2; P > 0.05). The yield and 1000-kernel weight showed a decline of only 19.22 ~ 23.94% and 10.00 ~ 18.97%, respectively, in the WLsnp treatment compared to the CK treatment across both cultivars and both study years (Table 2). However, the decline in yield and 1000-kernel weight was more pronounced, reaching 38.58 ~ 50.67% and 31.88 ~ 50.76%, respectively, in the WL treatment compared to the CK treatment in both cultivars and both years (Table 2). Generally, there were significant interaction effects between cultivar and water treatment, between cultivar and year, and between water treatment and year for 1000-kernel weight (P < 0.01; Table 2). However, only cultivar had a significant interaction effect with water treatment for grain yield (P < 0.05; Table 2).
| Year | Cultivar | Treatment | Spikes | Kernels per spike | 1000-kernel weight | Yield |
|---|---|---|---|---|---|---|
| (No.m−2) | (No.) | (g) | (×103 kg ha−1) | |||
| 2021 ~ 2022 | YM24 | CK | 457.80a ± 6.24 | 45.49 ± 1.27 | 43.33 ± 0.14 | 6.71 ± 0.03 |
| WL | 447.78a ± 6.36 | 34.68 ± 0.57 | 23.97 ± 0.08 | 3.31 ± 0.03 | ||
| WLsnp | 454.94a ± 4.96 | 40.38 ± 0.91 | 35.11 ± 0.12 | 5.42 ± 0.24 | ||
| YM15 | CK | 463.52a ± 12.39 | 38.28 ± 0.46 | 41.19 ± 0.18 | 7.20 ± 0.04 | |
| WL | 447.78a ± 11.71 | 35.35 ± 0.08 | 28.06 ± 0.03 | 4.37 ± 0.02 | ||
| WLsnp | 454.94a ± 9.91 | 40.64 ± 0.51 | 36.21 ± 0.03 | 5.79 ± 0.03 | ||
| LSD(0.05) | 27.88 | 2.27 | 1.00 | 0.09 | ||
| 2022 ~ 2023 | YM24 | CK | 447.78 ± 5.16 | 45.50 ± 1.26 | 45.21 ± 0.04 | 6.91 ± 0.06 |
| WL | 430.62 ± 5.16 | 34.69 ± 0.58 | 22.26 ± 0.06 | 3.45 ± 0.12 | ||
| WLsnp | 437.77 ± 11.36 | 40.95 ± 0.43 | 38.27 ± 0.07 | 5.31 ± 0.05 | ||
| YM15 | CK | 454.94 ± 6.56 | 44.28 ± 0.25 | 46.60 ± 0.11 | 7.31 ± 0.12 | |
| WL | 442.06 ± 6.56 | 36.32 ± 0.20 | 26.29 ± 0.03 | 4.49 ± 0.06 | ||
| WLsnp | 447.78 ± 5.18 | 40.64 ± 0.15 | 38.79 ± 0.04 | 5.56 ± 0.02 | ||
| LSD(0.05) | 21.6 | 1.87 | 0.20 | 0.02 | ||
| ANOVA | ||||||
| C | 1.50 ns | 6.96* | 67.94*** | 16.14** | ||
| W | 2.97 ns | 150.31*** | 666.71**** | 184.44*** | ||
| Y | 5.51* | 10.51** | 21.67** | 0.64 ns | ||
| C × W | 0.01 ns | 17.47** | 119.64*** | 4.29* | ||
| C × Y | 0.67 ns | 7.47* | 41.65*** | 0.59 ns | ||
| W × Y | 0.03 ns | 5.07* | 190.87*** | 0.08 ns | ||
| C × W × Y | 0.11 ns | 6.51* | 14.69** | 0.34 ns |
- C, W, and Y represent cultivar, water treatment, and study year, respectively. ns is non-significant difference. *, **, and *** indicate significant difference at 5, 1, and 0.1% probability level, respectively.
The pot experiment results showed a slight decline in the grain yield, 1000-kernel weight and kernels per spike between the WLsnp and CK treatments in both cultivars (Table 3). However, the parameters were significantly decreased in the WL treatment when compared to the CK and WLsnp treatments in both cultivars (Table 3; P < 0.05). There existed significant interaction effects between cultivar and water treatment for 1000-kernel weight and grain weight (Table 3; P < 0.05). Overall, the results from the field experiment and pot experiment consistently indicate that the WLsnp treatment can achieve higher yields when wheat plants experience waterlogging stress at the flowering stage. Comparisons performed following CK treatments indicated that cultivar YM15 exhibited a reduced decline in yield, grain weight and kernels per spike parameters compared to cultivar YM24 when wheat plants were subjected to waterlogging stress (Table 2; Table 3).
| Spikes | Kernels per spike | 1000-kernel weight | Yield | |
|---|---|---|---|---|
| (No.pot−1) | (No.) | (g) | (g pot−1) | |
| YM24 | ||||
| CK | 33.75 ± 1.15 | 40.12 ± 0.95 | 49.13 ± 1.22 | 55.32 ± 1.37 |
| WL | 33.83 ± 0.91 | 36.29 ± 2.13 | 15.89 ± 2.45 | 14.58 ± 2.32 |
| WLsnp | 34.29 ± 1.54 | 38.57 ± 1.44 | 46.19 ± 0.78 | 49.29 ± 1.95 |
| YM15 | ||||
| CK | 32.67 ± 0.43 | 43.17 ± 2.15 | 48.69 ± 0.69 | 56.83 ± 0.69 |
| WL | 31.17 ± 1.72 | 40.79 ± 1.74 | 42.29 ± 0.48 | 37.08 ± 1.97 |
| WLsnp | 32.43 ± 1.01 | 41.25 ± 1.33 | 47.27 ± 0.81 | 51.75 ± 0.71 |
| LSD (0.05) | 3.13 | 2.41 | 1.55 | 5.73 |
| ANOVA | ||||
| C | ns | ns | ** | * |
| W | ns | * | ** | *** |
| C × W | ns | ns | * | * |
- C and W represent cultivar and water treatment, respectively. ns is non-significant difference. *, **, and *** indicate significant difference at 5, 1, and 0.1% probability level, respectively..
3.2 Gas exchange parameters of field and pot experiments
In the field experiment, the CK treatment had the highest Pn, gs, Ci and Tr parameters, followed by the WLsnp and WL treatments across two observed periods and both cultivars (Figure S1; P < 0.05). For Pn parameter, there was no significant difference between the WLsnp and CK treatments for cultivar YM15 on the 8th day after flowering and for the cultivar YM24 on the 16th day after flowering, respectively (Figure S1A and E; P>0.05).
In general, the trends of photosynthesis data (Pn, gs, and Ci) in the pot experiment were basically the same as in the field experiment among treatments and cultivars. In the pot experiment, the WL treatment exhibited the lowest Pn, gs, gm and Cc values compared to the other treatments in both cultivars and at both observed stages (Figure 2; P < 0.05). On the 8th day of waterlogging, Pn, gs and gm were significantly lower in the WLsnp treatment than in the CK treatment for cultivar YM24 (Figure 2A, C, and D). For cultivar YM15, there was no significant difference between the WLsnp and CK treatment for the Pn, gs, gm and Cc parameters on the 8th day of waterlogging (Figure 2A, C and D; P > 0.05).
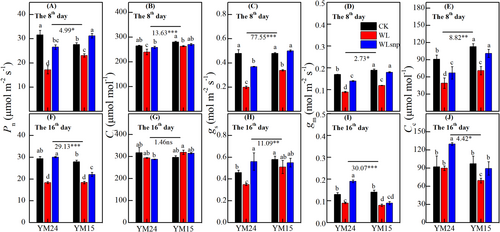
On the 16th day after flowering (the 8th day after drainage), the WLsnp treatment demonstrated significantly lower Pn, gs, gm and Cc values compared to the CK treatment in cultivar YM15 (Figure 2F, H ~ J). However, the gs, gm and Cc were significantly higher in the WLsnp than in the CK treatment for cultivar YM24 (Figure 2H~J). Lastly, the WLsnp treatment demonstrated a slightly higher Pn than the CK treatment for cultivar YM24 on the 16th day after flowering (Figure 2F; but P > 0.05). Overall, cultivar YM15 had significantly higher Pn, gs, gm and Cc than cultivar YM24 on the 8th day (Figure 2A, C ~ E). However, on the 16th day, cultivar YM15 demonstrated significantly lower Pn, gs, gm and Cc than cultivar YM24 (Figure 2F, H ~ J).
3.3 Response of photosynthetic rate to PAR and CO2 in the pot experiment
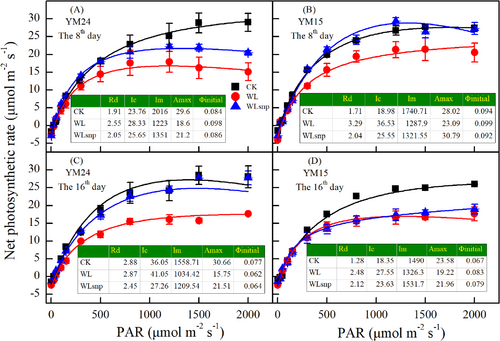
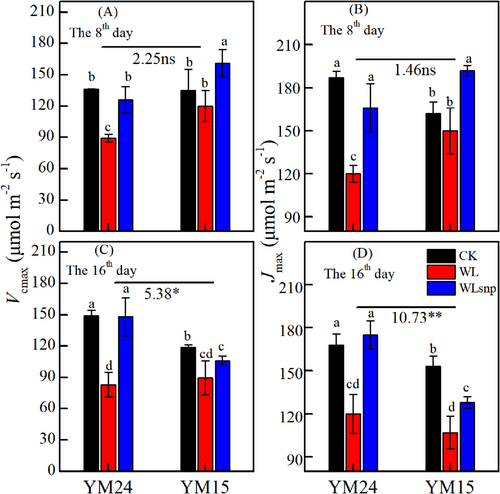
In general, the WLsnp demonstrated a significantly higher Amax based on Pn-PAR and Pn-CO2 curves, higher light saturation point and CO2 saturation point, greater Vcmax and Jmax than the WL treatment in both cultivars at both observed periods (Figure 3; Figure 4; Figure S2). For cultivar YM15, the WLsnp had slightly higher Amax, Vcmax and Jmax parameters compared with the CK treatment on the 8th day (Figure 3B; Figure 4A and B). However, on the 16th day, the WLsnp showed higher Amax, Vcmax and Jmax parameters compared with the CK treatment for cultivar YM24 (Figure 3C; Figure 4C and D).
3.4 PSII quantum efficiencies, qP, and NPQ in the pot experiment
The WL treatment exhibited the significantly lowest Fv/Fm, Fv’/Fm′, qP and J among treatments across both cultivars and the two observed stages (Figure 5A~C, E, F ~ H, J; P < 0.05). However, NPQ was the highest in the WL treatment among the different treatments for both cultivars at the two measured periods (Figure 5D and I). Compared with the WL treatment, WLsnp consistently demonstrated significantly higher Fv/Fm, Fv’/Fm′, qP and J in the two cultivars on the 8th day (Figure 5A~C, E), and higher Fv/Fm, Fv’/Fm′, qP and J in YM24 on the 16th day (Figure 5F~H, J).

Cultivar YM15 had higher Fv/Fm, Fv’/Fm′, qP and J, and lower NPQ in the WLsnp treatment than in the CK treatment, while a similar trend could not be observed between the WLsnp and CK treatments for cultivar YM24 on the 8th day(Figure 5A~E). In contrast, cultivar YM24 had higher Fv/Fm, Fv’/Fm′ and J, and lower NPQ in the WLsnp treatment than in the CK treatment on the 16th day (Figure 5F, G, I, and J). In addition, cultivar YM15 demonstrated significantly higher Fv/Fm, Fv’/Fm′, and J than cultivar YM24 on the 8th day (Figure 5A, B and E; P < 0.05). Meanwhile, NPQ in cultivar YM15 was significantly lower than that n cultivar YM24 on the 8th day (Figure 5D; P < 0.05).
3.5 Excitation energy distribution in PSII of pot experiment
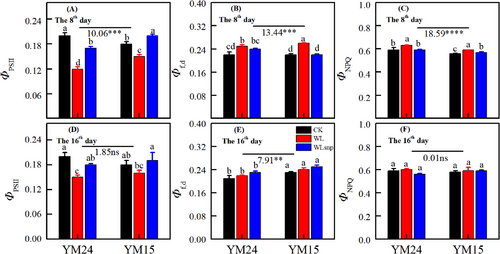
The WL treatment was associated with the lowest ΦPSII values and the highest Φf,d and ΦNPQ parameters among all treatments across both cultivars and the two observed periods (Figure 6). Specifically, the WLsnp treatment showed a significantly higher ΦPSII than the WL treatment in both cultivars and in both measured periods (Figure 6A and D; P < 0.05). The ΦPSII in the WLsnp treatment was even higher than that in the CK treatment for cultivar YM15 on the 8th day and for the cultivar YM24 on the 16th day (Figure 6A and D). However, no significant differences were observed for Φf,d between the WLsnp and CK treatments at both measured stages (Figure 6B and E; P > 0.05).
3.6 The effects of Pn on 1000-kernel weight and yield
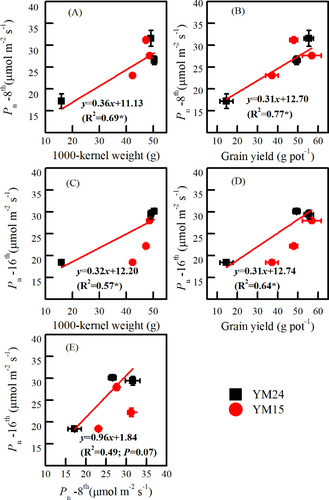
The Pn measured on the 8th and 16th day consistently showed positive linear relationships with both 1000-kernel weight and grain yield (Figure 7A~D; P < 0.05). The determination coefficient (R2) was higher for the fitted equation between Pn and grain yield than the fitted equation between Pn and 1000-kernel weight at both observed periods (Figure 7A~D). In addition, the R2 of fitted equations on the 8th day was greater than that on the 16th day (Figure 7A~D). Moreover, the Pn on the 8th day showed a positive association with the Pn on the 16th day (Figure 7E).
3.7 The effects of gs, gm, and PSII performance on Pn
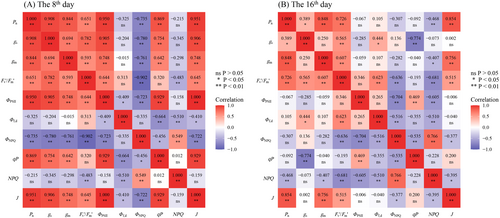
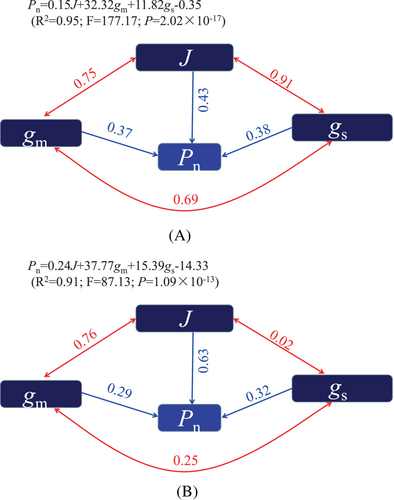
On the 8th day after flowering, Pn showed significant positive correlations with gs, gm, Fv’/Fm′, ΦPSII, qP and J parameters (Figure 8A; P < 0.01). Additionally, ΦNPQ and Φf,d were significantly and negatively correlated with Pn on the 8th day after flowering (Figure 8A; P < 0.01). The J, gs and gm parameters were identified as the main factors regulating Pn on the 8th day after flowering (Figure 9A; Figure 10), and the mathematical expression representing their relationship was established by stepwise regression analysis using the equation: Pn = 0.15 J + 32.32gm + 11.82gs-0.35 (R2 = 0.95; P = 2.02 × 10⁻¹⁷). Similarly, on the 16th day after flowering, Pn exhibited significant positive correlations with gs, gm, Fv’/Fm′ and J (Figure 8B; P < 0.05). Conversely, ΦNPQ and NPQ showed significant negative correlations with Pn on the 16th day after flowering (Figure 8B; P < 0.05). Further, J, gm and gs were also identified as the main factors influencing Pn on the 16th day after flowering (Figure 9B; Figure 10).
4 DISCUSSION
4.1 The effects of exogenous NO on photosynthetic potential and yield formation of waterlogged wheat
Waterlogging at the flowering stage had significant negative effects on the 1000-kernel weight and grain yield in both cultivars, as observed in the field and pot experiments (Table 2; Table 3). The findings align with previous research that indicates poor kernel-filling traits and reduced yield under waterlogging stress during flowering (Ding et al., 2020; Koramutla et al., 2022). However, the application of NO significantly improved the photosynthetic potential and grain yield of waterlogged wheat plants, as evidenced in both experiments (Table 2; Table 3; Figure 2A and F; Figure 3; Figure S1A and E). Similar findings have also been reported in cotton (Zhang et al., 2021a) and soybean (Jovelina et al., 2021) plants in recent years.
The high photosynthetic capacities on the 8th and the 16th day in NO treatment ensured abundant sugar supply from the leaf to roots to provide metabolic substrate for anaerobic respiration and produce more ATP to maintain root growth in waterlogging (Hossain and Uddin, 2011; Kai et al., 2022). Moreover, the exogenous application of NO positively promotes plant endogenic NO formation by enhancing nitrate assimilation/reduction pathways in root organs (Li et al., 2021). Endogenic NO positively regulates aerenchyma formation in root organs (Aakanksha et al., 2017) and can effectively alleviate the damage of anaerobic respiration on plants and maintain high growth vigour, including high root metabolic abilities (Li et al., 2021) and high photosynthetic production of the leaf organ (Ploschuk et al., 2023; Figures 2A,F, 3, S1A,E). These findings suggest that the improved waterlogging tolerance capacities in the NO treatment are closely associated with enhanced physiological activities, particularly high photosynthetic performance in waterlogged wheat plants.
In general, photosynthesis in wheat plants can recover within a few days after the removal of stress factors such as drought and flooding (Dessislava et al., 2022; Ru et al., 2023). However, in this study, the photosynthetic performance did not fully recover on the 16th day for all water treatments and cultivars compared to the 8th day (Figures 2, 3, S1). This incomplete recovery of photosynthetic potential might be caused by leaf senescence after flowering, especially for the waterlogged wheat plants (Hossain et al., 2011; Ma et al., 2022b). In addition, cultivar YM15 showed a smaller decrease in photosynthetic performance on the 8th day after flowering, 1000-kernel weight and yield in the WL treatment compared to cultivar YM24 when compared with their respective CK treatments (Figures 2A, S1A; Tables 2, 3). These results indicate that high waterlogging tolerance capacities of wheat plants could be mainly related to high photosynthetic performance during waterlogging periods instead of de-waterlogging periods because of the little difference in photosynthetic performance on the 16th day (middle grain filling; de-waterlogging periods) in the WL treatment between the two cultivars (Figure 2F; Figure 3C and D; Figure S1E). This deduction can be supported by two perspectives. Firstly, the reduced photosynthetic production during early grain filling (8 days after flowering) directly leads to a decline in grain weight and yield in cultivar YM24 due to inadequate photosynthate supply compared with cultivar YM15. Secondly, although the photosynthetic production capacity and photosynthate supply capacity may partially recover after the removal of waterlogging (Figure 2F; Figure S1E), the improved photosynthate supply to compensate for grain filling could be limited due to the shortening of the grain filling duration in the middle and late stages caused by an increase in atmospheric temperature, which may indirectly decrease grain weight and yield (Zhang et al., 2022b). Lastly, the photosynthetic rate on the 8th day after flowering showed a higher relationship with grain weight and yield than that on the 16th day after flowering (Figure 7A~D). More importantly, high grain weight and yield in spraying NO treatment were also mainly related to the high photosynthetic rate on the 8th day when wheat plants were waterlogged at the flowering stage (Figure 2A; Figure S1A; Table 2; Table 3). These results further confirm that high photosynthetic performance during waterlogging can be considered a potential indicator for evaluating the high-yield and high-waterlogging tolerant capacities of wheat plants.
4.2 The main factors regulating Pn of waterlogged wheat in spraying NO treatment
The diffusion of carbon dioxide from the leaf surface to the carboxylation site in the chloroplast stroma involves the passage through stomata and mesophyll cells in plants (Xiong et al., 2017). Theoretically, stomata resistance (gs), mesophyll cell resistance (gm) and carbon fixation rate are known to influence the photosynthetic rate of plants under stress conditions (Lauteri et al., 2014; Ouyang et al., 2017). Waterlogging can significantly reduce the CO2 concentration at the carboxylation site (Cc) along with decreased gs and gm compared to the CK treatment at both observed stages (Figure 2C~E and H ~ J). On the 8th day, the intercellular CO2 concentration (Ci) decreased with the decrease of gs during waterlogging in both cultivars in field and pot experiments (Figure 2B and C; Figure S1B and C). Meanwhile, Ci tended to increase on the 16th day compared with the CK treatment in both cultivars in the field experiment and for cultivar YM15 in the pot experiment (Figure 2G and H; Figure S1F and G). These results indicate that during waterlogging, the diffusion of carbon dioxide is constrained by stomatal and mesophyll cell factors, restricting the photosynthetic rate. After drainage, the regulation of the photosynthetic rate in waterlogged wheat is primarily attributed to the mesophyll cell factor, as suggested by classical analysis of stomatal limiting factors (Jones, 1985; Flexas and Medrano, 2002).
Interestingly, the WLsnp treatment showed higher gs during waterlogging compared to WL treatments across both cultivars and observed periods (Figure 2C and H; Figure S1C and G), which can be attributed to the positive contribution of NO in improving stomatal aperture in plants (van Meeteren et al., 2020). Additionally, the gm in the WLsnp treatment was higher than in the WL treatment for both cultivars (Figure 2D and I) because there was a positive relationship between gs and gm parameters under abiotic stress (Ouyang et al., 2017; He et al., 2021; Figure 8). Meanwhile, these results suggest that NO can directly enhance the diffusion of CO2 from the atmosphere to the carboxylation site in waterlogged wheat plants. The regulation of CO2 diffusion capacities involves various factors, including stomatal morphological characteristics, cell wall thickness, cell wall porosity, surface area of chloroplasts exposed to intercellular air spaces per unit mesophyll cell area, aquaporins, and carbonic anhydrase (Xiong et al., 2017; Ellsworth et al., 2018). However, the specific mechanisms by which NO improves CO2 diffusion capacities in waterlogging conditions require further study.
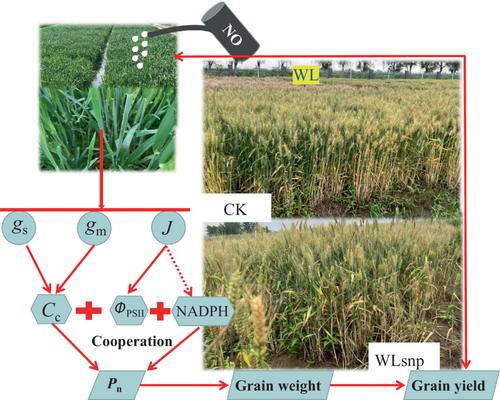
Furthermore, under severe stress conditions, the biochemical processes of the tricarboxylic acid cycle become the main limiting factors for the photosynthetic rate (Flexas and Medrano, 2002; Lauteri et al., 2014). Our results support the conclusion that Pn decreased with decreasing Vcmax and Jmax during waterlogging (Figure 4A and B). Even after waterlogging was relieved, Vcmax and Jmax remained lower in the WL treatment than the CK treatment (Figure 4C and D), which could be attributed to early senescence in the WL treatment, as senescence can directly decrease Vcmax and Jmax in stressed plants (Zhang et al., 2021b). The rate of electron transport J is directly proportional to ΦPSII. A high J in WLsnp in YM15 (Figure 5E) was accompanied by a high ΦPSII (Figure 6A) and low non-photochemical quenching such as Φf,d (Figure 6B) and ΦNPQ (Figure 6C) compared with WL treatment. This is to be expected since ΦPSII + Φf,d + ΦNPQ = 1. Interestingly, ΦPSII was the lowest in the WL treatment among the treatments of both cultivars at both observed periods (Figure 6 A and D). It is noted that both qP (Figure 5 C and H) and Fv'/Fm′ (Figure 5 B and G) were decreased during water logging relative to the CK. Since ΦPSII = qP × Fv'/Fm′, the decrease in ΦPSII was due to decreases in both the overall oxidation state of the primary quinone acceptor (qP) and the photochemical efficiency of open PSII centres (Fv'/Fm′). The ability to maintain a high J has advantages. First, high J has a protective effect on the photosynthetic apparatus by mitigating damage due to excitation energy, as a larger portion of the excitation energy is utilized in photochemistry in stressed plants (Zivcak et al., 2013; Figure 5D and I). Second, treatments that lead to a high J promoted the flow of photosynthetic electrons towards photochemistry with high efficiency (Figure 5A, B, E, F, G, and J; Figure 6A and D), leading to increased participation of photosynthetic electrons in Rubisco carboxylation and subsequent enhancement of Pn (Krall and Edward, 1992). These results indicate that J may serve as a representative index for biochemical processes that regulate Pn in waterlogged wheat plants, which are supported by previous studies indicating that high J should be maintained to obtain high Pn in drought rice and cotton plants (He et al., 2014; Yi et al., 2016).
All the above results further suggest that gs, gm and J would be key factors regulating the Pn of waterlogged wheat plants. Correlation analysis and path analysis results in this study also supported the inference that gs, gm and J positively and linearly affected Pn with a determination coefficient above 0.91 for waterlogged wheat plants, especially during the waterlogging stage (Figure 8; Figure 9). Therefore, high photosynthetic potential facilitated by the spraying NO treatment is due to the improved gs, gm and J parameters of waterlogged wheat plants. A high Cc should be maintained by improving gs and gm during waterlogging (Figure 10). In addition, the high J not only improves the photochemical efficiency of waterlogged wheat plants (Figure 6A and D; Figure 10), but also improves the redox-active potential of the electron acceptor side, thus leading to high chemical energy such as NADPH and ATP (Chow and Hope, 2004). The abundance of photosynthetic substrates (CO2 and chemical energy) ensured a high photosynthetic rate and, ultimately, a high grain weight and yield when exogenous NO was applied to waterlogged wheat plants (Figure 10).
5 CONCLUSIONS
- Waterlogging at flowering reduces the yield and 1000-kernel weight of wheat plants due to decreased photosynthetic performance (Pn, gs, gm, Vcmax, J and photochemical efficiencies of PSII). The photosynthetic rate during waterlogging plays a greater role in determining yield and 1000-kernel weight than the photosynthetic rate after drainage when wheat plants experience waterlogging stress at flowering.
- During waterlogging, both stomatal and non-stomatal factors restrict the photosynthetic rate in waterlogged wheat plants. However, after drainage, non-stomatal factors become the main reason for the decline in photosynthetic rate. The key physiological indicators synergistically regulating photosynthetic rate in waterlogging for wheat plants are gs, gm and J.
- Exogenous application of NO can effectively maintain high yield and 1000-kernel weight of wheat plants, particularly in cultivar YM15. NO improves waterlogging tolerance by enhancing photosynthetic potential during waterlogging and promoting the benefits of de-waterlogging through increased gs, great gm and J.
- The higher waterlogging tolerance of cultivar YM15 is primarily attributed to its higher photosynthetic performance during waterlogging compared to cultivar YM24. Collectively, our research may help guide the selection of waterlogging-tolerant wheat varieties based on the key candidate photosynthetic performance indexes. Additionally, these findings suggest potential research directions for further elucidating the molecular mechanisms through which NO enhances the waterlogging tolerance of wheat plants, particularly with a focus on photosynthetic potential.
AUTHOR CONTRIBUTIONS
Conceived and designed the experiments: Zhenglai Huang, Ru Yang. Performed the experiments: Ru Yang, Wenjun Yang, Tianyu Qian. Analyzed the data: Haibing He, Ru Yang, Jun Ou, Kou Zhang, Xiangshuo Zhang. Contributed reagents/materials/analysis tools: Wenjing Zhang, Shangyu Ma, Yonghui Fan, Wenjing Ding. Wrote the manuscript: Ru Yang. Corrected the manuscript: Zhenglai Huang.
ACKNOWLEDGMENTS
We gratefully acknowledge Pro. Wah Soon CHOW and two anonymous reviewers for their critical comments and suggestions on the manuscript. This work was supported by the National Key Research and Development Program of China (2023YFD2300200; 2022YFD2301404).
CONFLICT OF INTEREST STATEMENT
The authors declare that they have no known competing financial interests or personal relationships that could have appeared to influence the work reported in this paper.
Open Research
DATA AVAILABILITY STATEMENT
The datasets analysed during the current study are available from the corresponding author on request.


