Ascorbate-glutathione cycle alleviates low-temperature-induced oxidative stress for augmented growth of Nannochloropsis oceanica Rose Bengal mutants
Abstract
Studying the adaptive mechanisms of algae to abiotic stresses, such as low temperature and high light intensities, can help facilitate large-scale outdoor production. Consequently, the role played by the antioxidant defense system in the tolerance of Nannochloropsis oceanica Rose Bengal (RB) mutants, with a truncated PSII complex, to low-temperature (LT, 18°C) under high-light (HL, 250 μmol⋅m−2⋅s−1) conditions was explored. The wild type (WT) exhibited O2•- and H2O2 accumulation, lipid peroxidation, and cell death upon LT treatment, which was exacerbated by LT-HL. The RB mutants showed no oxidative stress during LT or LT-HL. Ascorbate peroxidase (APX; EC 1.11.1.11), dehydroascorbate reductase (DHAR; EC 1.8.5.1), and glutathione reductase (GR; E.C. 1.6.4.2) activity and transcript abundance increased by LT and LT-HL conditions in the RB mutants but not in the WT. In the RB mutants, the ascorbate (AsA) pool size stayed low, but the AsA/DHA ratio increased under LT and LT-HT conditions, while the glutathione (GSH) pool size and GSH/GSSG ratio increased. The RB mutants treated with buthionine sulfoximine (BSO), an inhibitor of GSH biosynthesis, became susceptible to LT-HL stress. The expression of GLUTAMYLCYSTEINE SYNTHETASE (NoGSH1) and GLUTATHIONE SYNTHASE (NoGSH2A and NoGSH2B), responsible for GSH biosynthesis, was upregulated in two RB mutants by LT and LT-HL stress, while that of GULONOLACTONE OXIDASE (NoGulo), involved in AsA biosynthesis, remained constant. Beyond reduced light energy absorption, increased the Ascorbate-Glutathione cycle enzyme expression and AsA and GSH regeneration in Nannochloropsis RB mutants enable adaptations to prevent oxidative damage caused by high-intensity illumination at low temperatures.
1 INTRODUCTION
Nannochloropsis, a genus of marine microalgae belonging to Eustigmatophyceae (Hibberd, 1981), are commercially important since they can synthesize omega-3 LC-PUFA eicosapentaenoic acid (EPA) under nitrogen-replete cultivation (Meng et al., 2015). Nannochloropsis/Microchloris microalgae are potent storage lipid producers due to their high biomass and triacylglycerol (TAG) productivity under nitrogen-depleted conditions (Rodolfi et al., 2009; Simionato et al., 2013). Previous studies, particularly those on EPA production, have revealed that temperature is a key factor affecting both growth and fatty acid (FA) composition (Hoffmann et al., 2010; Wei et al., 2015; Sá et al., 2020). EPA contents tend to rise when temperatures are slightly below the optimal growth range (Sukenik, 1991; Willette et al., 2018; Aussant et al., 2018; Sá et al., 2020). This phenomenon can be attributed to the heightened activity of desaturases involved in polyunsaturated fatty acid (PUFA) synthesis (Harwood, 1998). However, lower temperatures have been observed to hamper Nannochloropsis growth (Ben-Sheleg et al., 2021; Hoffmann et al., 2010), resulting in decreased EPA productivity, in particular when combined with high light exposure that may reduce economic viability. Improving biomass and stress-resilience is imperative to counteract the adverse impact of low temperature (LT) on biomass production in Nannochloropsis (Carneiro et al., 2020) and enhance EPA yields.
Given that light serves as the primary energy source for driving photosynthetic electron transport to provide NADPH and ATP for carbon dioxide fixation, optimal Nannochloropsis growth is contingent on increased cell growth with increasing light intensity (Wahidin et al., 2013). Consequently, exposure to elevated light intensity represents a straightforward and convenient approach for enhancing both biomass and EPA productivity. Ben-Sheleg et al. (2021) employed Rose Bengal (RB) tolerant RB2 and RB 113 mutants of N. oceanica to elucidate their response to combined low-temperature (LT, 18°C) and high-light (HL, 250 μmol photons·m−2·s−1) stress. Their findings highlighted an adaptation involving modifying the photosystem II configuration to minimize light energy absorption and enhance non-photochemical quenching (NPQ). This alteration facilitates the dissipation of excited energy as heat, effectively preventing the generation of reactive oxygen species (ROS). The modulation of glycolipids of the plastidial envelope and thylakoid membranes to maintain the photosynthetic apparatus and function, along with enhanced PUFA production, particularly EPA, up to fourfold, was also critical for the RB mutants compared to the wild type (Ben-Sheleg et al., 2021). A proposed regulatory photoprotective machinery for N. oceanica IMET1 against HL damage, based on both proteomic and physiological dynamics, indicates that decreased light-harvesting antenna protein levels, increased oxidases, enhanced de-epoxidation ability of the xanthophyll cycle, increased antioxidant availability, and the re-localization of photosynthetic carbon into storage carbon in the form of TAG are the mechanisms underlying acclimation to high-light stress (Wang & Jia, 2020; Perin et al., 2023). A recent study has shown that the chlorophyll-carotenoid connection and zeaxanthin are essential for NPQ function and ROS scavenging in Nannochloropsis in response to strong illumination, and sufficient zeaxanthin accumulation plays a role in biomass productivity when light is limited under dense culture conditions (Park et al., 2019 L; Perin et al., 2023). Apparently, N. oceanica coordinates the regulation of refined and sophisticated mechanisms to counteract high-intensity illumination stress.
Light affects the growth and productivity of microalgal cells in habitats facing dynamic light availability and intensity, in which excess light retards growth and causes cell death (Vonshak & Novoplansky, 2008). When light energy greatly exceeds the capacity for dissipation, the components of photosynthetic electron transport become severely over-reduced and force a transfer of excess energy to O2, generating massive amounts of reactive oxygen species (ROS) (Asada, 1999). For example, singlet oxygen (1O2), superoxide (O2•-), and hydrogen peroxide (H2O2) are predominantly produced upon exposure to HL conditions (Halliwell & Gutteridge, 1989). If the scavenging capacity is far lower than the ROS production rate, cellular proteins, nucleic acids, and lipids are extensively oxidized by over-accumulated ROS, leading to severe physiological dysfunction and cell death at toxic levels (Asada, 2006).
To detoxify reactive oxygen species (ROS), a series of enzymes, including superoxide dismutase (SOD; EC 1.15.1.1), ascorbate peroxidase (APX; EC 1.11.1.11), monodehydroascorbate reductase (MDAR; EC 1.6.5.4), dehydroascorbate reductase (DHAR; EC 1.8.5.1), and glutathione reductase (GR; EC 1.6.4.2), play crucial roles (Asada, 1999; Mittler, 2002; Gill & Tuteja, 2010; Yousuf et al., 2011; Chang et al., 2013; Chang et al., 2017; Wakao & Niyogi. 2022). These enzymes collectively convert harmful ROS into less toxic substances. Studies on the model microalga Chlamydomonas reinhardtii have demonstrated that knockdown of APX4, DHAR1, GR1, and GR2 expression increases sensitivity to photooxidative stress, while overexpression of MDAR, DHAR, and GR enhances tolerance to high-intensity illumination (Lin et al., 2016; Lin et al., 2018; Yeh et al., 2019; Kuo et al., 2020). This highlights the crucial role of these enzymes, collectively known as AGC enzymes, in microalgae's adaptation to high-light (HL) stress. Ascorbate (AsA) and glutathione (GSH) are essential antioxidants responsible for scavenging ROS (Asada, 1999; Mittler, 2002; Sirikhachornkit & Niyogi, 2010). AsA also acts as a cofactor for enzymes involved in various cellular processes and plays a crucial regulatory role in growth, development, and stress tolerance in plants and algae (Smirnoff & Wheeler, 2000; Foyer & Noctor, 2011; Gallie, 2013a, b; Wakao & Niyogi, 2022). Moreover, GSH participates in the detoxification of xenobiotics and heavy metals (Grill et al., 2001; Noctor et al., 2012; Schröder, 2001; Yadav, 2010). The AsA and GSH redox systems, AsA/DHA and GSH/GSSG, respectively, play pivotal roles in regulating the protein function and gene expression associated with growth and development pathways in plants (Şahin & De Tullio, 2010; Han et al., 2013). Consequently, the strict regulation of the AsA (Smirnoff & Wheeler, 2000; Sirikhachornkit & Niyogi, 2010) and GSH (Hossain et al., 2017) levels and homeostasis is critical for plant growth and development and their adaptation to stresses.
The potent enzymes and antioxidants within the AGC system form a robust defense mechanism in microalgae. Nannochloropsis, a heterokont microalga known for its lipid-rich profile and biofuel potential, serves as an excellent research model. This study seeks to explore its antioxidant and photoprotective responses under challenging conditions, specifically addressing eicosapentaenoic acid (EPA) productivity under simultaneous exposure to suboptimal temperatures and intense light. The investigation focused on the enzyme activities and transcript levels of APX, DHAR, and GR, and key enzymes for AsA and GSH biosynthesis, along with the sizes and redox states of the AsA and GSH pools, represented by the AsA/DHA and GSH/GSSG ratios, under low-temperature (LT, 18°C) conditions illuminated with high light (HL, 250 μmol photons·m−2·s−1), using 50 μmol photons·m−2·s−1 (normal light, NL) as the control. The findings reveal that the AGC system plays a crucial role in enhancing the resilience of Nannochloropsis RB2 and RB113 mutants against oxidative damage induced by HL under LT conditions. Interestingly, these mutants exhibit distinct regulatory patterns in response to LT or combined LT-HL stress.
2 MATERIALS AND METHODS
2.1 Algal culture and treatment
The Nannochloropsis oceanica wild-type (WT) strain CCALA 804 (Pal et al., 2013) and RB2 and RB113 mutants (Ben-Sheleg et al., 2019) were obtained from the Microalgal Biotechnology Laboratory, J. Blaustein Institutes for Desert Research, Ben-Gurion University of the Negev, Sede Boqer Campus). The cells were photoautotrophically cultured in a reef salt (RSE) medium consisting of 34 g⋅L−1 salt (Seachem™) supplemented with nutrients as described earlier (Ben-Sheleg et al. 2019, 2021). Cells were cultivated in 500-mL serum bottles, each containing 300 mL of the RSE medium. They were aerated with ambient air for six days, followed by a one-day 2% CO2 purge with a constant aeration rate of 0.5 vvm (volume per volume per minute). The cultures were agitated at 200 rpm on an orbital shaking incubator (model OS701, TKS Company) at 25°C, under 24-hour illumination at 50 μmol photons∙m−2∙s−1 (NL) using cool white LED light.
When the cell density reached 6–9 × 10⁶ cells per mL, cells were harvested by centrifugation at 4,000 × g for 5 min at 25°C, and the pellet was resuspended in fresh RES medium to achieve a cell density of 3 × 10⁶ cells per mL. Subsequently, the algal cells were transferred to 100-mL PBR tubes placed in a water bath within a multi-cultivator (MC1000-OD, Photon Systems Instruments) growth chamber. The growth chamber was aerated with 2% CO2 at a rate of 0.5 vvm, while the water bath was maintained at a constant temperature of 18°C. The algal cultures were exposed to cool white LED light at the specified intensities of 50 μmol photons∙m−2∙s−1 (NL) and 250 μmol photons∙m−2∙s−1 (HL). Then, after 1 and 2.5 days, cells were collected by centrifugation at 12,000 × g for 10 min at 4°C, then fixed in liquid nitrogen, and stored at -80°C for further analysis.
To test the requirement of GSH for the tolerance of the RB mutant strains to HL stress, buthionine sulfoximine (BSO; a GSH biosynthetic inhibitor) was applied at the concentration of 1 mM under HL condition for 2.5 days using PBR containing a 40-mL cell culture at a cell density of 3 × 10⁶ cells⋅mL−1. The survival rate, O2•- and H2O2 production, and lipid peroxidation were determined. The recovery ability of the BSO-treated cells was assessed by a transfer of the cells to the BSO-free medium for another 7 days.
Each treatment was performed in three independent biological triplicates with each PBR tube or each well as a replicate.
2.2 Determination of O2•- and H2O2 production
O2•- and H2O2 production was assayed through the in vivo staining of algal cells with 3,3′-diaminobenzidine (DAB; Sigma)–HCl and nitroblue tetrazolium (NBT; Sigma), respectively (Förster et al., 2005). Before staining, the 10-mL cell culture was centrifuged at 2,500 × g for 3 min at room temperature (Centrifuge 5810R, Eppendorf AG) using a swinging-bucket rotor (F-34-6-38, Eppendorf AG). The pellet was resuspended in the RSE medium containing 5 mM DAB or 0.5 mM NBT for another 10-min incubation at 18°C under NL or HL conditions. Then, the cells were filtered through glass microfiber filters (diameter 45 mm, GF/C, Whatman, GE). The filter discs were washed twice with 100% methanol to completely remove the pigments. After drying, the filters were scanned as digital images, and the intensities were estimated using ImageJ software (http://rsbweb.nih.gov/ij/index.html).
2.3 Determination of thiobarbituric acid reacting substance (TBARS)
Five mL of algal culture was collected and centrifuged at 4,000 × g for 5 min. The resulting pellet was immediately frozen in liquid nitrogen and then mixed vigorously with 0.5 mL of 5% (w/v) trichloroacetic acid (TCA). This mixture underwent three freeze–thaw cycles (liquid nitrogen and 25°C) and was subsequently centrifuged at 12,000 × g for 10 min at 4°C. The collected supernatant was used to determine lipid peroxidation, quantified as TBARS content according to the method of Lin et al. (2016). TBARS content was calculated based on the difference between absorbance at 532 nm and 600 nm, using an extinction coefficient of 155 mM−1∙cm−1, and expressed as pmol 10−6 cells.
2.4 Survival assessment
An Evans blue survival assessment was performed according to the method of Yeh et al. (2019). The equal volumes of algal culture and 0.1% (w/v) Evans blue dye in water were mixed and left undisturbed in a 1.5-mL vial for 5 min. Subsequently, a sample of this mixture was transferred to a hemocytometer for microscopic counting. Over 200 individual cells were examined under the microscope to ascertain whether they absorbed the blue dye. The percentage of cells retaining their original green color was calculated as the proxy for culture's survival percentage.
2.5 Determination of enzyme activity
Five mL of algal culture was centrifuged at 4,000 × g to collect the algal cells for enzyme activity assay. APX activity was assayed according to Kuo et al. (2020) with some modifications. After extraction in 0.25 mL of 0.15 M NaH2PO4-Na2HPO4 (pH 7.5) buffer containing 5 mM AsA and centrifugation at 12,000 × g at 4°C for 10 min, the supernatant as enzyme extract was mixed with 0.15 M Na2HPO4/NaH2PO4 buffer (pH 7.5) containing 5 mM AsA, 0.75 mM Na2EDTA, 10 mM H2O2, and H2O in a total volume of 1 mL at 25°C. A 120-sec change in absorbance at 290 nm was detected to estimate activity with 2.8 mM−1·cm−1 as an extinction coefficient. For the assay of GR and DHAR activities, the pellet was extracted in 50 mM NaH2PO4-Na2HPO4 (pH 7.5) buffer by grinding, using a pestle and mortar, and centrifugation at 12,000 × g at 4°C for 10 min for collecting the supernatant as the enzyme extract. According to Lin et al. (2018), GR activity was determined by mixing 0.01 mL of enzyme extract with 0.35 mL of 0.15 M Na2HPO4/NaH2PO4 buffer (pH 7.5), 0.25 mL of 2 mM Na2EDTA, 0.05 mL of 30 mM MgCl2, 0.1 mL of 2.5 mM GSSG, 0.025 mL of 2 mM β-NADPH, and H2O in a total volume of 1 mL at 25°C for detection of 340 nm absorbance change over 120 sec. The activity was estimated by the decrease in 340 nm absorbance using an extinction coefficient of 6.22 mM−1∙cm−1. The DHAR activity assay involved a reaction mixture comprising 0.1 mL of enzyme extract, 0.25 mL of 200 mM phosphate buffer, 0.05 mL of 0.5 mM DHA (Sigma), 0.55 mL of H2O, and 0.05 mL of 50 mM GSH (Sigma). This mixture was analyzed at 265 nm at 25°C to calculate DHAR activity, utilizing the extinction coefficient of 14 mM−1⋅cm−1. The enzyme activity unit was expressed as μmol⋅min−1⋅mg−1 protein, and protein concentrations were quantified by the Coomassie Blue dye binding method (Bradford, 1976) using the concentrated dye purchased from BioRad (500–0006).
2.6 AsA and GSH analysis
Total AsA (AsA + DHA) and AsA concentrations were determined according to the method of Yeh et al. (2019). Total AsA concentrations were determined in a 1-mL mixture containing 200 μL TCA extract, 50 mM potassium phosphate buffer (pH 7.4), 3 mM EDTA, and 1 mM dithiothreitol (DTT). After incubation of the mixture at 25°C for 10 min, 100 μL of N-ethylmaleimide, 400 μL of 0.61 M TCA, 400 μL of 0.8 M orthophosphoric acid and 400 μL of α,α'-bipyridyl were added, followed by adding 200 μL of FeCl3 for another incubation at 40°C in a water bath for 1 h, and the absorbance was detected at 525 nm. The AsA concentration was determined using the same chemicals and procedure as described above, except DTT and N-ethylmaleimide were replaced with distilled water. Total AsA and AsA concentrations were estimated using the standard curve of 0–40 nmol⋅L−1 AsA and DHA concentrations were obtained by subtraction of AsA from total AsA. Total GSH (GSH + GSSG), GSH, and GSSG concentrations were analyzed after grinding of algal cells in 2.5% trichloroacetic acid (TCA) and 2.5% meta-phosphoric acid (MPA) and three frozen (liquid nitrogen)-thaw (25°C) cycles. The extract was centrifuged at 12,000 × g for 10 min at 4°C for collecting the supernatant. A volume of 38.7 μL of 1.25 M K2CO3 was added to 0.3 mL of TCA/MPA extract to adjust the pH to 7.0 and then centrifuged at 12,000 × g for 1 min at 4°C to collect the supernatant. Total GSH concentration was determined by mixing 0.1 mL of supernatant in the reaction mixture (0.5 mL of 200 mM K2HPO4/KH2PO4 buffer (pH 7.5), 0.1 mL of 50 mM Na2EDTA, 0.1 mL of 2 mM β-NADPH, 0.1 mL of 6 mM dithionitrobenzoic acid, and 0.1 mL of 0.5 unit⋅mL−1 glutathione reductase (Sigma-Aldrich) for measurement at 412 nm for 3 min at 25°C. After the removal of reduced GSH by adding 2 μL of 1 M 2-vinylpyridine and 0.01 mL of 2 M freshly prepared triethanolamine in 0.1 mL of supernatant and incubation at 25°C for 1 h, the GSSG concentrations were assayed according to the above reaction. A standard curve was prepared using 0–5 nmol GSSG. The GSH concentration was calculated by subtracting the GSSG concentration from the total GSH concentration.
2.7 RNA isolation, cDNA preparation, and real-time quantitative PCR assay
Algal cells were harvested from 50-mL aliquots of the algal cultures for total RNA extraction using the TriPure Isolation Reagent (Roche Applied Science) according to the manufacturer's instructions. The RNA integrity was checked via visual inspection of the 18S and 28S ribosomal RNAs following 1% agarose (MDBio Inc.) gel electrophoresis. The concentration of the RNA sample was adjusted to 2.95 μg total RNA μL−1 for DNase (TURBO DNA-freeTM Kit, Ambion Inc.) treatment for removal of residual DNA. Then, 1.5 μg of total RNA was used for cDNA preparation by amplifying using Oligo (dT)12–18 with the VersoTM cDNA Kit (Thermo Fisher Scientific Inc.) in a concentration of 30 ng⋅mL−1. The targeted genes obtained from the comprehensive multi-omics resource database Nannochloropsis Design and Synthesis (NanDeSyn; http://nandesyn.single-cell.cn/find/genes), encompassing genomic and transcriptomic data gathering together the available mRNA-seq and proteomics datasets, are used for the design of the primers using LightCycler Probe Design2 (Roche Applied Science) (Table S1). The real-time quantitative PCR was performed using the LightCycler 480 system (Roche Applied Science) using a PCR master mix (LightCycler 480 SYBR Green I Master Kit, Roche Applied Science). After optimization of real-time PCR conditions, a primer concentration of 6 μM and a cDNA template concentration of 60 ng·μL−1 were used for the detection of transcript levels in a total volume of 10 μL, containing 1× LightCycler 480 SYBR Green I Master Mix. The amplification program consisted of an initial denaturation at 95°C for 5 min, followed by 40 amplification cycles including annealing at 60°C for 10 s, elongation at 72°C for 5 sec, real-time fluorescence measurements, and finally, denaturation at 95°C for 15 sec. Dissociation curves were obtained after PCR, and the fluorescence was analyzed using the LightCycler 480 system. Software, including an auto CT (cycle threshold), was used to determine the threshold for each gene, and the 2−∆∆CT method (Livak & Schmittgen, 2001) was used to calculate CT values, in which the relative change in mRNA level was normalized to a reference gene (NoACTIN, NCBI: s00082.g3056), and the fold increase was estimated relative to the wild type control sample at 0 day of the treatment (the initial control).
2.8 Statistics
All experiments were repeated at least three times with three independent biological replicates for each experiment. Because similar results were obtained, the results for only one are shown in this paper. Statistical analyses were performed using SPSS (SPSS 15.0 for Windows Evaluation Version). Significant differences between sample means were analyzed using the Scheffé test post hoc analysis of variance of the control and treatment groups (p < 0.05).
3 RESULTS
3.1 Improved growth and avoidance of oxidative stress in RB mutants by LT or LT-HL stress
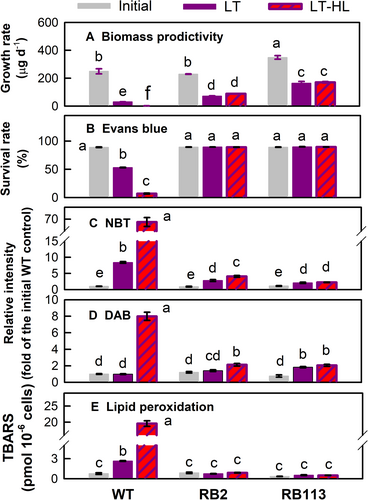
During the 2.5-day culture period, the growth rate of the WT strain was 9.8 μg⋅d−1 once exposed to LT exposure for 2.5 days and only 0.7 μg⋅d−1 upon LT-HL treatment (Figure 1A). Both LT and LT-HL treatments for 2.5 days induced a higher growth rate in the RB2 mutant (78.6 and 97.3 μg⋅d−1, respectively), while the RB113 mutant exhibited a higher growth rate, up to 192.6 and 196.7 μg⋅d−1, respectively (Figure 1A). The Evans blue assay of cell death indicated there was only 48.2% cells alive in the WT strain after LT treatment, which significantly dropped to 7.5% once it was exposed to the LT-HL treatment, while the RB2 and RB113 cells were 100% alive after the 2.5-day exposure to LT, as well as those exposed to LT-HL conditions (Figure 1B). For the WT strain exposed to LT for 2.5 days, the O2•- (Figure 1C), analyzed using NBT staining, increased 9.1-fold of the initial value at day 0, but H2O2 assessed by DAB staining remained unchanged, while a larger increase of O2•- (73.6-fold, Figure 1C) and H2O2 (9.1-fold, Figure 1D) was observed under the 2.5-day LT-HL treatment. The RB2 and RB113 mutants showed a small increase in O2•- (Figure 1C) and H2O2 (Figure 1D) production with 1.2 and 2.3-fold increments by the LT or LT-HL treatment. The evaluation of lipid peroxidation, as measured by the level of TBARS, demonstrated a substantial increase in the LT-treated WT strain. Moreover, the combination of the LT and HL treatments resulted in an even greater elevation of TBARS levels in the WT strain. In contrast, the RB2 and RB113 mutants exhibited consistent TBARS levels after 2.5 days of LT or LT-HL treatment compared to their initial levels under normal light (NL) conditions (Figure 1E). This suggests there was no oxidative damage for the RB mutants upon exposure to LT or combined LT-HL stress.
3.2 Increases in APX, DHAR, and GR activities and transcript abundances in RB mutants
The APX (Figure 2A) and GR (Figure 2B) activities of the WT strain remained unchanged after LT or LT-HL treatment. The APX (Figure 2A) and GR (Figure 2B) activities of the RB2 mutant were also not affected by LT treatment but showed a 3.8- and 2.3-fold increase by LT-HL treatment, respectively. The RB113 mutant strain exhibited a distinct pattern in APX and GR activities, in that its basal APX (Figure 2A) and GR (Figure 2B) activities under the 25°C condition under NL illumination (i.e., the initial control at day 0 of treatment) were higher than those of the WT strain and RB2 mutant. The APX activity of the RB113 mutant remained unchanged after LT exposure and showed a 2.7-fold increase after LT-HL treatment (Figure 2A), while the GR activity showed a 2.2-fold increase under LT treatment and a more significant induction up to 7.1-fold by LT-HL treatment (Figure 2B).
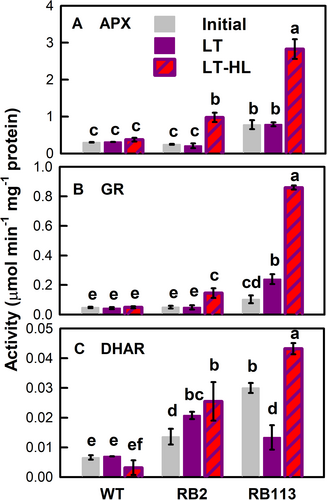
The DHAR activity of the WT strain was not affected by either the LT or LT-HL treatment (Figure 2C). Both RB2 and RB113 mutants showed a higher basal DHAR activity (the initial NT-NL control) than the WT strain and then displayed a further increase after the transfer to LT or LT-HL exposure for the RB2 mutant, while showing a decrease for the RB113 mutant after LT treatment and an increase by exposure to the combined LT-HL treatment (Figure 2C).
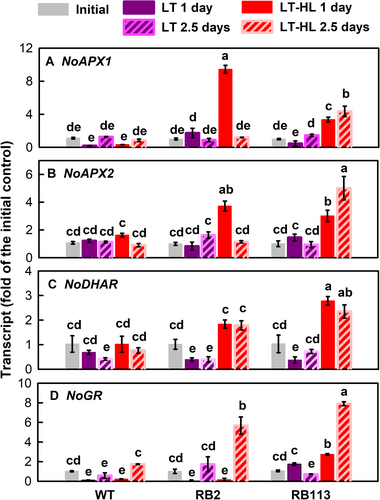
For the gene expression, the transcript abundance of both NoAPX1 (Figure 3A) and NoAPX2 (Figure 3B) in the WT strain remained unchanged 1 day after LT or LT-HL treatment, followed by a recovery to the level of the initial control after 2.5 days. In contrast, NoAPX1 and NoAPX2 transcript abundances of both RB2 and B113 mutants were not affected by LT but significantly increased in the LT-HL treatment. NoDHAR showed a decrease of transcript abundances in the WT strain after LT or LT- HL treatment, while its transcript abundances in both RB2 and RB113 mutants also decreased under LT treatment but showed a tremendous increase in the LT-HL treatment at 2.5 days, but not on day 1 (Figure 3C). One GR gene was discovered whose NoGR transcript abundances in the WT strain decreased under LT and LT-HL conditions and also slightly decreased in the RB mutants after LT treatment but markedly increased in the RB mutants after LT-HL treatment (Figure 3D).
3.3 Increased GSH biosynthesis and AsA and GSH recycling
AsA and GSH serve as substrates for APX and GR to facilitate the detoxification of H2O2 and support the DHAR-mediated recycling of DHA. Their dynamics in availability play a key role in the regulation of AGC for ROS scavenging. Therefore, the concentrations of AsA and GSH and their regeneration rate, i.e. the redox state, were determined.
AsA dynamics were different among the strains. The total AsA concentration of the WT strain was twofold higher than that of the RB mutants (Figure 4A). In the WT strain, exposure to LT or LT-HL treatment resulted in an increase in total AsA (Figure 4A) and reduced AsA (Figure 4B) concentrations. However, under LT conditions, DHA concentrations exhibited a minor increase, which contrasted with the decline observed under LT-HL conditions (Figure 4C), consequently leading to an elevation in the AsA/DHA ratio (Figure 4D). In the RB2 mutant, both total AsA (Figure 4A) and DHA (Figure 4C) concentrations remained constant under LT conditions and also under the LT-HL treatment. Conversely, the AsA concentration (Figure 4B) and the AsA/DHA ratio (Figure 4D) exhibited substantial increases under the LT treatment, with even more significant changes observed under the LT-HL treatment.
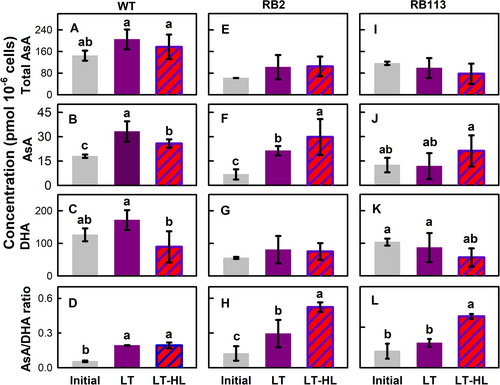
In contrast, the RB113 mutant strain displayed a different pattern. The total AsA concentration (Figure 4A) remained unaffected by the LT or LT-HL treatment, while AsA (Figure 4B) and DHA (Figure 4C) concentrations remained stable under LT conditions. However, the LT-HL treatment led to a slight increase in AsA concentration (Figure 4B) and a decrease in DHA concentration (Figure 4C), resulting in a significant increase in the AsA/DHA ratio (Figure 4D).
The dynamics of GSH and its oxidized product, GSSG, were differentially regulated among the strains. In the initial control, the total concentration of GSH (the sum of GSH and GSSG) remained consistent across all strains (Figure 5A). However, in comparison to the WT strain, the GSH concentration was lower, and the concentration of GSSG was higher in the WT strain compared to the RB mutants (Figure 5B and Figure 5C, respectively). Accordingly, the GSH/GSSG ratio was higher in the RB mutants (Figure 5D). When the WT strain was subjected to the LT treatment, both total GSH (Figure 5A) and reduced GSH (Figure 5B) concentrations remained stable, while GSSG concentration (Figure 5C) showed a slight increase. The GSH/GSSG ratio (Figure 5D) also exhibited a modest increment.
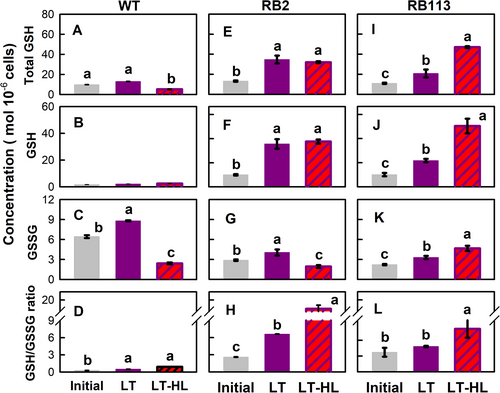
In contrast, exposure of the RB2 and RB113 mutants to LT or LT-HL conditions resulted in a significant increase in both total GSH pool (sum of GSH and GSSG; (Figure 5A) and the GSH (Figure 5B) concentrations. Furthermore, while a slight increase in GSSG concentration was observed in both RB mutants following LT treatment, GSSG levels decreased in the RB2 mutant but increased further in the RB113 mutant under LT-HL conditions (Figure 5C). Consequently, the GSH/GSSG ratio showed a remarkable increase in the RB-resistant mutants in response to LT and LT-HL conditions, whereas only a slight increment was observed in the WT strain (Figure 5D).
Whether increased GSH pool in the RB mutants resulted from the induction of biosynthesis was elucidated by determining the expression of the genes encoding the key enzymes responsible for their synthesis. The transcript abundances of two sequential GSH biosynthetic enzymes, GLUTAMYL–CYSTEINE LIGASE (NoGSH1; Figure 6A) and GLUTATHIONE SYNTHASE (NoGSH2A; Figure 6B), in the RB mutants increased under LT and LT-HL conditions, whereas those of the WT strain decreased. NoGSH2B transcript abundance in the RB mutants was not altered by LT exposure, while it increased under the LT-HL conditions (Figure 6C).
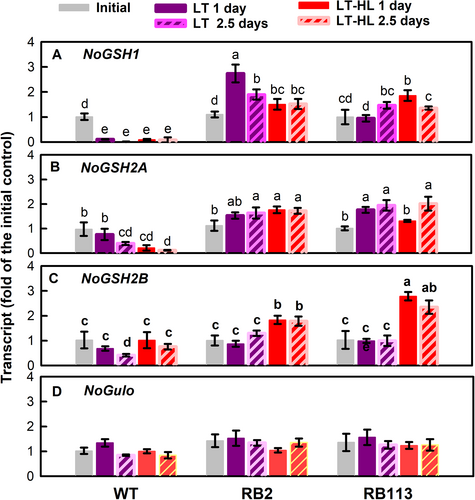
Differently, the key enzyme for the most common route (the L-galactose pathway or the Smirnoff-Wheeler pathway) of AsA biosynthesis, L-galactose phosphorylase encoded by the VTC2 gene (Linsteret al., 2007; Linster & Clarke, 2008; Urzica et al., 2012), was not found in the N. oceanica database (NanDeSyn; http://nandesyn.single-cell.cn/find/genes). Alternatively, two genes encoding a gulonolactone oxidase (NoGulo) that catalyze the final step enzyme of AsA biosynthesis in the animal pathway (Linster & Van Schaftingen, 2007) were found in the genome of N. oceanica (NO03G04710.1 and NO19G00920.1). NoGulo transcript abundance (NO03G04710.1) in both the WT and RB mutants was not affected by LT or LT-HL conditions (Figure 6D). The transcript of another NoGulo gene (NO19G00920.1) was not detected in the RNA samples from all strains (data not presented).
4 DISCUSSION
4.1 Enhanced antioxidant enzyme activity through differential regulation of gene expression combats low-temperature and high-light stress in RB mutants
The establishment of the AGC antioxidant systems represents one of the central strategies for the adaptation of both N. oceanica RB2 and RB113 mutants to prevent oxidative stress by scavenging the ROS generated under high-intensity illumination and suboptimal temperature conditions. As compared to the severe oxidative damage and cell mortality in the WT strain, the RB mutants still displayed a marked biomass production without oxidative stress under LT and LT-HL conditions (Figure 1). In addition to the reduction of light absorption and NPQ-mediated heat dissipation of excessive energy (Ben-Sheleg et al., 2019,2021), AGC also plays a role in the RB mutants' acclimation to excess light energy under an LT environment. In these mutants, APX, as the central AGC enzyme important for ROS scavenging, is responsible for H2O2 detoxification with the help of the AsA substrate, as an electron donor, against the oxidative stress generated by LT and LT-HL conditions. The current results demonstrate a significant increase of APX in H2O2 removal in the RB mutants following exposure to HL (Figure 2). The induction of APX caused by HL stress has been found in other algae (Erickson et al., 2015), such as Haematococcus pluvialis (Park et al., 2008), Dunaliella salina, Phormidium versicolor, Cylindrotheca closterium (Guermazi et al., 2023), and C. reinhardtii (Kuo et al., 2020; Yaisamlee & Sirikhachornkit, 2020). The oxidative stress triggered by exposure to 6 μM RB or 3 mM H2O2 also lead to increased APX activity in very high-light-tolerant C. reinhardtii mutants (Yaisamlee & Sirikhachornkit, 2020). Using the amiRNA-mediated knockdown of APX4 expression, the transformed C. reinhardtii with decreased APX activity becomes sensitive to HL stress (Kuo et al., 2020). Together with APX and GR, a higher DHAR activity and its further increase under combined LT-HL stress in the RB mutants (Figure 2) provided a sufficient mediator to drive the AGC that works against the suboptimal temperature-enhanced photooxidative damage.
The increase in AGC enzyme activities in the RB mutants can be reasonably attributed, at least in part, to gene expression, as evidenced by the concurrent changes in enzyme activity and transcription levels (Figures 2 and 3). Similar to the upregulation of APX gene expression in D. salina (Park et al., 2006) and C. reinhardtii (Kuo et al., 2020) in response to HL, the increase of APX activity in the RB mutants in response to LT-HL can be attributed to APX gene expression, reflected by the enhanced transcription of the NoAPX1 and NoAPX2 genes (Figure 3). It is important to emphasize that the APX gene expression exhibited distinct patterns in the two RB mutants. Specifically, in the RB2 mutant, the APX gene was induced on the first day, whereas it displayed a gradual increase over time in the RB113 mutant. Additionally, both RB mutants demonstrated elevated activities of DHAR and GR, along with increased transcript abundances of NoDHAR and NoGR, under the LT-HL conditions. Increases in APX, DHAR, and GR activities through the upregulation of transcription have been reported in microalgae exposed to HL stress (Park et al., 2006; Lin et al., 2016, 2018; Kuo et al., 2020). The precise mechanisms underlying the upregulation of NoAPX, NoDHAR, and NoGR gene expression in the RB mutants in response to combined LT-HL stress remain an area of ongoing investigation. One explanation for this gene expression induction may be linked to plastid-associated factors. In the context of Arabidopsis, it has been established that signals triggering GR gene expression, encoding the chloroplast-mitochondrial isoform, are influenced by the redox state of electron transport and ROS presence within the chloroplast (Garnik et al., 2016). Studies in various plant systems have demonstrated the existence of intricate signaling networks governing the regulation of antioxidant enzyme gene expression in response to excessive light energy (Mullineaux et al., 2000; Queval & Foyer, 2012; Yoshida et al., 2014). Further experiments are required to elucidate the specific role played by chloroplast-derived signals in modulating the gene expression of APX, DHAR, and GR in the RB mutants when they confront a combined LT and HL stress environment.
Other than transcriptional regulation, it is clear that factors beyond gene expression contribute to the control of AGC enzyme activity in the RB mutants when cultured under normal conditions. Notably, the RB113 mutant displayed higher basal activities of APX, DHAR, and GR compared to both the WT and the RB2 mutant despite similar transcript abundances across all strains (Figure 2). This observation suggests that the elevated enzyme activity in the RB113 mutant may be regulated at the post-transcriptional level, potentially through protein-level mechanisms.
The distinct temporal variation pattern in APX upregulation in the two mutant strains under LT-HL conditions (Figure 3) suggests that, while both exhibit increased APX expression, their regulatory mechanisms diverge. This indicates that the RB2 mutant may experience more pronounced oxidative stress, necessitating a swift increase in gene expression. Conversely, the RB113 mutant, owing to its elevated baseline APX enzyme activity, may possess an enhanced initial capacity to counteract oxidative stress and confront the early onset of reactive oxygen species production during stress. This also elucidates the distinct genetic variations between the two mutants, resulting in subsequent differences in antioxidant responses and other metabolic pathways.
4.2 RB mutants boost AsA and GSH regeneration and enlarge the GSH pool against oxidative stress
The connectivity of AsA and GSH and their availability is crucial for facilitating the operation of the AGC, specifically the Halliwell-Asada cycle or the water–water cycle, in the RB mutants. This cycle is essential for the removal of ROS generated under LT-HL conditions. It is evident from the concomitant enhancement of AsA and GSH recycling rates, along with an increase in the GSH pool size, that the AGC system contributes significantly to the RB mutants' defense against oxidative damage induced by LT-HL conditions. However, it is noteworthy that the AsA pool size remained unaltered in the RB mutants. Alternatively, in comparison to the WT strain, the RB mutants employed a strategy of enhancing AsA recycling rates rather than increasing the pool size to manage LT- or LT-HL-induced oxidative stress. This approach is effective in preventing the accumulation of DHA, a product of AsA oxidation that could lead to programmed cell death under oxidative stress.
AsA and GSH not only serve as reductants for APX-mediated H2O2 detoxification and DHA regeneration but also as key regulatory elements for various important functions. AsA regulates processes such as the gene expression associated with stress responses, adaptation, and various biosynthetic metabolisms, including its role as a cofactor in the regulation of violaxanthin de-epoxidase (VDE) activity in the non-photochemical quenching-associated xanthophyll cycle. Similarly, GSH, which participates in thiol-disulfide exchange, plays a role in modulating gene expression in response to changes in cellular or organelle redox states. It is also involved in post-translational modifications through glutathionylation of specific target proteins and enzymes involved in the Calvin cycle.
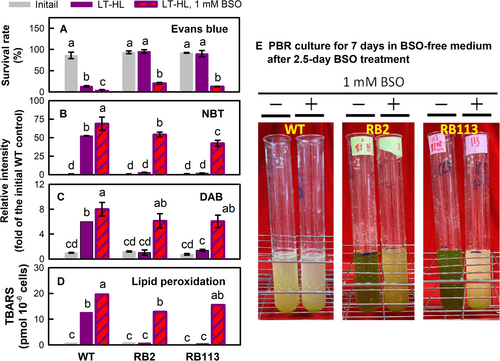
In addition to the correlative experiments, we conducted an experimental study (Figure 7) to demonstrate that GSH plays a role in the RB mutants' tolerance to HL-oxidative stress under LT conditions. This can be achieved by inhibiting GSH levels through suppressing its biosynthesis, and both growth and oxidative damage parameters were investigated. For this purpose, the RB mutants were treated by applying 1 mM BSO, an inhibitor of GSH biosynthesis, in the culture medium at the beginning of the LT-HL treatment for 2.5 days incubation. The survival rate (Figure 7A) significantly decreased, and the ROS production, O2•- (NBT, Figure 7B) and H2O2 (DAB, Figure 7C), and lipid peroxidation (Figure 7D) largely increased for the mutants treated with BSO under LT-HL conditions. Moreover, the capacity for recovery in the mutants treated with BSO after transferring BSO-treated cells to a BSO-free medium for an additional seven days seemed to be compromised. This was evident from the observed loss of recovery ability, as indicated by cellular bleaching (Figure 7E). This demonstrated that the RB mutants lacking a sufficient GSH supply became susceptible to LT-HL stress. The study revealed that inhibiting GSH biosynthesis by using BSO sensitized the RB mutants to HL treatment, indicating the involvement of GSH in regulating metabolic processes under reduced light energy utilization and electron generation.
Additionally, the regulation of GSH and AsA pool sizes in the RB mutants differed under LT and LT-HL conditions (Figures 4 and 5). The constant expression of the gene encoding the enzyme Gulo, primarily found in animals, in both the WT strain and RB mutants under LT and LT-HL conditions, is consistent with the unchanging AsA pool size. Conversely, the upregulation of genes encoding GSH synthesis in the RB mutants under LT and LT-HL conditions corresponds to the enhanced GSH pool size.
AsA- and GSH-mediated redox states serve as crucial redox signals for cellular physiological regulation. The AsA/DHA redox state acts as a reliable sensor for perceiving and integrating changes in external conditions, subsequently transducing these changes into chemical signals that regulate essential developmental processes. The GSH/GSSG system, primarily controlled by GR, plays a pivotal role in maintaining or increasing GSH in its reduced state and serves as a controller of various cellular metabolisms, including DNA synthesis and the metabolism of reduced sulfur.
These findings suggest that an increase in GR and DHAR activity is one of the mechanisms governing the alteration of the redox status of the GSH/GSSG and AsA/DHA pool sizes in the RB mutants following HL challenge. Furthermore, the strengthening of the GSH pool size through biosynthesis, as reflected by the increased expression of NoGSH1, NoGSH2A, and NoGSH2B (Figure 6), represents a strategy to enhance the overall response to oxidative stress.
In summary, the metabolites involved in AsA- and/or GSH-mediated redox status play a crucial role in sensing oxidative stress and activate the signaling pathways that coordinate metabolic adjustments in N. oceanica RB mutants exposed to LT-HL combined stress. Together, GSH and AsA, along with their redox states, are key candidates for signaling and modulating high-light tolerance mechanisms in N. oceanica RB mutants.
4.3 Regulation disparities in AGC mechanisms between RB mutants to cope with combined LT and HL stress
Low-temperature stress exerts deleterious effects on cellular metabolic processes and physiological functions in microalgae, as indicated by previous studies (Ermilova, 2020; Xing et al., 2022). In response to the adverse impact of LT, microalgae have evolved a repertoire of acclimation mechanisms to mitigate temperature-induced stress. One such crucial adaptation involves the modulation of membrane fluidity through the augmentation of unsaturated fatty acids, which may promote cellular growth and optimize photosynthetic efficiency under suboptimal temperature conditions. Studies by Peter et al. (2019), Routaboul et al. (2000), Mock and Kroon (2002), and Los and Murata (2004) have contributed to our understanding of the pivotal role played by fatty acid unsaturation in microalgae's acclimation strategies to cope with low-temperature stress.
Psychrophilic microalgae have developed an intriguing strategy to maintain membrane fluidity when exposed to suboptimal temperatures. This involves the incorporation of very long-chain polyunsaturated fatty acids (VLC-PUFA) into membrane lipids, including eicosapentaenoic acid (EPA), arachidonic acid (AA), and docosahexaenoic acid (DHA) (Varshney et al., 2015). Low temperatures impact not only membrane rigidity but also affect their associated protein complexes, particularly within the chloroplast thylakoid membrane. This impairment has cascading effects on photosynthetic electron transport and carbon fixation. As a result, excessive ROS accumulates due to over-reduced photosystem II (PSII) and photosystem I (PSI) because of imbalanced light energy absorption and utilization (O'Kane et al., 1996; Barati et al., 2019; Zalutskaya et al., 2019). The over-accumulation of H2O2 in microalgae under LT conditions is primarily attributed to the Mehler reaction (Mehler, 1951).
A recent physiological and biochemical study by Ben-Sheleg et al. (2021) identified the plastidial monogalactosyldiacylglycerol with high EPA content as a potential target for oxidative damage associated with photosynthetic inhibition in the wild-type strain of Nannochloropsis oceanica under HL-LT conditions. In contrast, the resistant RB mutants exhibited a fourfold higher EPA production compared to the WT strain under HL–LT conditions. It is noteworthy that, under LT conditions, the WT strain of N. oceanica accumulated O2•- and H2O2, and this accumulation was significantly enhanced when subjected to combined HL stress (Figure 1). High-intensity illumination was identified as an additional contributor to ROS production and oxidative damage during LT stress, aligning with findings in terrestrial plants where defense mechanisms against ROS play a central role in coping with LT stress and the combination of HL-LT stress (Iba, 2002; Larkindale & Knight, 2002; Yabuta et al., 2002; Yoshimura et al., 2004).
Notably, APX activity and gene expression were not induced in the RB mutant under LT conditions (Figures 2 and 3). However, the activity, rather than gene expression, was significantly upregulated in the RB113 mutant when exposed to combined LT-HL stress. GR exhibited distinct responses to LT between the RB2 and the RB113 mutants, with its activity and gene expression only induced in the RB113 mutant. Moreover, the RB113 mutant displayed higher GR activity and transcript abundance than the RB2 mutant. These findings support the crucial role played by GR in regulating HL tolerance in C. reinhardtii (Lin et al., 2018). Notably, the basal dehydroascorbate reductase (DHAR) activity of the RB113 mutant at 25°C under normal light conditions was approximately twofold higher than that of the RB2 mutant. The differential responses of the RB2 and RB113 mutants to LT stress, along with the similar trends in response to a combined HL-LT stress environment, shed light on the distinct cascade of events initiated by high-intensity irradiance in the context of suboptimal temperatures. This suggests the involvement of specific signals arising from HL challenge or LT-HL interactions in this complex process.
4.4 Implications of other elements interacting with AGC in RB mutants
The RB mutants, characterized by a genetic background resulting in reduced PSII size and NPQ-mediated heat dissipation, exhibit inducible AGC mechanisms to enhance their tolerance and prevent oxidative stress induced by both LT and LT-HL conditions. Several elements associated with ROS scavenging in algal cells are yet to be explored in Nannochloropsis RB mutants in response to LT-HL stress. Among the antioxidant defense enzymes involved in H2O2 scavenging, glutathione peroxidase (GPX3) was found to be responsible for ROS detoxification in Chlamydomonas reinhardtii upon LT exposure, with the down-regulation of APX and catalase (CAT) at the transcriptional level (Zalutskaya et al., 2019). More work on these enzymes is needed.
These tolerance mechanisms require a complex interplay of various elements. In the broader context of tolerance networks, it is crucial to elucidate the interrelationships between AGC and other regulatory factors to obtain a comprehensive understanding, ultimately contributing to the development of effective strategies for large-scale outdoor cultivation of Nannochloropsis. The antioxidant defense system consists of intricate components well-coordinated to manage ROS homeostasis in chloroplasts and intracellular space (Dietz et al., 2016; Foyer & Noctor, 2020; Foyer & Hanke, 2022).
More specifically, the essential interactions of inducible AGC with other pathways play a pivotal role in reducing ROS production and mitigating macromolecular damage through a reparative and recycling circuit during the adaptation to oxidative stress. The involvement of the nitric oxide (NO) metabolic pathway, which leads to the formation of S-nitrosoglutathione (GSNO) from NO and GSH and the subsequent release of NO and GSSG catalyzed by GSNO reductase (GSNOR), has been explored as a means to modulate the GSH redox balance (Romero-Puertas & Sandalio, 2016). Additionally, the post-modification of APX, DHAR, and GR proteins through S-nitrosylation and/or nitration, as investigated by Yang et al. (2015), Begara-Morales et al. (2015), and Tanou et al. (2012), can provide new insights for an in-depth analysis of regulatory elements. A comprehensive metabolic network analysis, in conjunction with engineering strategies aimed at enhancing fatty acid unsaturation, such as the overexpression of Δ12 desaturase as demonstrated by Kaye et al. (2015), also requires further investigation into Nannochloropsis RB mutants. This research is essential to gain a more profound understanding of the hurdles encountered in large-scale microalgal cultivation and the establishment of economically sustainable commercial production of EPA.
5 CONCLUSION
Possessing NPQ activity and truncated PSII remodeling as a protective mechanism against PSII-derived 1O2 overproduction during LT-HL conditions (Ben-Sheleg et al., 2019, 2021) supports the hypothesis that the AGC system, through increased gene expression and enzyme activity, as well as enhanced availability of AsA and GSH, plays a pivotal role in ROS management (Figure S1). The regulation of ROS production and their effective scavenging through genetic engineering offers promise for enhancing plant tolerance to temperature stress and the combined challenges of low temperature and high-light intensity (Allen, 1995). However, there is currently limited information available regarding the LT-HL-induced modifications of AGC enzymes. Hence, it is imperative to conduct additional studies to comprehend the signal transduction mechanisms in the collaborative regulation of AGC and other associated metabolites that underlie the holistic defense strategies in Nannochloropsis against LT-HL combined stress.
AUTHOR CONTRIBUTIONS
TY Tsai performed experiments, including the preparation of reagents, the culture of microalgae, and the determination of biochemical and physiological parameters. TM Lee prepared the manuscript draft and performed the analysis of experimental data. TY Tsai performed the statistical analysis. TM Lee, I Khozin-Goldberg, and A Vonshak conceived and designed the experiments, interpreted the data, and wrote the paper. All authors read and approved the manuscript.
ACKNOWLEDGMENTS
The authors thank the financial support from National Sun Yat-sen University, Kaohsiung, Taiwan. The collaborative research was supported by the Ministry of Innovation, Science and Technology, Israel, grant N 3-17860.
FUNDING INFORMATION
This work was supported by grants from the Israel Ministry of Innovation, Science & Technology Division for International Scientific Relations, Taiwan-Israeli Scientific Cooperation Unit Israel (grant number 3–17860) and from the National Science and Technology Council, Taiwan (MOST 107-2311-B-110-003-MY3, MOST 110-2311-B-110-003-, MOST 111-2311-B-110 -002-, MOST 111-2923-B-110-001-MY2, MOST 111-2622-E-110-020, NSTC 112-2218-E-042A-001, NSTC 112-231-B-110 -002, and the Israel-Taiwan Joint Add-on Project NSTC 111-2923-B-110-001-MY2).
Open Research
DATA AVAILABILITY STATEMENT
The data that support the findings of this study are available from the corresponding author upon reasonable request.


