DNA demethylation by transitory 5-azacytidine treatment improves somatic embryogenesis yield for regeneration and breeding of cork oak
Abstract
Somatic embryogenesis (SE) is a crucial biotechnological tool for large-scale mass propagation of selected material, genetic transformation and breeding, with many advantages for forest tree improvement. However, the application of SE in forest species is limited because of their recalcitrance. SE is also a valuable system for studying cell reprogramming, acquisition of totipotency and embryo development. Increasing evidence reveals that epigenetic reprogramming takes place during SE through DNA methylation, although there is scarce information on forest species. In this work, we have evaluated DNA methylation dynamics during SE and the effects of the DNA demethylating agent 5-azacytidine (AzaC) in cork oak. After induction and early stages of SE, a reduced DNA methylation level is observed, followed by an increase of methylation during embryo differentiation. These changes in DNA methylation during SE progression were associated with expression profiles of DNA methyltransferase genes QsMET1, QsDRM2 and QsCMT3, and DNA demethylase QsDME-like. Treatment with AzaC reduced DNA methylation, promoted SE induction rate and proembryogenic masses proliferation, and induced the expression of the SE marker gene QsSERK1-like. However, continuous AzaC treatment hindered embryo differentiation, suggesting that DNA methylation is needed for further embryo development. Interestingly, AzaC removal from the culture medium of embryogenic masses restored embryo development and led to a significant increase in somatic embryo production compared with untreated cultures. These findings open new possibilities using transitory treatments with small molecule epigenetic modulators, as AzaC, to enhance SE yields for forestry breeding programs.
1 INTRODUCTION
Plant in vitro regeneration and propagation are key technologies in forest nursery and biotechnology sectors for large-scale production of selected material and for accelerating reforestation programs to combat the climate change effects on forest ecosystems. In fact, the past years have seen an ever-growing need for superior planting material; in vitro regeneration techniques being a key source of this type of material in many cases. Plant regeneration, through direct or indirect somatic embryogenesis (SE), is based on the induction of cell reprogramming of different kinds of somatic cells, which further give rise to embryos and ultimately to plants (Díaz-Sala 2018, Feher 2015, Testillano 2019).
SE presents a great potential for large-scale propagation and cryopreservation of elite genotypes, converting this technology into a very useful tool for the propagation of species with long reproductive cycles or low seed set; such as Fagaceae trees and conifers among other forest plants (Díaz-Sala 2018). In Quercus suber, cork oak, a woody species of relevant economic and ecological interest, several SE in vitro systems have been developed. Protocols for SE from microspores (through anther culture), from immature zygotic embryos, and from leaves have been established and optimized in cork oak (Bueno et al. 1992, Hernández et al. 2003, Testillano et al. 2018a, 2018b). However, in many woody species, including several hardwood trees, in vitro propagation is still problematic, showing reduced efficiency in many cases. In most established SE protocols in trees, somatic embryo production is developed through an indirect pathway (Jain and Gupta 2018). In indirect SE, initial explants cultured under specific induction conditions can produce embryogenic masses that give rise to somatic embryos. These embryogenic masses are usually kept in proliferation for long periods by periodic subcultures, constituting embryogenic lines. The main problems that reduce the yield of somatic embryo production are the low rate of induction in the initial explants and the decay of embryogenic lines, which show reduced proliferation and/or embryogenic capacity along time. This process has been widely studied as a plant regeneration system; however, the regulatory mechanisms at molecular and cellular levels are still unclear.
Plant developmental processes, such as differentiation and proliferation of shoots, roots and somatic embryo development, are accompanied by chromatin remodeling and epigenetic reprogramming (De-La-Peña et al. 2015, Ibáñez et al. 2020, Testillano 2019). The induction of SE is a multi-factorial process that usually requires the application of exogenous stress treatments (e.g., hormones, high temperature) for its initiation. Together with hormones, epigenetic marks are crucial during SE induction and progression (Feher 2015, Pasternak and Dudits 2019). The reprogramming of the cell transcriptome that results in the release of a new developmental program is related to wide changes in the chromatin structure, which involves genome-wide changes of epigenetic modifications in DNA and histones (De-la-Peña et al. 2015, Cordeiro et al. 2023).
DNA methylation is a major epigenetic mark that functions in eukaryotes from fungi to animals and plants, where it plays a crucial role in the regulation of epigenetic silencing. DNA methylation occurs at the position 5 of the cytosine, which changes to 5-methyl-deoxy-cytydine (5mdC). This enzymatic reaction is catalyzed by enzymes known as DNA methyltransferases (DNMTs), whose more relevant families in plants are METHYLTRANSFERASE 1 (MET1), DOMAINS REARRANGED METHYLTRANSFERASES (DRM1 and DRM2), and CHROMOMETHYLASES (CMT2 and CMT3). Active DNA demethylation can also occur in plants by several families of demethylases (DMEs), which are typified in Arabidopsis by the REPRESSOR OF SILENCING 1 (ROS1), DEMETER (DME), and DEMETER-LIKE proteins 2 and 3 (DML2, DML3) (Parrilla-Doblas et al. 2019). Scarce information is available about epigenetic regulator genes in tree species; in cork oak, a few DNMT and DME sequences have recently been reported (Silva et al. 2020).
Previous studies in the herbaceous crop species Brassica napus and Hordeum vulgare have shown that global changes of relevant epigenetic marks, particularly hypomethylation of DNA and histone H3K9, are required to change the plant cell fate towards SE (Berenguer et al. 2017, El-Tantawy et al. 2014, Rodríguez-Sanz et al. 2014a, 2014b, Solís et al. 2012), while further embryo development and differentiation are characterized by the global increase of DNA and histone H3K9 methylation. Consequently, small molecule epigenetic modulators that promote DNA and H3K9 de-methylation are able to enhance cell reprogramming and embryogenesis initiation in some crop species. However, they impair subsequent somatic embryo formation (Berenguer et al. 2017, Solís et al. 2015). Much less information is available about the regulator mechanisms driving somatic embryogenesis in woody plants (Pérez-Pérez et al. 2019). In Quercus alba leaf somatic embryogenesis, DNA demethylation was reported during embryogenesis initiation in embryogenic cells, while higher methylation was found in leaf cells before induction or in non-embryogenic cells (Corredoira et al. 2017). A previous report in Quercus suber also showed a decrease in DNA methylation after SE induction (Rodríguez-Sanz et al. 2014a).
For a better understanding of the epigenetic mechanisms that take place during the embryogenic response, the use of small molecule epigenetic modulators is crucial. 5-azacytidine (AzaC) is a small molecule, analog of 5-cytidine, that induces hypomethylation of DNA by limiting DNA methyltransferase catalytic activity (Pecinka and Liu, 2014). AzaC is randomly incorporated into newly synthesized DNA strands instead of cytosine. 5-azacytidine presents a nitrogen atom at position 5 instead of the carbon atom of cytidine (Jones and Taylor, 1980). During the replication of DNA, this molecule can be incorporated into the DNA, resulting in a decrease in the DNA methyltransferase activity and, consequently, in a general genome hypomethylation (Santi et al. 1983). Treatments with AzaC have been described to impact SE in rapeseed and barley (Solís et al. 2015), Arabidopsis (Grzybkowska et al. 2018), Acca sellowiana (Fraga et al. 2012), hybrid larch (Teyssier et al. 2013), triticale (Nowicka et al. 2019), coconut palm (Osorio-Montalvo et al. 2020) or coffee (Nic-Can et al. 2013), among other species, with very heterogeneous effects.
Despite decades of application of SE, it is still a challenge in many forest species to find efficient conditions for somatic cell reprogramming induction and in vitro plant regeneration. Therefore, finding more efficient technologies for in vitro propagation constitutes a key factor in accelerating selected tree multiplication to face the challenges of adaptation to climate change, forest protection, and species conservation and restoration. In this context, the use of epigenetic modulators as chemical strategies for improving somatic embryo production in tree species needs further exploration.
In the present work, we have evaluated the dynamics of global DNA methylation level and nuclear distribution patterns and the expression profiles of related epigenetic regulators during induction and progression of SE in cork oak. The use of the DNA demethylating agent, 5-azacytidine (AzaC), has been explored to find new chemical epigenetic strategies for increasing embryo production in this economically important forest tree.
2 MATERIALS AND METHODS
2.1 Somatic embryogenesis cultures of Quercus suber L
Somatic embryogenesis was induced by two different procedures: (1) from immature zygotic embryos and (2) from microspores by anther culture.
For embryogenesis induction from immature zygotic embryos, immature pollinated acorns were collected at the responsive stage of early cotyledonary embryos (late August and September) from trees located in El Pardo forest, Madrid, Spain. Acorns were cultured in the induction medium according to the updated protocol described by Testillano et al. (2018a). After 4 weeks, acorns were transferred to proliferation medium, with similar composition to the induction medium but without 2,4-D and supplemented with 0.5 g L−1 glutamine (Sigma-Aldrich), where proembryogenic masses (PEMs) proliferated and gave rise to somatic embryos (indirect SE). By monthly subcultures to fresh proliferation medium, SE cultures continued their development and multiplied, producing new PEMs and somatic embryos for months (Testillano et al. 2018a).
For the induction of microspore embryogenesis, catkins were collected weekly (from early May to early-mid June) from the same trees as above. Anthers containing vacuolated microspores, the most responsive stage for the induction of embryogenesis, were selected. Anthers were cultivated in the induction medium as described by Testillano et al. (2018b). Embryogenesis was induced by a 33°C treatment of 5 days in darkness. Afterwards, cultures were transferred to 25°C and kept in darkness. After 20–30 days, anthers began to swell and early proembryos arose from the inside of the anther. After some more days, proembryos grew and formed globular embryos (direct embryogenesis) and PEMs that further originated embryos (indirect embryogenesis). After one month, embryos were subcultured to the proliferation medium, a medium without activated charcoal and containing 0.5 g L−1 glutamine, and kept at 25°C in darkness. Cultures were monthly transferred to a fresh proliferation medium where they continued producing new PEMs and embryos (Testillano et al. 2018b).
The detailed composition of the culture media is described in Table S1.
2.2 In vitro treatments with 5-azacytidine
The effect of the demethylating agent 5-azacytidine (AzaC, Sigma-Aldrich) was evaluated on SE induction from immature zygotic embryos and on the development of embryogenic cultures (SE progression), which involve PEM proliferation and embryo production. A 10 mM AzaC stock solution was freshly prepared in H2O and added to induction or proliferation media after filtering with a sterile Ministart® filter (Sartorius Stedim Biotech). For induction assays, immature zygotic embryos were cultured on induction media containing two different concentrations of AzaC: 100 and 200 μM. Three replicates per treatment were carried out. Five immature zygotic embryos were cultured per replicate. After 30 days of treatment, immature zygotic embryos were transferred to the proliferation medium without AzaC. For assays on the development of embryogenic cultures, clusters of PEMs originated in normal induction medium from randomly selected immature zygotic embryos were treated with 100 or 200 μM AzaC. After a 4-week treatment, PEMs were subcultured to the proliferation medium without AzaC (recovery medium). Three replicates per treatment were carried out in all cases. In both assays, parallel cultures without the drug were used as controls.
The effect of AzaC on SE induction was assessed by quantifying the percentage of explants (immature zygotic embryos) that showed embryogenic response after 1 month on induction medium containing AzaC followed by one month on normal proliferation medium, without AzaC. The effect of the demethylating agent on the development of embryogenic cultures was evaluated by quantifying PEMs proliferation by relative fresh weight (FW; FW after 30 days of treatment / FW at the initiation of the experiment), and by quantifying the percentage of somatic embryos produced after 30 days on the recovery medium. Significant differences among treated and control cultures were examined by ANOVA (analysis of variance) and Tukey's tests at P ≤ 0.05.
2.3 Processing of samples for microscopy analysis
Immature zygotic embryos, anthers, PEMs, and somatic embryos at different developmental stages (heart, torpedo and cotyledonary embryos) were processed for structural and immunofluorescence analyses. Samples fixation, acetone dehydration, embedding of the samples in Technovit 8100 resin and resin polymerization were carried out according to Pérez-Pérez et al. (2019). Sections of 1–2 μm thickness were obtained with an ultramicrotome. For structural analyses, some sections were stained with 1% Toluidine blue, mounted with Eukitt® (Panreac, AppliChem ITW Reagents) and observed under bright field microscopy. Some other sections were placed on multi-well slides coated with the adherent aminopropyl-triethoxi-saline (APTES; Sigma-Aldrich) and stored at 4°C until their use for immunofluorescence assays.
2.4 Immunofluorescence assays and confocal microscopy analysis
Immunofluorescence was performed to localize 5-methyl-deoxy-cytidine (5mdC) following the protocol previously described in Testillano et al. (2013) and Solís et al. (2015). For DNA denaturation, sections were treated with 2 N HCl for 45 min, washed in PBS and blocked with 5% bovine serum albumin (BSA) in PBS for 10 min. Then, they were incubated for 1 h with anti-5mdC mouse antibody (Eurogentec) diluted 1:50 in 1% BSA. Sections were washed in PBS and incubated with Alexa-Fluor-488 labelled anti-mouse IgG antibody (Molecular Probes) diluted 1:25 in 1% BSA, for 45 min in darkness. After washing with PBS, sections were counterstained with 1 mg mL−1 DAPI (4′,6-diamidino-2-phenylindole) for 10 min. Then, sections were mounted in Mowiol® (Sigma-Aldrich) and examined by confocal laser microscopy (Leica TCS-SP5 Microsystems). To compare between the immunofluorescence signals of different SE developmental stages and between untreated and AzaC-treated samples, confocal microscopy images were captured using the same laser excitation and sample emission settings in all immunofluorescence preparations. As negative controls, neither DNA denaturation nor primary antibody incubation steps were performed.
2.5 Quantification of global DNA methylation
Global DNA methylation levels were analyzed in SE samples at different stages of development and from untreated and AzaC-treated samples. Genomic DNA was purified using the DNeasy Plant Mini Kit (Qiagen) following the supplier's protocol. For the quantification of global DNA methylation, ELISA-like assays were performed using a MethylFlash™ Methylated DNA Quantification Kit (Colorimetric; Epigentek) with 100 ng of genomic DNA collected from samples from various culture plates. Briefly, DNA was spotted and bound to strip wells. For the detection of the methylated fraction of DNA, capture and detection antibodies were used. Then, the signal was quantified colorimetrically by reading the absorbance (optical density, OD) at 450 nm with spectrophotomer. Per sample, three biological and two technical replicates were carried out. One-way ANOVA analysis of variance followed by Tukey's multiple comparison test at P ≤ 0.05 was performed.
2.6 Gene expression analyses by quantitative real-time PCR (RT-qPCR)
Samples from SE cultures at different stages of development were used for expression analysis experiments. Samples of untreated and AzaC-treated cultures were also analyzed. Sequences of genes of the DNA methyltransferases DNA METHYLTRANSFERASE 1 (QsMET1; XM_024015905.1), CHROMOMETHYLTRANSFERASE 3 (QsCMT3; XM_024063870.1), DOMAIN-REARRANGED METHYLTRANSFERASE 2 (QsDRM2; XM_024066769.1), DNA demethylase DEMETER-LIKE (QsDME-like; XM_024014782.1), and sequences of the embryogenesis marker genes SOMATIC EMBRYOGENESIS RECEPTOR KINASE 1-LIKE (QsSERK1-like; XM_024064686.1) and LATE EMBRYOGENESIS ABUNDANT-like (QsLEA-like; XM_024035857.1) were selected from the NCBI database (www.ncbi.nlm.nih.gov/genbank) (Silva et al. 2020, Capote et al. 2019). Gene-specific primers design and validation, total RNA purification, DNase treatment, reverse transcription and RT-qPCR settings were performed according to Pérez-Pérez et al. (2019). For RT-qPCR, the FastStart Essential DNA Green Master (Roche Diagnostics) was used. ACTIN (QsACTIN; EU697020.1) was selected as internal reference gene. The primers used are described in Table 1. At least three biological and three technical replicates were analyzed. Samples of each stage of development were randomly selected from eight different SE cultures. Samples of AzaC treatments and controls were randomly extracted from three different SE cultures. Data was analyzed with the LightCycler®96 software (v.1.1.0.1320; Roche Diagnostics International Ltd.) using Livak's method (Livak and Schmittgen 2001). Transcript levels were normalized using QsACTIN values. Data were expressed as the mean of fold-change values (relative expression) referred to immature zygotic embryos for QsMET1, QsCMT3, QsDRM2, QsDME-like, QsSERK1-like and QsLEA-like genes during SE progression; and to control cultures in the AzaC study for QsSERK1-like and QsLEA-like genes. One-way ANOVA analysis of variance followed by Tukey's multiple analysis test at P ≤ 0.05 were used in order to identify significant differences.
| Gene abbreviation | Accession n° | Primer sequences 5′3’ (F/R) | Product size (bp) |
|---|---|---|---|
| QsDRM2 | XM_024066769.1 | AGTGGATATGGGTTACTTGGTTGA/ | 142 |
| AGGTGATTCTCTAAGCTGGGC | |||
| QsMET1 | XM_024015905.1 | TGTGGTGGTTTGTCAGAGGG/ | 162 |
| CTTCTCCATCACAGCCCGAA | |||
| QsCMT3 | XM_024063870.1 | CTCGACGCCATTACACCCAA/ | 186 |
| CGACCGTATCCTCAGCCCTA | |||
| QsDME-like | XM_024014782.1 | AACATTGGGACAGACACGCT/ | 194 |
| TGTGCATCCATTAGGCTCGT | |||
| QsLEA-like | XM_024035857.1 | CTGACCACTCCTTCAGCATC/ | 199 |
| CAGCAGAAGTGAGAGCAACA | |||
| QsSERK1-like | XM_024064686.1 | TGGAAGCTGAGGTAGAGCAG/ | 148 |
| ACTTCCACCTTTTGCCACTC | |||
| QsACT | EU697020.1a | CCTGATGGGCAGGTTATCACA/ | 80 |
| GCTTCAATGAGAGATGGCTGG |
- a Marum et al. (2012); GenBank (www.ncbi.nlm.nih.gov/genbank).
3 RESULTS
3.1 Changes in nuclear distribution patterns of DNA methylation during SE
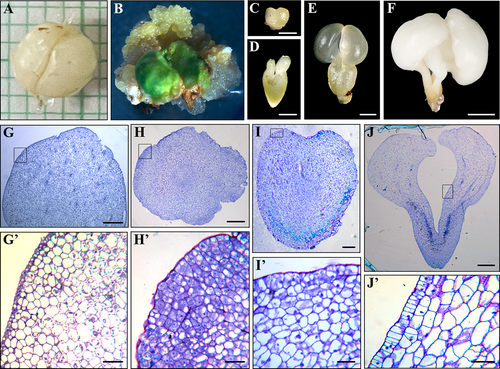
SE was induced from two different explants and cell types: from immature zygotic embryos and from microspores inside anthers. In the first SE system, embryogenic masses and small globular embryos emerged from the surface of the immature zygotic embryos after around one month in culture (Figure 1A, B). In the following days, embryogenic masses proliferated, forming clusters of cellular aggregates mainly composed of proliferating embryogenic cells. Embryogenic cells further divided to form new embryogenic masses or directly formed somatic embryos, which in turn gave rise to new embryos by recurrent SE. Somatic embryos developed differentiating into globular, heart (Figure 1C), torpedo (Figure 1D) and cotyledonary embryos (Figure 1E). Some cotyledonary embryos spontaneously increased their weight, leading to the formation of opaque and ivory-colored mature somatic embryos (Figure 1F). Microscopic analyses of sections stained by Toluidine blue revealed the structural organization at the main stages of the process. Immature zygotic embryos showed large differentiated cells with big vacuoles and small nuclei (Figure 1G, G'). Embryogenic masses were formed by smaller cells showing dense cytoplasm, small vacuoles and large and rounded nuclei (Figure 1H, H'), typical features of proliferating cells. At more advanced stages of development (heart, torpedo and cotyledonary embryos), embryo cortex showed larger cells, highly vacuolated and with small nuclei (Figure 1I, I', J, J'). As embryogenesis progressed, the epidermis differentiated around the embryo as a single layer of polygonal cells (Figure 1J').
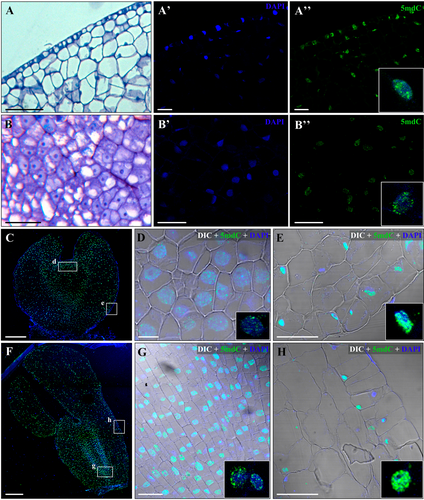
To analyze the changes in level and nuclear localization pattern of methylated DNA during SE, immunofluorescence assays with antibodies to 5-methyl-deoxycytidine (5mdC) were carried out. Immature zygotic embryos (initial explant, before SE induction) showed an intense 5mdC labeling over the small ellipsoid nuclei, covering large regions of the nuclear volume (Figure 2A, A', A", inset). After induction, cells of embryogenic masses showed lower 5mdC immunofluorescence intensity over their large rounded nuclei; labeling was mainly localized in small spots over the nuclei (Figure 2B, B', B″, inset). At more advanced stages of development, heart, torpedo and cotyledonary embryos showed intense immunofluorescence signal for 5mdC on most of their nuclei (Figure 2C, F, insets), although differences in labeling pattern could be found between meristematic regions and cortex or epidermal cells. In apical and root meristems, which were formed by cells with a typical organization of proliferating cells, their large rounded nuclei showed low 5mdC labeling, distributed in small spots (Figures 2D, G, insets). On the other side, most cells of the embryo cortex and epidermis exhibited intense immunofluorescence signals that covered major parts of their small nuclei (Figure 2E, H, insets). No labeling was detected either on the nucleus or on other subcellular compartments for negative controls, neither DNA denaturation nor first antibody incubation (Figure S1).
Microspore embryogenesis was also induced through anther cultures. Anthers containing microspores at the vacuolated stage were cultured (Figure 3A). Around 5–6 weeks after induction, white rounded structures, corresponding to embryogenic masses and globular embryos, emerged from the interior of the anther (Figure 3B). Several globular embryos could originate by direct embryogenesis, from individual microspores from each anther, or indirectly from embryogenic masses that could proliferate forming clusters (Figure 3C). Microspore-derived embryos developed to heart, torpedo and cotyledonary embryo, some of them spontaneously matured (Figure 3D). Microscopic analyses revealed that anthers at the beginning of culture contained vacuolated microspores (Figure 3E, inset); after induction, they reprogrammed and divided producing multicellular proembryos and clusters of embryogenic cells (Figure 3H), which showed a typical structure of proliferative cells, with low vacuolation and large nucleus (Figure 3H, inset).
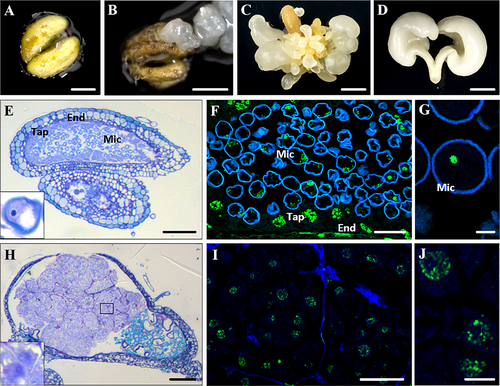
The 5mdC immunofluorescence assays showed that, before induction, vacuolated microspores located inside the pollen sac of the anther showed nuclei that were intensely and homogeneously labeled (Figure 3F, G). Other cell types present in the anther tissues were also labeled. Tapetal cells, which form the inner cell layer of the anther wall, displayed large and rounded nuclei with 5dmC labeling over their large chromatin patches. The elongated nuclei of cells of endothecium and exothecium (cell layers forming the anther wall) showed similar nuclear labeling, in large patches (Figure 3F). After induction, at early microspore embryogenesis, cells of embryogenic masses and proembryos inside the anther showed low immunofluorescence signal for 5mdC, localized in small nuclear spots (Figure 3I, J).
3.2 Changes in global DNA methylation levels during SE
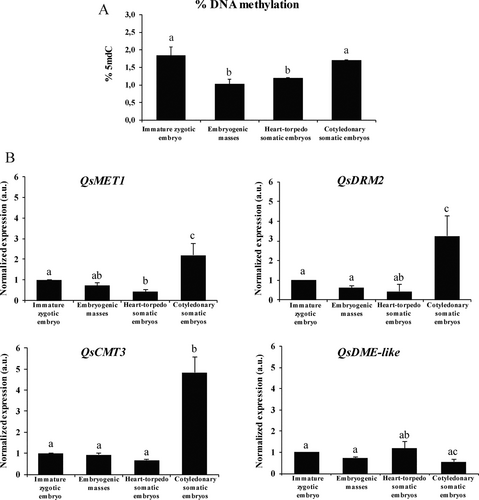
To quantitatively evaluate the changes in DNA methylation during SE, global DNA methylation levels were quantified at main developmental stages: immature zygotic embryos (before induction), embryogenic masses, heart-torpedo embryos and cotyledonary embryos. After induction, embryogenic masses showed a significant lower DNA methylation than immature zygotic embryos (Figure 4A). In subsequent stages of development (heart-torpedo and cotyledonary embryos), a progressive increase in methylation was observed, probably associated with embryo differentiation; cotyledonary embryos exhibited the highest level of global DNA methylation (Figure 4A). These results correlated with 5mdC immunofluorescence data indicating that SE initiation was associated with DNA hypomethylation, whereas embryo differentiation involved an increase of methylation.
3.3 Gene expression profiles of DNA methyltransferases and demethylases during SE
To study the changes in DNA methylation during SE of cork oak, we also analyzed the gene expression patterns of four enzymes that control DNA methylation by adding and removing methyl group of cytosines. Three DNA methyltransferases of maintenance and de novo methylation, DNA METHYLTRANSFERASE 1 (QsMET1), CHROMOMETHYLTRANSFERASE 3 (QsCMT3), and DOMAIN-REARRANGED METHYLTRANSFERASE 2 (QsDRM2), and the DNA demethylase DEMETER-LIKE (QsDME-like) were selected. RT-qPCR results showed similar expression profiles for the three DNA methyltransferases (QsMET1, QsCRMT3 and QsDRME2); they showed low levels of expression in immature zygotic embryos and at the initial stages of SE, embryogenic masses and heart-torpedo embryos, stages where a high proliferative activity takes place. However, expression of DNA methyltransferases significantly increased at more advanced stages in cotyledonary embryos (Figure 4B). Regarding the DNA demethylase, QsDME-like, expression did not significantly change in immature zygotic embryos and during the initial stages of embryogenesis (embryogenic masses and heart-torpedo embryos), while it was down-regulated during embryo differentiation, in cotyledonary embryos (Figure 4B).
3.4 Effects of AzaC treatment on SE induction and embryogenic culture development
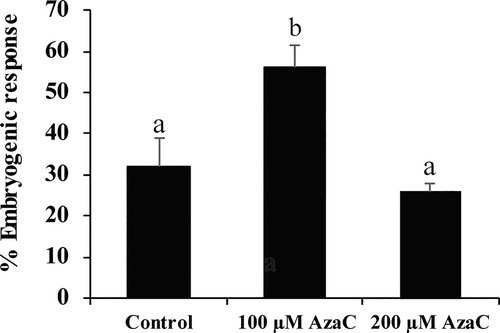
To evaluate the effect of AzaC on SE induction, immature zygotic embryos were cultured on induction media supplemented with AzaC at two concentrations 100 or 200 μM. After 30 days in induction media, the embryogenic response appeared in some explants as proliferating cell masses and small embryos. The percentage of explants that responded to induction by 100 μM AzaC was higher (56%) than that of control cultures (32%). In contrast, 200 μM AzaC did not show significant differences with control cultures (Figure 5).
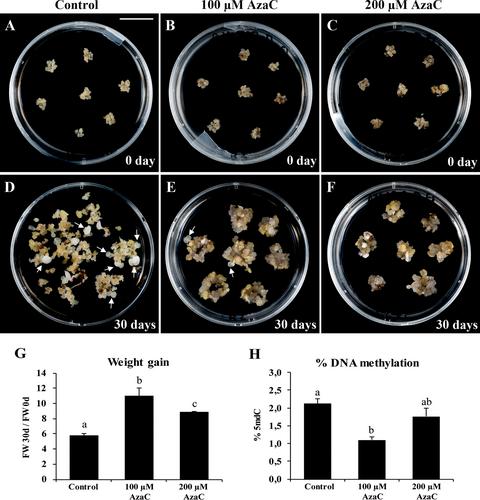
Regarding the effect of the epigenetic inhibitor AzaC during further stages of SE (proliferation of embryogenic masses and embryo differentiation), clusters of embryogenic masses were isolated and treated with two different concentrations of AzaC: 100 or 200 μM during 30 days. After the treatment, embryogenic masses from control cultures proliferated, producing new embryogenic masses and several embryos at different stages of development, from globular to cotyledonary stage; some of them reached a maturation stage (Figure 6A, D, arrows point to differentiated embryos). In contrast, 100 μM or 200 μM AzaC-treated cultures showed a big increase in embryogenic masses and numerous small globular embryos emerging from them, while almost no differentiated embryos were produced (Figure 6B, C, E, F, arrows point to differentiated embryos); the volume of embryogenic masses was higher in 100 μM AzaC treatment (Figure 6E) than in 200 μM concentration (Figure 6F). However, almost no advanced embryo stages were found in AzaC-treated cultures, suggesting that embryo development and differentiation was impaired by AzaC. To evaluate the proliferation rate of the cultures, quantification of the increment in fresh weight after 30 days was performed. The weight gain in AzaC-treated cultures was higher than in control conditions: an increment of two-fold at 100 μM AzaC and a bit less at 200 μM (Figure 6G). These results indicated that AzaC treatment promoted cell proliferation of embryogenic masses, while it impaired embryo differentiation.
3.5 Global DNA methylation levels and nuclear distribution patterns after AzaC treatment
To analyze if AzaC reduced DNA methylation of embryogenic cultures of cork oak, the quantification of global DNA methylation levels was performed in untreated and AzaC-treated cultures after 30 days of treatment. The results showed that 100 μM AzaC treatment significantly reduced DNA methylation by nearly 50% compared to untreated cultures (Figure 6H), while 200 μM treatment had a much lower effect on methylation, with no statistically significant differences with untreated cultures (Figure 6H); this could be due to an excess of the drug, which would result toxic and/or produce unexpected effects.
Microscopic analyses of Toluidine blue-stained sections of untreated and AzaC-treated embryogenic masses showed that untreated masses had irregular shapes and contained typical embryogenic cells with large nuclei (Figure 7A, A'). Upon 100 μM AzaC treatment, masses presented similar embryogenic cells than in untreated cultures. Furthermore, these masses showed a number of small globular embryos at their periphery (Figure 7B, B'). Masses treated with 200 μM AzaC contained some groups of small and dense cells, together with very large and highly vacuolated cells with irregular shapes and small lens-shaped nuclei. These masses did not show any globular embryos (Figure 7C, C').
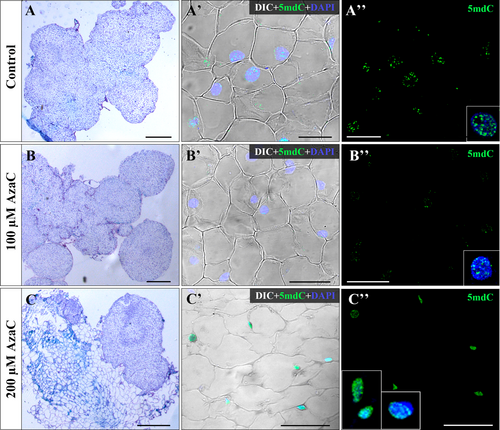
To analyze how AzaC affects the nuclear localization pattern of methylated DNA, immunofluorescence assays were performed using an antibody to 5mdC. Nuclei of embryogenic cells from control and 100 μM AzaC-treated cultures showed low labeling, with a spotty pattern over nuclei with the number of spots and the intensity of the signal being lower in AzaC-treated cultures than in control cultures (Figure 7A", B″, insets). On the contrary, in 200 μM AzaC-treated cultures, the small nuclei of the highly vacuolated cells showed intense 5mdC labeling, whereas the large rounded nuclei of the embryogenic cells exhibited lower labeling in small nuclear spots (Figure 7C", insets). No immunofluorescence signal was detected in negative controls, either on nuclei or on any other subcellular compartment, in treated and non-treated cultures. These results correlated global DNA methylation levels and indicated that AzaC treatment, at 100 μM concentration, efficiently reduced DNA methylation of embryogenic cells and promoted the initial formation of early globular embryos. However, 200 μM seemed to be over the optimal concentration as it had a negative effect on embryogenic development.
3.6 Effects of AzaC treatment on gene expression patterns of embryogenesis-related genes
The expression profiles of relevant genes involved in embryogenesis after AzaC treatment were analyzed. Two embryogenesis marker genes were selected for the analyses. SOMATIC EMBRYOGENESIS RECEPTOR-LIKE KINASE1 (SERK1) has been identified in embryogenic cultures of many higher plants with a positive role in triggering embryogenesis and in embryogenic competence acquisition (Schmidt et al. 1997). On the other hand, LATE EMBRYO ABUNDANT (LEA) is a gene highly expressed during later phases of embryogenesis that influences the development of zygotic and somatic embryos (Miguel et al. 2015).
Expression profiles of both early and late embryogenesis genes were analyzed during SE initiation and progression: at the stages of immature zygotic embryos (before embryogenesis induction), embryogenic masses, heart-torpedo embryos and cotyledonary embryos. Gene expression was also analyzed in cultures untreated and treated with AzaC for 30 days. In control cultures, QsSERK1-like expression was specifically induced (two-fold higher expression) after embryogenesis induction, at early stages of SE, in embryogenic masses; however, its expression decreased during subsequent stages of embryo development (Figure 8A). Embryogenic masses treated with AzaC (100 μM) showed increased expression of QsSERK1-like compared to control cultures (Figure 8B). Different expression profile was found for QsLEA-like during SE. Its expression was down-regulated at embryogenesis initiation, in embryogenic masses, while it was highly induced during embryo development, in heart-torpedo embryos (Figure 8C). AzaC treatment on embryogenic masses led to significant reduction of QsLEA-like expression compared with untreated cultures (Figure 8D). These results indicated that AzaC treatment increased expression of early embryogenesis gene QsSERK1-like, while it reduced transcription of late embryogenesis gene QsLEA-like.

3.7 Recovery of embryogenic cultures after AzaC elimination
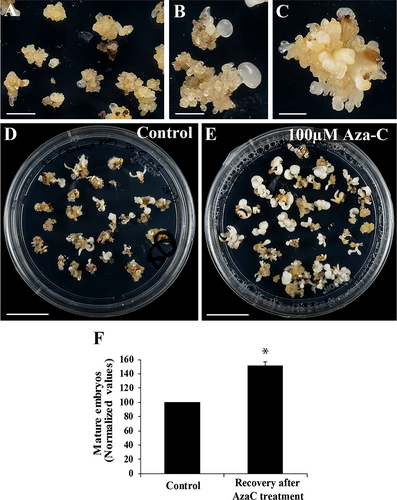
Since AzaC treatment enhanced embryogenic masses proliferation and embryogenesis initiation but it impaired further embryo differentiation, we evaluated the effect of AzaC removal from the cultures by transferring the masses to regular proliferation media without AzaC (recovery conditions). After two weeks in recovery conditions, 100 μM AzaC-treated embryogenic masses greatly developed and showed numerous clusters of embryos at initial stages of development like well-defined globular-heart embryos (Figure 9A-C). After 30 days in recovery conditions, AzaC-treated embryogenic masses showed a massive production of somatic embryos, with a significant increase in the number of mature embryo formation compared with control cultures (Figure 9D, E). Quantification of embryo production revealed an increase of around 50% with respect to cultures that were not treated with the demethylating agent (Figure 9F). However, embryogenic masses that were treated with 200 μM AzaC did not develop properly, even after recovery conditions, which suggested a certain toxic effect at this higher dose.
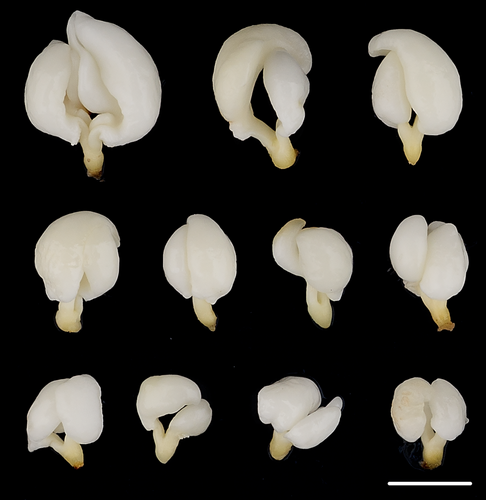
The somatic embryos produced after AzaC treatment and recovery underwent a very good development, reaching the typical anatomy of high-quality somatic embryos. They showed well-formed and large cotyledons, embryo axis and hypocotyl (Figure 10), with size, color and shape similar to the quality embryos formed in control cultures (compare Figure 10 with Figure 1F).
4 DISCUSSION
4.1 SE initiation involves global DNA demethylation, whereas embryo development requires an increase of methylation
In our study, we have analyzed the dynamics of DNA methylation during the SE process in two different in vitro systems: SE initiated from immature zygotic embryos and SE initiated from microspores (through anther culture). In both systems, immunolocalization of 5mdC revealed that, before induction, the initial explant (immature zygotic embryo or microspores) showed high levels of methylated DNA whereas, after induction, either cells of proembryogenic masses or proembryos showed a decondensed chromatin pattern exhibiting low 5mdC signal, indicating low DNA methylation. In our study, we detected a gradual increase in global DNA methylation in developing embryo cells, linked to the heterochromatization associated with cellular differentiation, exhibiting cotyledonary somatic embryos the highest 5mdC signal (Figure 2). ELISA-like assays to quantify global DNA methylation levels additionally supported the immunofluorescence results (Figure 2, 4A). Previously, in cork oak, Rodríguez-Sanz et al. (2014a) described that DNA hypomethylation, thus chromatin decondensation, accompanied SE induction; however, this study did not analyze the nuclear distribution pattern of the methylated DNA in more advanced stages of development. Several studies have demonstrated changes in global DNA methylation levels during SE. For example, microspore reprogramming and embryogenesis initiation in the crop species Brassica napus and Hordeum vulgare involve a global DNA hypomethylation, while a progressive increase of global methylation is detected in embryo cells during embryo development (Solís et al. 2012; El-Tantawy et al. 2014). During SE of Coffea canephora, proembryogenic masses presented low DNA methylation, whereas embryo maturation was marked by a progressive increase in global levels of DNA methylation (Nic-Can et al. 2013). In some trees, morphogenic capacity has been related to low levels of DNA methylation (Valledor et al. 2010). DNA demethylation has been associated with the initiation of SE in Pinus radiata (Bravo et al. 2017) and Quercus alba (Corredoira et al. 2017) with lower DNA methylation in embryogenic tissues compared to non-embryogenic ones. In Cocos nucifera and Q. suber, it has been reported that DNA methylation increases with SE progression (Osorio-Montalvo et al. 2020, Pérez et al. 2015). Interestingly, in our study, we detected differences in 5mdC distribution pattern in mature somatic embryos, where meristematic cells presented a reduced 5mdC distribution compared to differentiated cells from the cortex or epidermis, which presented higher levels of DNA methylation (Figure 2G, 2H). Meristematic cells are active proliferating cells, whereas differentiating cells have decreased cellular activity. In several species, the distribution pattern of 5mdC in cycling cells is reduced to small condensed chromatin spots, whereas 5mdC reveals a highly condensed chromatin pattern in differentiating cells (El-Tantawy et al. 2014, Solís et al. 2012, Testillano et al. 2013). Recent studies reveal a close link between auxins and epigenetic modifications. It is suggested microRNAs and epigenetic factors, such as DNA methylation, histone modifications and chromatin remodeling, could modulate auxin biosynthesis, transport, and signal transduction (Maury et al. 2019). In this context, endogenous auxin accumulation takes place in developing somatic embryos in cork oak, which is related to the expression profiles of the auxin biosynthesis gene QsTAR2 and the signaling gene QsARF5 (Carneros et al. 2023). These results are in consonance with the hypermethylation of DNA reported in the present study at advanced stages of somatic embryo development in cotyledonary embryos. In C. canephora, it has been reported that cell proliferation was characterized by low levels of global 5mdC and indolacetic acid (IAA), the major endogenous auxin, while cell differentiation was marked by increases in 5mdC and IAA, evidencing that these changes triggered regeneration and maturation of somatic embryos (Amaral-Silva et al. 2021). Taken together, the current findings indicate that epigenetic regulation via changes in global methylation of DNA plays an important role in the induction and development of somatic embryos in cork oak.
4.2 Expression profiles of DNA methyltransferases QsMET1, QsCMT3 and QsDRM2, and DNA demethylase QsDME-like correlate with DNA methylation changes during SE
The role of DNA methylation in the SE process in cork oak was also evaluated by the expression analyses of genes encoding three DNA methyltransferases, QsMET1, QsCMT3 and QsDRM2, and the DNA demethylase QsDME-like, in immature zygotic embryos and during somatic embryo development. For the three DNA methyltransferases, low transcription was detected in immature zygotic embryos before induction and at early SE stages (Figure 4B). Even though no significant differences were observed, immature zygotic embryos showed slightly higher transcription levels compared to embryogenic masses. However, the three DNA methyltransferases were significantly induced in advanced stages of development in cotyledonary embryos (Figure 4B). These results reveal that embryogenesis progression leads to a change in the expression pattern of QsMET1, QsCMT3 and QsDRM2, correlating the transcriptional activity of these genes with DNA methylation dynamics. In B. napus, BnMET1 was induced during microspore embryogenesis progression, as well as at later stages of zygotic embryogenesis, indicating that MET1 is involved in the increase of global DNA methylation of differentiating embryo cells (Solís et al. 2012). Osorio-Montalvo et al. (2020) described a gradual induction of MET1, CMT3 and DRM2 genes during the SE process of coconut, reaching their peak of expression after 120 days in culture, when somatic embryos were completely formed. During SE in Arabidopsis thaliana, MET1 and CMT3 were highly induced compared to DRM2 (Grzybkowska et al. 2018). Cytosine methylation by DNA methyltransferases can be achieved by two mechanisms: (1) maintenance of methylation status; MET maintains the methylation pattern during DNA replication. (2) de novo methylation via DRM and CMT. Therefore, our results suggest that both de novo and maintenance of DNA methyltransferases are required for the regulation of somatic embryo development.
On the other hand, transcript levels of the DNA demethylase QsDME-like did not significantly change in immature zygotic embryos and during the initial stages of embryogenesis, while its expression was down-regulated at the most advanced developmental stages (cotyledonary embryos) (Figure 4B). According to Parrilla-Doblas et al. (2019), the biological roles of DNA demethylation contribute not only to the stability and plasticity of plant epigenome but also protect the genome from excessive methylation. The pattern of DNA methylation in plant development, including the initial phases of embryogenesis, is thought to be regulated by the balance between methylation and demethylation (Bouyer et al. 2017).
No significant differences in expression were found at SE early stages after induction (between immature zygotic embryos and embryogenic masses), for any of the methylase/demethylase genes tested. Since DNA methylation diminished after SE induction, other DNA demethylase genes could participate in the hypomethylation accompanying SE initiation. However, the expression profiles presented correlate with the increase of DNA methylation occurring at advanced SE stages. The results suggest the participation of the DNA methyltransferases (QsMET1, QsCMT3 and QsDRM2) and the DNA demethylase QsDME-like in the regulation of global DNA methylation changes occurring during SE progression in cork oak.
4.3 DNA hypomethylation by AzaC improves SE induction and embryogenic masses proliferation, and upregulates SERK1
Since SE induction and progression are characterized by changes in global DNA methylation, we have explored the use of epigenetic modulators affecting DNA methylation as chemical strategies for improving somatic embryo production. A functional analysis was carried out by using the epigenetic modulator AzaC, which has not been used in cork oak before. AzaC is an analog of 5-cytidine that induces hypomethylation of DNA by limiting DNA methyltransferase catalytic activity (Pecinka and Liu 2014). In the present study, there was an increase in the percentage of immature zygotic embryos that gave rise to an embryogenic response when AzaC was added to the induction culture media in comparison to untreated explants (Figure 5). Additionally, AzaC promoted cell proliferation and also the formation of small globular embryos emerging from the proliferating embryogenic masses (Figure 6). In different plant systems, DNA demethylation by using AzaC during SE has been reported, with different effects on development depending on the concentration, time of application, and process. Several studies reported that this compound reduced the embryogenic potential in several species (Grzybkowska et al. 2018, Teyssier et al. 2013). Conversely, some other studies reported a positive effect of AzaC on SE. For example, DNA demethylation by AzaC promoted microspore embryogenesis initiation and formation of proembryos in barley and rapeseed (Solís et al. 2015), and triticale (Nowicka et al. 2019). In C. nucifera, three days of pretreatments with AzaC significantly increased early somatic embryo formation (Osorio-Montalvo et al. 2020). In the present study, in cork oak, 100 μM AzaC treatment led to increased SE induction and proliferation of embryogenic masses, while treated cultures exhibited significantly lower levels of global DNA methylation than controls (Figure 5H). Moreover, the demethylating agent affected the distribution of methylated DNA and the patterns of chromatin condensation, resulting in more decondensed chromatin threads (Figure 7). These results indicate that, in cork oak, AzaC-induced hypomethylation promotes the somatic cell transition to embryogenic cells, a crucial step in SE initiation, as well as enhances the proliferative activity of the embryogenic cells, keeping their capacities to produce new embryos.
Our results also pointed out that AzaC-treated cultures impaired embryo differentiation, which would be explained by the loss in DNA methylation levels, which are required during advanced stages of embryo formation. In B. napus, AzaC promoted embryogenesis initiation but prevented embryo differentiation, suggesting that the presence of the drug during advanced stages blocked the process at proembryo stage (Solís et al. 2015). Likewise, in C. canephora, it has been reported that AzaC synchronized the embryogenic process, improving the formation of globular somatic embryo formation, and also reduced embryo maturation (Nic-Can et al. 2013). These authors assessed that the impaired embryo formation due to AzaC was indeed due to a loss in DNA methylation levels. Hypermethylation is associated with cell differentiation in advanced embryogenesis stages and with the increase in global DNA methylation and heterochromatization events (El- Tantawy et al. 2014, Solís et al. 2012, 2015).
Chromatin decondensation by AzaC may alter the transcription of genes associated with SE. To further understand the effect of AzaC, we evaluated two differentially expressed SE-marker genes: SOMATIC EMBRYOGENESIS RECEPTOR KINASE 1-like (QsSERK1-like) and LATE EMBRYOGENESIS ABUNDANT-like (QsLEA-like) genes. SOMATIC EMBRYOGENESIS RECEPTOR KINASE (SERK) family of TFs is involved in different developmental processes that include differentiation/trans-differentiation and cellular totipotency (Pilarska et al. 2016). SERK genes are involved in anther development and in early embryo development in sexual and asexual seed formation. In vitro SE requires the participation of several genes, among which SERK genes are particularly important in the initiation and establishment of SE. Arabidopsis seedlings overexpressing AtSERK1 showed higher efficiency for SE initiation (Hecht et al. 2001). In cork oak, our results indicate that SE induction is accompanied by QsSERK1-like up-regulation, followed by a decrease of expression levels when somatic embryos follow a maturation pathway (Figure 8A), indicating that QsSERK1 may have the same ability as its ortholog in Arabidopsis (Capote et al. 2019). The upregulation of QsSERK1-like in proembryogenic masses treated with AzaC, compared to untreated cultures (Figure 8B), correlates with the enhanced proliferation of embryogenic masses and embryogenesis initiation observed in AzaC-treated cultures (Figure 6G), supporting the key role of DNA hypomethylation at early stages of the SE process. Among the genes involved in embryogenesis regulation, transcripts encoding for members of Late Embryogenesis Abundant protein family, such as LATE EMBRYOGENESIS ABUNDANT gene (LEA), were almost exclusively expressed in the last stage of the cork oak acorn development (Miguel et al. 2015), corresponding to later stages of embryo differentiation. Our results showed that in cork oak, QsLEA-like expression is low after SE induction, while expression increases at advanced stages of somatic embryo development (Figure 8C). The application of the DNA demethylating agent reduced the expression of the QsLEA-like gene (Figure 8D). These results suggest that the demethylating effect of AzaC affects the regulation of SE-related genes' expression in cork oak, leading to the enhancement of SE induction and proliferation of embryogenic lines, together with the impairment of embryo differentiation.
4.4 Transitory AzaC treatment promotes the development of somatic embryos, increasing the yield of embryo production
Somatic embryo development involves cell differentiation, a process that requires silencing certain gene programs and activating other ones. Gene silencing during cell differentiation is considered to be associated with DNA methylation. In the present study, we have observed that DNA hypermethylation is related to heterochromatization during somatic embryo cell differentiation. Moreover, we have detected that presence of the hypomethylating agent, AzaC, in the culture medium first increased proliferation and formation of globular embryos but notably compromised embryo development and reduced embryo production. Therefore, we evaluated the effect of AzaC removal (recovery conditions) over subsequent embryo differentiation and embryo production. After 30 days in recovery conditions, AzaC-treated embryogenic masses spontaneously originated embryos, showing an increase of around 50% in embryo production with respect to untreated cultures (Figure 9). The removal of AzaC from culture media would imply a recovery of the catalytic activity of DNA methyltransferases. Thus, de novo methylation would take place, allowing the establishment of DNA hypermetylation, which may lead to embryo differentiation.
Our results showed that the treatment of embryogenic masses with AzaC contributes to enhance their embryogenic potential and embryogenesis initiation. These embryogenic lines show improved behavior after the removal of the drug and form much more embryos than untreated embryogenic lines. Moreover, the embryos formed after AzaC treatment and recovery showed a very good anatomy, similar to the quality embryos formed in control conditions, which have been reported to easily germinate and produce plantlets (Testillano et al. 2018a, 2018b).
These findings reveal for the first time the changes in global DNA methylation dynamics during SE in cork oak (Figure 11A). The promotion of cell reprogramming and higher embryogenic capacity provided by AzaC treatment, through DNA demethylation, along with the re-establishment of normal culture conditions, which permit de novo methylation by DNA methyltransferases (recovery conditions), give rise to an increase in somatic embryo production in cork oak (Figure 11B, C). The results showed that 100 μM AzaC treatment triggers a higher induction rate, more embryogenic masses and SE initiation than without treatment, while the recovery treatment further promotes differentiation into mature embryos. This new chemical strategy involves the transitory use of the small molecule AzaC at the stages of induction and proliferation, followed by its removal (Figure 11C), to get a temporal dynamics of global DNA demethylation/methylation that promotes cell reprogramming and SE initiation, leading to increased somatic embryo formation. These findings open new possibilities through transitory treatments of small molecule epigenetic modulators, as AzaC, to enhance SE yields for forestry breeding programs.

AUTHOR CONTRIBUTIONS
EC and EMDL performed most of the experimental work. YPP contributed to some immunofluorescence assays. MTS collected material from trees in the field, and helped to generate somatic embryogenesis cultures. EC and PST conceived, designed, and supervised the experimental work, analyzed the results, and wrote the manuscript. All authors have read and agreed to the published version of the manuscript.
ACKNOWLEDGEMENTS
We acknowledge support of the publication fee by the CSIC Open Access Publication Support Initiative through its Unit of Information Resources for Research (URICI).
FUNDING INFORMATION
This research was funded by MCIN/AEI/10.13039/501100011033 [grant number PID2020-113018RB-I00], and MCIN/AEI/10.13039/501100011033 and NextGenerationEU/PRTR [grant numbers TED2021-129633B-I00 and CPP2021-008750].
Open Research
DATA AVAILABILITY STATEMENT
Data sharing is not applicable to this article as all new created data is already contained within this article.


