Effect of ascorbate and hydrogen peroxide on hormone and metabolite levels during post-germination growth in wheat
Abstract
The modulation of hormone and metabolite levels by ascorbate (ASA) and hydrogen peroxide (H2O2) was compared during post-germination growth in shoots of wheat. Treatment with ASA resulted in a greater reduction of growth than the addition of H2O2. ASA also had a larger effect on the redox state of the shoot tissues as shown by the higher ASA and glutathione (GSH) levels, lower glutathione disulfide (GSSG) content and GSSG/GSH ratio compared to the H2O2 treatment. Apart from common responses (i.e., increase of cis-zeatin and its O-glucosides), the contents of several compounds related to cytokinin (CK) and abscisic acid (ABA) metabolism were greater after ASA application. These differences in the redox state and hormone metabolism following the two treatments may be responsible for their distinct influence on various metabolic pathways. Namely, the glycolysis and citrate cycle were inhibited by ASA and they were not affected by H2O2, while the amino acid metabolism was induced by ASA and repressed by H2O2 based on the changes in the level of the related carbohydrates, organic and amino acids. The first two pathways produce reducing power, while the last one needs it; therefore ASA, as a reductant may suppress and induce them, respectively. H2O2 as an oxidant had different effect, namely it did not alter glycolysis and citrate cycle, and inhibited the formation of amino acids.
1 INTRODUCTION
Plants are very sensitive to unfavorable environmental conditions during germination, which greatly influences the subsequent growth and development of seedlings (Pagano et al., 2019; Staszak et al., 2020). Thus, low temperature and anoxia greatly decreased the shoot and root growth of germinating maize and soybean and simultaneously the activity of glutathione S-transferase (GST) having an important role in the detoxification of organic peroxides (Kocsy et al., 2001). The reduction in the activity of antioxidants can result in oxidative stress as observed in germinating seeds of Pinus sylvestris based on the increased malondialdehyde (MDA) and H2O2 contents (Staszak et al., 2020). While severe oxidative stress disturbs the physiological and biochemical processes, a mild one can activate the various protective mechanisms leading to the reduction of the harmful effects of the reactive oxygen species (ROS). The effect of ROS such as H2O2 greatly depends on the strength of the treatment as it was shown in Arabidopsis (Claeys et al., 2014). The oxidative stress-induced damage derives from the imbalance between the formation and removal of ROS (Aazami et al., 2021; Considine & Foyer, 2021; Das & Mukherjee, 2021; Dietz et al., 2016; Liu et al., 2014; Pandey & Gautam, 2020; Shah et al., 2020; Suzuki et al., 2012; Xiao et al., 2021), which may result in the accumulation of ROS (Apel & Hirt, 2004; Ashraf et al., 2019; Mittler et al., 2004). For maintaining low intracellular ROS levels, plants have an efficient antioxidant defense system (Dvořák et al., 2021; Harbaoui et al., 2021; Hasanuzzaman et al., 2020; Noctor & Foyer, 2016). The major H2O2-detoxifying antioxidant enzymes are ascorbate peroxidase (APX), glutathione reductase (GR), dehydroascorbate reductase (DHAR), monodehydroascorbate reductase (MDHAR), GST and catalase (CAT), while ascorbate (ASA) and glutathione (GSH) are important non-enzymatic antioxidants (Ho et al., 2020; Lou et al., 2018; Ma et al., 2019). The redox system adjusts the metabolism of plants to the changing environmental conditions in an interplay with hormones to ensure the appropriate growth and development of plants (Xia et al., 2015). H2O2 has an important role in this interplay since it can affect hormone levels and it can be also formed during the metabolism of hormones (Černý et al., 2018). H2O2 can reach its cellular targets through aquaporins enabling its transport through the plasma membranes and H2O2 can affect its distinct targets through the specific ROS waves making possible the long-distance transmission of redox signals from cell to cell in the apoplast (Considine & Foyer, 2021; Smirnoff & Arnaud, 2019). In the control of the H2O2 levels, ASA and GSH play an important role. They can be taken up by roots and transported into the whole plant as shown in radioactive labeling experiments (Kocsy et al., 1996; Mozafar & Oertli, 1993). Ascorbate may enter the plant cells in its oxidized form as dehydroascorbate (DHA) through phosphate, glucose or other unidentified transport proteins and it is transported long distance in the phloem (Horemans et al., 2000; Smirnoff, 2018).
It is widely demonstrated that the central metabolic pathways, including the synthesis of amino acids, starch and lipids, are under redox control; therefore, the stress-induced changes in the ROS and antioxidant levels play an important role in their adjustment to the actual environmental conditions (Borbély et al., 2022; Geigenberger & Fernie, 2014). Various studies demonstrated that oxidative stress modified the metabolic profile in different plant species (Hashim et al., 2020; Savchenko & Tikhonov, 2021; Yang et al., 2018). The amounts of most free amino acids and several sugars including sucrose, glucose, fructose, verbascose, stachyose and raffinose increased under oxidative stress. Conversely, the methionine (Met), glutamic acid (Glu) and asparagine (Asn) contents and the levels of certain tricarboxylic acid cycle compounds (isocitrate, succinate, malate and 2-oxoglutarate) decreased during stress. The metabolic changes after oxidative stress suggest the rerouting of glycolytic carbon flow into the oxidative pentose phosphate pathway (OPPP) in order to provide NADPH for the ASA-GSH cycle (Obata & Fernie, 2012). The methyl viologen-induced oxidative stress resulted in the reprogramming of carbon metabolism as indicated by the inhibition of the anabolic pathways (e.g., Calvin cycle) and the stimulation of catabolic ones (e.g., OPPP) in Arabidopsis (Scarpeci & Valle, 2008). A study with rice cell suspension culture revealed that oxidative stress caused by menadione increased the amount of amino acids and decreased that of several sugars including fructose 6-phosphate (fructose 6-P) and glucose 6-phosphate (glucose 6-P) (Ishikawa et al., 2010). Greater amounts of organic and amino acids were observed in catalase-deficient Arabidopsis mutants with increased H2O2 levels compared to wild type plants (Noctor et al., 2015). The oxidative stress-dependent changes in metabolism of amino acids and carbohydrates were also shown at protein and transcript levels in H2O2-treated rice and wheat, respectively (Li et al., 2011; Wan & Liu, 2008). Additionally, foliar application of ASA stimulated the accumulation of free amino acids and soluble carbohydrates in flax cultivars (El-Bassiouny & Sadak, 2014). The effect of ROS and antioxidants on metabolism may be mediated in an interplay with plant hormones since their accumulation was accompanied by changes in the level of ABA, auxin (IAA), CK, jasmonates (JA), and salicylic acid (SA) (Hasanuzzaman et al., 2018; Wu et al., 2015; Yu et al., 2020). The plant hormones can control the level of superoxide radical and H2O2 through their effect on NADPH oxidases and peroxidases, respectively (Xia et al., 2015). However, compared to them, ROS can also be upstream in the regulatory pathways (Černý et al., 2018).
In plants, various oxidants and reductants including H2O2 and ASA profoundly influence the redox homeostasis at cellular level by modulating various signaling and transduction pathways at all developmental stages including germination and post-germination growth (Chebrolu et al., 2012; Considine & Foyer, 2021; Kocsy et al., 2013; Li et al., 2013; Nath et al., 2016; Smirnoff, 2011, 2018; Smirnoff & Arnaud, 2019). An increase of ASA content was observed during imbibition in Pinus pinea L. seeds due to the induction of its synthesis (Tommasi, 2001). A simultaneous increase in GSH content derived from the GSSG reduction, which was the result of the activation of APX and GR. The greater level of ASA and GSH could increase the efficiency of the ASA-GSH cycle and the germination. Correspondingly, GSH-treatment of Acer saccharinum seeds improved their germinability due to the activation of GST removing toxic peroxides and DHAR ensuring ASA regeneration (Kalemba & Ratajczak, 2018). A reduced membrane damage was shown by a lower electrolyte leakage and lipid peroxide level despite the greater H2O2 content. The moderate increase in H2O2 content may be important because of its signaling role during germination and due to the mobilization of stored proteins through oxidative modifications (Wojtyla et al., 2016). Indeed, the requirement for ROS levels for germination was corroborated in Avicennia marina (Forssk.) Vierh. and Trichilia dregeana Sond., since there were positive correlations between germination and ROS levels, water uptake and its inhibition by ROS scavengers (Moothoo-Padayachie et al., 2016). The importance of ASA and H2O2 in the control of germination and post-germination growth was also confirmed through treatment of seeds by them. Pretreatment with ASA improved the germination of fenugreek and alfalfa seeds during saline stress conditions (Behairy, 2012; Chen et al., 2021) and that of winter wheat (in 0.3 mM concentration) under low-temperature stress (Shah et al., 2019). In contrast, the higher (100 mM) concentration of ASA repressed the germination of wheat (Ishibashi & Iwaya-Inoue, 2006). Pretreatment with H2O2 improved the germination and the post-germination growth of pea seedlings in a concentration-dependent manner. Both ASA and H2O2 may affect metabolism during germination and post-germination growth through their effect on the GSH-dependent redox environment in the tissues and cells. Correspondingly, the hot steam treatment-induced change in the GSSG/GSH ratio was accompanied by the increase in the amount of several amino acids (especially cysteine and serine), sugars (ribose, glucose), and organic acids (glycerate, succinate) in germinating wheat seeds (Gerna et al., 2018).
Although there are numerous studies investigating physiological and biochemical effects of ASA and H2O2 in plants, their proposed specific roles in the control of hormone levels and metabolite profile were not investigated simultaneously during early post-germination growth of wheat.
2 MATERIALS AND METHODS
2.1 Experimental material, ASA and H2O2 treatments
Seeds of wheat (Triticum aestivum L.) cultivar Chinese Spring were germinated in Petri dishes for 5 days at 25°C in water, in 5 and 10 mM ASA solution or in 3 and 5 mM H2O2 solution and the post-germination growth was studied. These experimental conditions were determined in preliminary experiments in which the effects of several concentrations (0, 1, 2, 5, 10, and 20 mM) and treatment durations (3, 5, 7 days) were compared. The applied concentrations of the two compounds were also selected from this range in our previous study and they did not induce great changes in the endogenous ASA and H2O2 levels (Asghar et al., 2022). The germination rate was 90% both in the presence and absence of ASA and H2O2. Sampling of shoots for biochemical, physiological and molecular measurements was done at the end of the treatments. The experiments were repeated three times with three parallels. For each parallel eight plants were used and the growth parameters of each of them were measured.
2.2 H2O2 content detection
The H2O2 determination was done by the FOX1 method in a colorimetric reaction, using a spectrophotometer according to a previous protocol (Kellős et al., 2008). The reaction was based on the H2O2-dependent oxidation of ferrous ion to ferric ion and the latter one was detected by xylenol orange. The plant tissue (100 mg) was homogenized in 500 μL of 10% H3PO4. This step was followed by centrifugation at 15,000g for 15 min at 4 °C. Afterwards, 50 μL supernatant added into 950 μL FOX1 solution. After keeping the samples at room temperature for 30 min in the dark, read the absorbance at 560 nm by using spectrophotometer (Varian, Middelburg, The Netherlands).
2.3 Enzyme activity determination
The samples were ground with liquid nitrogen. Afterwards, 1 mL of 50 mM MES/KOH (pH 6) buffer containing 1 mM ASA, 40 mM KCl and 2 mM CaCl2 was added to the ground samples (200 mg FW) (Murshed et al., 2008). The ascorbate peroxidase (APX) activity was measured in 50 mM potassium phosphate buffer (pH 7) containing 0.25 mM ASA, 5 mM H2O2 and 50 μL extract in a total volume of 1 mL. The other three enzymes of the ASA-GSH cycle (GR, DHA and MDHAR) were measured using 50 mM Hepes buffer (pH 7) and 50 μL plant extract in a total volume of 1 mL. Besides these components, the reaction mixture for dehydroascorbate reductase (DHAR) contained 0.1 mM EDTA, 2.5 mM GSH and 0.2 mM dehydroascorbate. In the case of monodehydroascorbate reductase (MDHAR), 2.5 mM ASA, 0.25 mM NADPH and 1 U ascorbate oxidase were added to the reaction mixture. For the glutathione reductase (GR) measurement, 0.5 mM EDTA, 0.25 mM NADPH and 0.5 mM GSSG were used. The GST and catalase (CAT) activities were detected according to a method described earlier (Soltész et al., 2011). The activities of all the aforementioned enzymes are presented on a protein basis that was determined according to Bradford (1976). A Cary 100 UV–visible spectrophotometer (Varian, Middelburg, The Netherlands) was used for the determination of all activities.
2.4 Analysis of thiols
The pulverization of fresh samples (200 mg) was done with liquid nitrogen, which was followed by the addition of 1 mL 0.1 M HCl. The non-protein thiols and the corresponding disulfide forms were measured according to an earlier report (Gulyás et al., 2017). The detection of the total thiol content was performed after the reduction of the disulfides with dithiothreitol and derivatization with monobromobimane. For the detection of disulfides, reduced thiols were blocked with N-ethylmaleimide and the surplus was removed by toluene. The subsequent steps were similar to those described for total thiols. Reverse-phase HPLC (Waters, Milford, MA, USA) was used for the separation of cysteine (GSH precursor), cysteinylglycine (CysGly), hydroxymethylglutathione (hmGSH, a homolog of GSH in Poaceae) and GSH. Their amounts were determined by a W2475 scanning fluorescence detector (Waters, Milford, MA, USA) at 380 nm excitation and 480 nm emission wavelengths. The reduced thiol levels were calculated as the difference between the amounts of the total thiols and the disulfide forms.
2.5 Analysis of ascorbate and dehydroascorbate
The samples (500 mg) were ground in liquid nitrogen, which step was followed by the extraction with 3 mL of 1.5% meta-phosphoric acid. After centrifugation, the amount of total ascorbic acid (ASA + DHA, reduced + oxidized) was measured after reduction by dithiothreitol and the amount of ASA directly by HPLC using an Alliance 2690 system equipped with a W996 photodiode array detector (Waters, Milford, MA, USA). The DHA content was calculated by subtracting the amount of reduced ASA from total ascorbic acid content (Szalai et al., 2014).
2.6 Hormone analysis
Shoot samples (ca. 10 mg FW) of wheat seedlings were homogenized and extracted with 100 μL 50% acetonitrile solution. The following isotope-labeled standards were added at 1 pmol per sample: 13C6-IAA (Cambridge Isotope Laboratories); 2H4-SA (Sigma–Aldrich); 2H3-PA, 2H3-DPA (NRC-PBI); 2H6-ABA, 2H5-JA, 2H5-tZ, 2H5-tZR, 2H5-tZRMP, 2H5-tZ7G, 2H5-tZ9G, 2H5-tZOG, 2H5-tZROG, 15N4-cZ, 2H3-DZ, 2H3-DZR, 2H3-DZ9G, 2H3-DZRMP, 2H7-DZOG, 2H6-iP, 2H6-iPR, 2H6-iP7G, 2H6-iP9G, 2H6-iPRMP 2H2-GA19, (2H5)(15N1)-IAA-Asp, and (2H5)(15N1)-IAA-Glu (Olchemim). The extracts were centrifuged at 4°C and 30,000g. The supernatants were applied to SPE Oasis HLB 96-well column plates (10 mg/well; Waters) activated with 100 μL methanol and then eluted with 100 μL 50% acetonitrile using Pressure + 96 manifold (Biotage). The pellets were re-extracted in 100 μL portions of 50% acetonitrile, centrifuged and applied again to the column plates. Phytohormones in each eluate were separated on Kinetex EVO C18 column (2.6 μm, 150 × 2.1 mm, Phenomenex). Mobile phases consisted of A—5 mM ammonium acetate and 2 μM medronic acid in water and B—95:5 acetonitrile:water (v/v). The following gradient was applied: 5% B in 0 min, 5%–7% B (0.1–5 min), 10%–35% B (5.1–12 min) and 35%–100% B (12–13 min) followed by a 1 min hold at 100% B (13–14 min) and return to 5% B. Hormone analysis was performed with an LC/MS system consisting of UHPLC 1290 Infinity II (Agilent) coupled to 6495 Triple Quadrupole Mass Spectrometer (Agilent), operating in MRM mode, with quantification by the isotope dilution method. Data acquisition and processing was performed with Mass Hunter software B.08 (Agilent).
2.7 Metabolite profiling
The extraction of plant material was carried out with 60 v/v % MeOH twice, and it was followed by the addition of internal standard (1 mg mL−1 ribitol solution) and 90 v/v % MeOH (Canellas et al., 2019). Then the samples were kept at room temperature for 5 min and centrifuged at 10,000g for 5 min at 4°C. Afterwards, the supernatants were collected and aliquots (150 μL) were dried under vacuum. For GC analyses, the derivatization was carried out with methoxyamine hydrochloride (20 mg mL−1 in pyridine) at 37°C for 90 min. Then, N-Methyl-N-trimethylsilyl-trifluoroacetamide was added to the reaction mixture followed by its incubation for 30 min at 37°C. The samples were injected into the LECO Pegasus 4D GCxGC TOFMS (LECO), which consisted of a 1.5 m column (Rxi-17Sil MS phase) and a 30 m column (Rxi-5MS phase). While keeping the samples at 230°C, 1 μL of the sample was injected onto the column in split mode. He was used as a carrier gas with the constant flow rate of 1 mL min−1. The transfer line and the ion source were kept at 250°C. Initially, the thermal system was started with 70°C for 3 min. Then the temperature was increased to 320°C at 7°C min−1 rate, which was kept for 5 min with 3.25 s modulation period in the 2D GC mode. The standards and Kovats retention index were used for the detection of metabolites. Thereafter, the LECO ChromaTOF program was applied for GC analyses, data evaluation and normalization for each metabolite. Subsequently, the ChromaTOF 4.72 was used with Finn and Nist databases.
2.8 Determination of free amino acids
The extraction of samples (300 mg) was done with 10% trichloroacetic acid during 1 h agitation on a shaker at room temperature (Gulyás et al., 2014). After filtration through a 0.2 μm pore membrane filter, detection of samples was done by an automatic amino acid analyzer (Ingos Ltd., Czech Republic) equipped with an Ionex Ostion LCP5020 cation exchange column. Li+-citric buffer system (Ingos Ltd., Czech Republic) was used for the stepwise separation of free amino acids.
2.9 Gene expression analysis
Direct-zolTM RNA Miniprep Kit (Zymo Research) method was used for the total RNA extraction. According to the instructions of the supplier, reverse transcription (RT) was performed using oligo (dT)15 primer (Promega) and M-MLV reverse transcriptase. Transcript levels were determined by qRT-PCR using a CFX96 TouchTM Real-Time PCR Detection System (Bio-Rad, Hercules, CA, USA). The specific primers are listed in (Table S1). Relative gene expressions [2−ΔΔCq, where ΔCq = Cq(ref) − Cq(target)] were calculated using the Ta30797 gene as a reference (Livak & Schmittgen, 2001; Paolacci et al., 2009). The absence of DNA contamination was checked by using RNA samples without reverse transcription for qRT-pCR.
2.10 Statistical analysis
Significant differences were calculated by one-way analysis of variance (ANOVA) using the SPSS statistics (16.0) software. Least significance difference (LSD) test was applied to compare means at 5% probability level. Duncan's Multiple Range Test (DMRT) used as a post hoc mean-separation test (p < 0.05) using SPSS statistics (16.0) software. By the correlation analysis, the magnitude of the significant correlations was interpreted according to previously described method (Guilford, 1950).
3 RESULTS
3.1 Effect of ASA and H2O2 on growth parameters
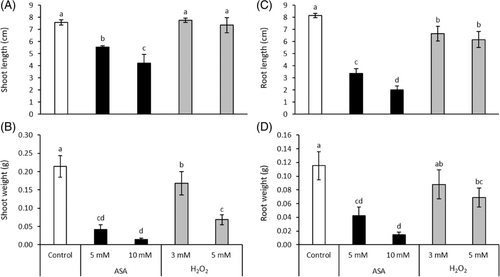
The post-germination growth was inhibited by both the reductant (ASA) and the oxidant (H2O2) as shown by the growth parameters (Figure 1). This effect was more pronounced in the case of the greater concentrations of the applied compounds. ASA treatment resulted in a much greater reduction of the length and fresh weight of shoots and roots than H2O2. The 10 mM ASA reduced the shoot and root length by 44% and 75%, respectively. Treatment with 10 mM ASA decreased the fresh weight of the shoots by 93% and that of roots to 87%. These values were 67% and 40% for 5 mM H2O2, indicating its weaker effect compared to ASA.
3.2 ASA- and H2O2-dependent changes in the endogenous H2O2 and ASA contents
The endogenous H2O2 content was not affected significantly by the applied treatment except for the slight increase after the addition of 5 mM ASA (Figure S1).
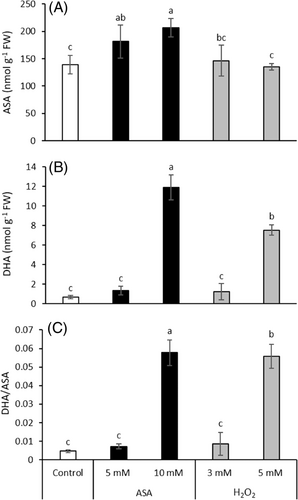
The endogenous ASA level was significantly raised by the ASA treatment (Figure 2A). However, addition of H2O2 did not change its amount. The alterations in DHA content and the DHA/ASA ratio exhibited similar tendency since both of them were only increased by the higher concentration of ASA and H2O2. In the case of DHA content, 18- and 11-fold increase was induced by treatment with 10 mM ASA and 5 mM H2O2, respectively (Figure 2B). A 12-fold raise in the DHA/ASA ratio was observed after the addition of both compounds (Figure 2C).
3.3 Influence of ASA and H2O2 on glutathione metabolism
While both ASA concentrations reduced the Cys (GSH precursor) content by about 50%, no change was induced in its level by H2O2 application (Figure 3A). The amount of CySS was significantly influenced only by 5 mM H2O2, which treatment resulted in its 2-fold increase (Figure 3B). Regarding the CySS/Cys ratio, it was only affected by 5 mM ASA and H2O2 treatments (Figure 3C).
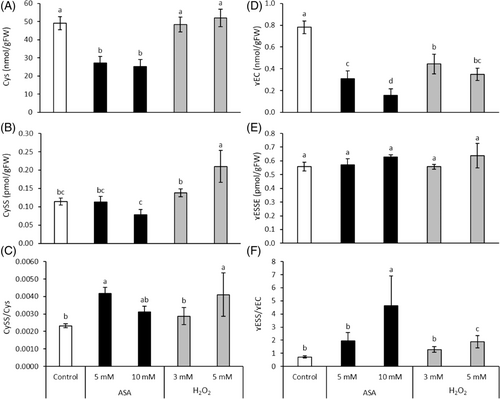
The amount of γ-glutamylcysteine, the intermediate product of GSH synthesis, was greatly reduced by ASA and in a smaller extent by H2O2 (Figure 3D). The level of γ-glutamylcystine (its oxidized form) did not change during the treatments (Figure 3E). The ratio of the two forms exhibited a similar change as described for γ-glutamylcysteine (Figure 3F).
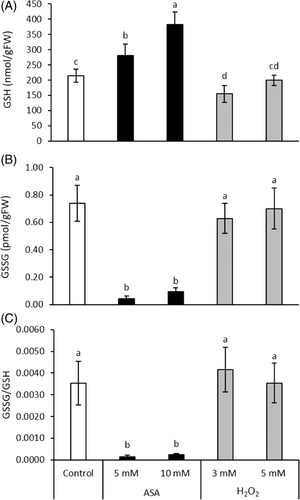
The GSH content was increased by ASA, which change was 2-fold after the addition of 10 mM ASA (Figure 4). However, it was decreased by 27% during the treatment with 3 mM H2O2. Following the ASA treatment, the GSSG content and the GSSG/GSH ratio were decreased by about 90%, while H2O2 did not affect these parameters significantly (Figure 4).
In the case of hmGSH (homolog of GSH) content, 38% and 56% reduction was induced by 5 mM and 10 mM ASA application, respectively (Figure S2a). However, H2O2 did not influence its level. The hmGSSG amount was slightly increased only by 5 mM H2O2 (Figure S2b). The hmGSSG/hmGSH ratio exhibited 2- and 3-fold increase after 5 mM and 10 mM ASA addition, respectively (Figure S2c).
The amount of cysteinylglycine (degradation product of GSH) was not affected by the treatments (Figure S2d). The amount of cystinylglycine (oxidized form) and its ratio to cysteinylglycine was reduced by 10 mM ASA (Figure S2e and S2f).
3.4 ASA- and H2O2-dependent changes in antioxidant enzyme activities
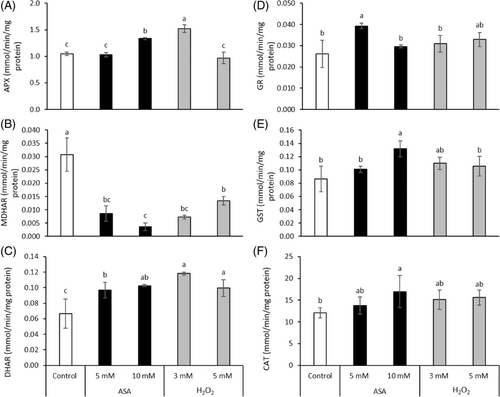
The APX activity was induced by the addition of 10 mM ASA and 3 mM H2O2 (Figure 5A). The reduction of MDHAR activity by the various treatments ranged from 56% to 88% (Figure 5B). The DHAR activity was significantly enhanced by the addition of both redox agents (Figure 5C). A significant raise in GR activity was only noticed after 5 mM ASA addition (Figure 5D). The activity of GST and CAT was increased by 10 mM ASA, while the other treatments did not affect it (Figure 5E,F).
3.5 Modification of hormone metabolism by ASA and H2O2
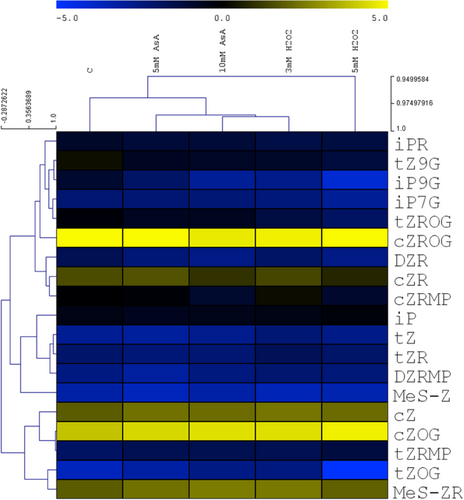
Both treatments affected the levels of cytokinins and their derivatives as shown by the separate cluster of control samples in the hierarchical clustering (Figure 6). The levels of active cytokinins associated with intensive growth stimulation (tZ and iP) were not significantly affected, but the content of the stress-related active cytokinin (cZ) was enhanced. The cytokinin ribosides, O- and N-glucosides, were decreased with the exception of cZOG and in the case of 5 mM ASA also of cZR. Promotion of cZ biosynthesis, estimated via the level of cytokinin precursor (cytokinin cZ riboside phosphate), exhibited stimulation in the case of 3 mM H2O2.
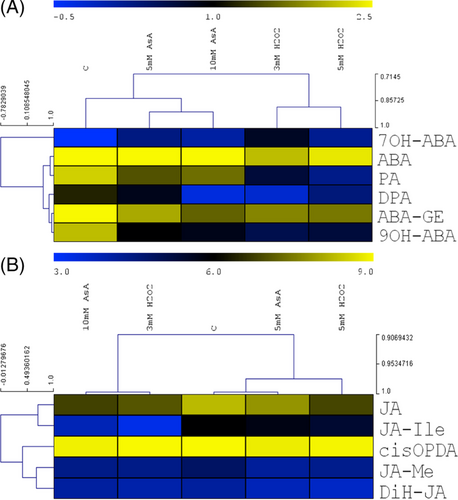
Although the ABA levels were slightly diminished by the applied treatments, the amounts of several ABA metabolites (PA, DPA, ABA-GE, 9OH-ABA) were decreased (Figure 7A). Only 7OH-ABA was elevated by the treatments. Jasmonic acid (JA) and its bioactive form (JA-Ile) were clustered separately from the other JA metabolites based on the effect of ASA and H2O2 (Figure 7B). The JA content was decreased by all treatments, the greatest change (74% decrease) was induced by 5 mM H2O2 (Figure 7B). A great reduction (77% and 84%) of JA-Ile content was observed after treatment with 10 mM ASA and 3 mM H2O2, respectively.
The amounts of auxins and the related metabolites were affected by both treatments as indicated by the separate clusters of control and treated plants (Figure S3a). The levels of highly active auxin indole-3-acetic acid (IAA) and low active auxin phenylacetic acid (PAA) were diminished, especially by 5 mM H2O2. The content of indole-3-acetamide, the precursor of IAA, was greatly reduced by all treatments. The IAA inactive metabolites were decreased, with the exception of oxIAA-GE, which increased after H2O2 treatment. Among the studied phenolics, the amount of salicylic acid was decreased by 70% (Figure S3b).
3.6 Modifications of carbohydrate and organic acid levels by ASA and H2O2
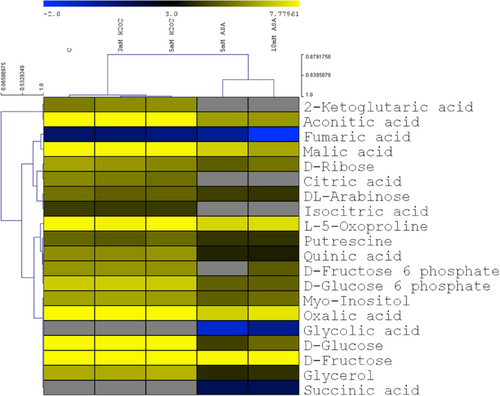
The amounts of carbohydrates, organic acids and their derivatives were greatly reduced by ASA, but H2O2 exhibited only small or no effects on these compounds (Figure 8). Generally, this change was more prominent in the first cluster containing 2-ketoglutaric acid, aconitic acid, fumaric acid, malic acid, d-ribose, citric acid, dl-arabinose and isocitric acid. Among them, fumaric acid and malic acid contents were decreased by about 50% following 5 mM ASA treatment and by more than 70% after 10 mM ASA addition. Interestingly, this decrease was so considerable in the case of 2-ketoglutaric acid, citric acid and isocitric acid that they were not detectable. In the other cluster, the amounts of most compounds were also lower after the ASA treatment except for the increase of glycolic acid and succinic acid contents, which were only detectable after the ASA treatment.
3.7 Effect of ASA and H2O2 on free amino acids
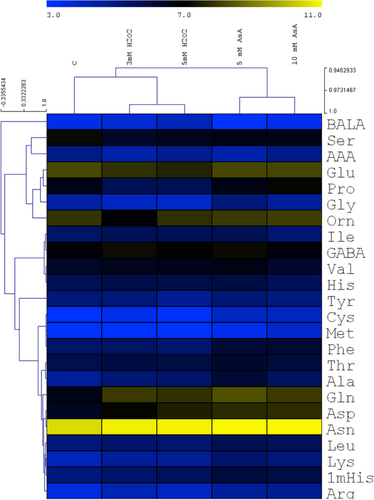
ASA and H2O2 differently affected the free amino acid levels as shown by their separate groups in the hierarchical cluster analysis (Figure 9). Although Glu and Pro, as well as Asp and Asn were grouped together, most amino acids of the same biosynthetic family are in different clusters. Interestingly, 5 mM ASA greatly increased the amount of several amino acids compared to the control plants and the other treatments. A large increase in the level of Gln and Asp was observed after the various treatments, which ranged from 2-fold to 3-fold. The Ser content was decreased in turn by both ASA and H2O2 by about a third. The amount of Glu was reduced markedly (32%) only by 5 mM H2O2. Both H2O2 treatments resulted in a much lower Pro level (by 50%) but ASA did not affect it. The amount of Glu, Pro, Phe, Thr, Leu, and 1-Methylhistidine (1mHis) was greater after ASA addition than following the H2O2 treatment.
3.8 Transcriptional regulation of metabolism by redox treatments
The separated cluster of the untreated seedlings indicates the significant effect of the redox treatments on the transcriptional regulation of antioxidants and amino acid metabolism (Figure 10). ASA and H2O2 decreased the expression of most genes but some of them were activated or not influenced by the two compounds. There was a great difference between the effects of 10 mM ASA and 5 mM H2O2 on the transcript levels.
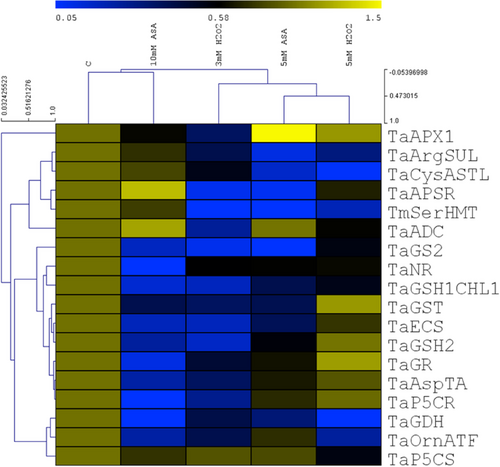
Regarding the individual transcripts, there were two main clusters. In the first large cluster, mostly the Arg and Cys metabolism-related enzymes were grouped together and their expression was inhibited by the treatments, except for 10 mM ASA. This treatment induced a 2-fold upregulation of TaAPSR and TaADC. In the second large cluster most genes are related to GSH and Pro metabolism and their transcription was also lower after the addition of the two compounds, except for 5 mM H2O2 inducing a 2-fold upregulation of TaGR and TaGST. The greatest induction (3-fold) was observed in the case of the TaAPX1 following 5 mM ASA application.
4 DISCUSSION
4.1 Different effects of ASA and H2O2 on the redox system during germination
H2O2 and ASA (presumably in form of DHA) were taken up and transported by the mechanisms presented in the introduction (Considine & Foyer, 2021; Horemans et al., 2000; Smirnoff, 2018; Smirnoff & Arnaud, 2019), since they affected the growth of the plants and several studied antioxidants. Although they reduced the growth parameters, the roots and shoots did not show visible injuries despite the applied millimolar concentrations which were also chosen in our previous studies (Asghar et al., 2022). These results show that probably only a small percentage of their applied amount was taken up by the plants. In addition, the endogenous nanomolar H2O2 and ASA levels were only slightly affected after the treatment with the reductant ASA and they remained unchanged after the treatment with the oxidant H2O2, which observation indicated the efficient maintenance of the tissue redox balance during post-germination growth in wheat. While in the case of H2O2 addition, the activation of some antioxidant enzymes (APX, DHAR) was sufficient for this purpose, H2O2 levels could be sustained after ASA treatment by the induction of most enzymes (APX, DHAR, GR, GST, Cat) and the accumulation of ASA and GSH. The activation of APX and DHAR could also ensure the regeneration of ASA from DHA (if ascorbate would have been taken up in its oxidized form) as shown by the increased endogenous ASA level after ASA treatment. The increased GSH content after ASA treatment derived from its greater synthesis as shown by the decrease of the levels of its precursors, Cys and γEC and the unchanged amount of its degradation product, CysGly. In addition, ASA greatly reduced the GSSG content and GSSG/GSH ratio in contrast to their unaffected values after H2O2 addition. These results indicate that the two compounds have different effects on the GSH-dependent redox environment, as shown by the great differences (direction, level) in the correlations between the examined components of the antioxidant system after the two treatments (Table S2). Interestingly, the greater concentrations of ASA and H2O2 induced a great increase of the DHA content and DHA/ASA ratio, while such large oxidation of GSH was not observed (in fact, it even decreased after ASA addition). This indicates that H2O2 was reduced by ASA, at least partly, independently of the ASA-GSH cycle (Mittler et al., 2004). Although both compounds affected the antioxidants at transcriptional level, there was no clear relationship between the transcript and metabolite levels or enzyme activities.
Similarly to the simultaneous increase in ASA and GSH contents after ASA treatment, a coordinated adjustment of ASA-GSH cycle components was found in poplar (Foyer et al., 1995). Namely, the ASA content also increased after the overexpression of GR. As observed in wheat, ASA treatment upregulated the activities of several antioxidant enzymes including superoxide dismutase (SOD), peroxidase (POD) and CAT in other plant species, too (Athar et al., 2009; Wang et al., 2018; Xu et al., 2015). Interestingly, some of them were inhibited by ASA treatment, such as MDHAR in wheat in the present study and DHAR in the ascorbate-deficient vtc-1 Arabidopsis mutant (Huang et al., 2005). While H2O2 treatment did not influence the GSH level in wheat, its addition modified the GSH content in mung bean (Yu et al., 2003). These results indicate that ASA and H2O2 have different effects on the redox system in the various plant species and may have a specific role in its adjustment to the changing environmental conditions.
Although the efficient activation of the antioxidant system by ASA and H2O2 treatment is indicated by the slight or no change in the endogenous H2O2 levels, the regrouping of energy and reducing power for the protective mechanisms resulted in growth decrease. This process was much greater after ASA treatment as shown by the increased ASA and GSH contents, as well as CAT and GST activities and the decreased GSSG level compared to H2O2 addition after which these parameters remained unchanged. Correspondingly, the reduction in growth was much greater in the case of ASA treatment compared to the H2O2 application. Thus, the two compounds resulted in different changes in the redox system, which could be responsible for their different effects on glycolysis, citrate cycle and amino acid metabolism. In contrast to the growth inhibition after ASA and H2O2 treatments in the present experiments, the lower concentrations of the various reductants or oxidants can activate the antioxidants without inhibiting the growth and development during germination (Barba-Espin et al., 2010; Chen et al., 2021; Shah et al., 2019; Wojtyla et al., 2016). Thus, treatment with ASA increased the salt and low temperature tolerance of alfalfa and wheat, respectively (Chen et al., 2021; Shah et al., 2019). Similarly, H2O2 treatment also improved the stress tolerance during germination by the activation of the antioxidant enzymes as observed in the case of salinity in tartary buckwheat (Yao et al., 2021).
4.2 ASA and H2O2 affect hormone metabolism in wheat during germination
The observed negative effect of ASA and H2O2 on the early seedling growth during germination may be mediated by various plant hormones in wheat, as indicated by changes in the contents of the active hormones as well as their metabolites. This assumption is based on the involvement of ASA as an essential co-factor in the gibberellin (GA), ethylene (ETH) and ABA biosynthesis (Barth, 2006; Ye et al., 2012; Zhang, 2013). In addition, ASA was found to interact with plant hormones affecting numerous signal transduction pathways related to plant growth and development (Pastori et al., 2003). Like in wheat, H2O2 also modified the metabolism of plant hormones including ABA, IAA, JA, and SA in pea seedlings (Barba-Espin et al., 2010). The effect of H2O2 level and the redox status of GSH on jasmonic acid signaling was shown in Arabidopsis plants having mutations in CAT and GR genes (Mhamdi et al., 2010). Although the metabolism of the studied hormones was affected by both compounds, their different effects were only observed in the case of cytokinins and ABA. Similar repression of SA and JA metabolism was observed after both treatments.
Elevation of the stress-related active cytokinin cZ seems to reflect mild/moderate oxidative stress/redox disbalance caused by both treatments (Gajdošová et al., 2011; Prerostova et al., 2022). Interestingly, the amounts of cytokinin ribosides, O- and N-glucosides were greatly reduced by ASA and H2O2 (with exception of 5 mM ASA). Diminished deactivation of cytokinin reversible conjugates without a corresponding increase in the level of cytokinin bases in wheat may indicate suppression of cytokinin biosynthesis under disturbance of redox homeostasis. Similarly to cytokinins, the decrease in the level of ABA-glucose ester after ASA and H2O2 treatments was not accompanied by a corresponding change in the ABA content. However, a longer or stronger treatment with the two compounds may exhibit a stronger influence on the level of the active hormones. Accordingly, a strong correlation between the concentration of the added H2O2 and the decreases in ABA and zeatin riboside (ZR) contents was observed in pea seedlings (Barba-Espin et al., 2010). The different effects of ASA and H2O2 on the redox state of shoot tissue coincided with their distinct influence on the hormone metabolism as shown for several metabolites related to cytokinins (isopentenyladenine-9-glucoside, trans-zeatin-O-glucoside) and ABA (9-hydroxy-ABA, phaseic acid) having greater decrease after H2O2 addition compared to ASA treatment. Furthermore, more negative correlations were found between the levels of the studied antioxidants and hormones or related metabolites after ASA treatment compared to the addition of H2O2 (Table S2). These results indicate the redox control of hormone metabolism, which was shown through the integration of ethylene and abscisic acid modulation by ASA in Arabidopsis (Yu et al., 2019).
Besides, the effect of ASA and H2O2 on hormones, the control of these compounds by hormones was also observed in plants (Černý et al., 2018; Tognetti et al., 2017; Xia et al., 2015). Thus, cytokinins decreased H2O2 levels through their effects on GSH in rose, which resulted in initiation of bud outgrowth (Porcher et al., 2021). In addition, cytokinins promoted CAT and APX activities and reduced ROS levels in wheat (Lubovská et al., 2014; Prerostova et al., 2022; Zavaleta-Mancera et al., 2007). Modulation of cytokinin levels was found to affect the antioxidant enzyme system both in control and stress conditions (Lubovská et al., 2014). In contrast to cytokinins, ABA treatment resulted in H2O2 production in rice leaves (Hung & Kao, 2005). JA exhibited similar effects in wheat leaves (Dai et al., 2015). The relationship between ABA and H2O2 during the control of antioxidant capacity was shown in cucumber (Shu et al., 2016). ASA levels are also controlled by plant hormones, since methyl jasmonate induced ASA synthesis at transcriptional level in Arabidopsis and tobacco Bright Yellow-2 (BY-2) suspension cells (Wolucka et al., 2005). Thus, not only the redox compounds influence the level of hormones but the latter ones also control the former ones indicating crosstalk and a mutual regulation between them.
4.3 Modification of the metabolite profile by ASA and H2O2 during germination
While H2O2 did not influence the GSH-dependent redox environment, ASA treatment shifted it into more reducing direction based on the increased GSH and decreased GSSG levels. This change in turn influenced the NAD(P)H-producing glycolysis and citrate cycle as indicated by the lower levels of several related metabolites (glucose, glucose 6-P, fructose 6-P, fumarate, malate, citrate, aconitate, isocitrate, 2-letoglutarate) after ASA treatment in contrast to their unchanged or slightly increased levels after H2O2 addition (Figure 11). In addition, more negative correlations were found between the levels of the investigated antioxidants and the metabolites of the glycolysis and citrate cycle after ASA addition compared to the treatment with H2O2 (Table S2). The observed metabolic alteration can be the result of the increased use of the intermediate of glycolysis and citrate cycle for amino acid synthesis, since the amount of several amino acids (Pro, Glu, Gln, Gly, Tyr, Phe, Arg) was greater after ASA treatment compared to the H2O2 addition. A corresponding difference in the expression of the related genes was not observed; therefore, the level of the amino acid is not controlled at the transcriptional level by the redox state of the leaf tissues. While the ASA-induced redox changes affected the amount of several organic acids in the citrate cycle in wheat, the latter alteration may also modify the redox environment in a feed-back way as supposed in higher plants (Igamberdiev & Eprintsev, 2016). In the ASA-associated control of glycolysis, ABA may also be involved based on the effect of ASA on ABA-related metabolites (phaseic acid, 9-hydroxy-ABA) in wheat and the interactions between ABA and plastidial glycolysis in Arabidopsis (Muñoz-Bertomeu et al., 2011). In addition, ABA signaling was suggested to fine-tune flux through the citrate cycle, which can modulate other metabolic processes in Arabidopsis (Yoshida et al., 2019). It has to be mentioned, that ABA has special effect on metabolism, since following foliar application it induced mainly the accumulation of organic acids related to the citrate cycle, and SA strongly increased in turn the amount of amino acids and carbohydrates in bentgrass (Li et al., 2016). Both hormones may be involved in the redox control of these metabolites in wheat based on the present results. This assumption is also confirmed by the close correlations between the hormone and metabolite levels (Table S2). Among them, they were more positive ones after ASA treatment. Interestingly, similar results were obtained for the correlations between the amounts of the various metabolites which shows the coordinated regulation of their synthesis and degradation.
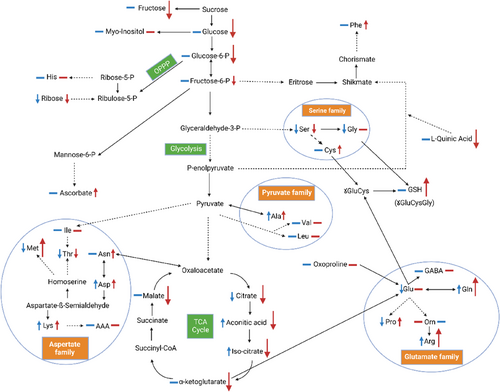
Besides the distinct effect of ASA and H2O2 on the component of glycolysis, citrate cycle and amino acid metabolism, their unique effect on other compounds can allow the special modulation of metabolism. Thus, the appearance of glycolate after ASA treatment in detectable levels may allow its use for synthesis of the GSH precursor (Gly). This latter change contributes to the increased GSH formation detected after ASA treatment. In addition, during the oxidation of glycolate to glyoxalate, H2O2 will be produced (Geigenberger & Fernie, 2014). Thus, glycolate can participate in the control of the tissue redox state in wheat as it was observed in Caenorhabditis elegans (Diez et al., 2021). Similarly to the organic acids of the citrate cycle, the level of oxalate was also reduced by ASA, which change can modulate the redox environment as observed for Sclerotinia sclerotiorum-secreted oxalate in tomato and tobacco (Williams et al., 2011). This alteration in turn may control various redox-responsive metabolic pathways.
The shift of the redox environment into a more reducing direction after ASA treatment compared to H2O2 addition was accompanied by a greater accumulation of several free amino acids. Among them Pro could be very important, since its synthesis is an NADPH-consuming process, while during Pro degradation NADPH will be formed (Alvarez et al., 2022). Thus, its formation results in more oxidizing redox environment. This process is also supported by the increased Glu and Gln levels (Pro precursors) after ASA treatment. Glu as a precursor of both Pro and GSH plays an important role in the interconnection of GSH- and Pro-dependent redox adjustment. Interestingly, treatment with Pro increased the ASA levels in chickpea indicating a mutual control between these two compounds (El-Beltagi et al., 2020). Since Pro can function as a signal molecule, the redox-dependent changes in its amount may influence gene expression and certain metabolic processes (Alvarez et al., 2022). ASA treatment also induced the accumulation of Arg, which is the precursor of polyamines having many regulatory functions. Although the formation of SA-related Phe formation was greater after ASA treatment compared to H2O2 treatment, such difference was not found in the SA levels after the two treatments. Interestingly, amino acid homeostasis and/or serine metabolism were suggested to be involved in the connections of ABA with primary metabolism (Muñoz-Bertomeu et al., 2011).
5 CONCLUSION
The greater reduction of the growth after ASA treatment compared to H2O2 addition can be the result of the shifting of the GSH-dependent redox environment into a more reducing direction. This alteration, in an interplay with the modified CK and ABA metabolism reduced the level of several metabolites of the glycolysis and citrate cycle that led to increased accumulation of free amino acids following ASA addition. However, the first two pathways were not or only slightly affected by H2O2, and the amino acid metabolism was repressed by it. ASA, as a reductant may suppress glycolysis and citrate cycle producing reducing powder, and it may induce amino acid synthesis using it. H2O2 as an oxidant had a different influence on these pathways; namely, it did not alter or only slightly affected glycolysis and citrate cycle, and inhibited the formation of most amino acids.
AUTHOR CONTRIBUTIONS
Radomira Vankova, Alena Gaudinova, Petre I. Dobrev: analysis of hormones; Gabriella Szalai: thiol and ASA measurements; Orsolya Kinga Gondor: metabolite profiling; Livia Simon-Sarkadi, Zsuzsa Mednyánszky: determination of free amino acids; Muhammad Ahsan Asghar: analysis of H2O2 and enzyme activities; Kitti Kulman: gene expression studies; Radomira Vankova, Gábor Kocsy, Muhammad Ahsan Asghar: writing the draft; Radomira Vankova, Gabriella Szalai, Livia Simon-Sarkadi, Gábor Kocsy provide funding acquisition. All authors: checking and correcting the manuscript.
ACKNOWLEDGMENTS
The authors wish to thank Mónika Fehér for her help in plant cultivation and sampling. This research was supported by the National Research, Development and Innovation Office (grant K131638, TKP2021-NKTA-06).
CONFLICT OF INTEREST STATEMENT
The authors declare that they have no conflict of interests.
Open Research
DATA AVAILABILITY STATEMENT
The data will be provided upon request to the corresponding author.


