Hydrogen peroxide potentiates defense system in presence of sulfur to protect chloroplast damage and photosynthesis of wheat under drought stress
Abstract
The involvement of hydrogen peroxide (H2O2) combined with sulfur (S) was studied in the protection of the photosynthetic performance of wheat (Triticum aestivum L.) under drought stress. The mechanisms of S-assimilation, the activity of antioxidants, glucose sensitivity, water and osmotic relations and abscisic acid (ABA) content were the focus. The combined application of 50 μM H2O2 and 100 mg S kg−1 soil (sulfur) resulted in a marked increase in S-assimilation and activity of antioxidant enzymes, with decreased glucose sensitivity and ABA content causing improvement in the structure and function of the photosynthetic apparatus under drought stress. The photosynthetic performance, pigment system (PS) II activity, and growth were improved conspicuously by H2O2 in the presence of S, as H2O2 induced S-assimilation capacity, the activity of antioxidant enzymes, and GSH synthesis under drought stress. Our study shows that H2O2 is more effective in the reversal of drought stress in the presence of S through its influence on S-assimilation, glucose sensitivity, and antioxidant system. These results provide evidence for the effectiveness of H2O2 in improving photosynthesis under drought stress in the presence of S.
Abbreviation
-
- ABA
-
- abscisic acid
-
- APX
-
- ascorbate peroxidase
-
- ATP-S
-
- ATP-sulfurylase
-
- DAS
-
- days after sowing
-
- GR
-
- glutathione reductase
-
- GSH
-
- reduced glutathione
-
- GSSG
-
- oxidized glutathione
-
- NPQ
-
- non-photochemical quenching
-
- P-SUE
-
- photosynthetic-sulfur use efficiency
-
- PS
-
- pigment system
-
- qP
-
- photochemical quenching
-
- ROS
-
- reactive oxygen species
-
- SOD
-
- superoxide dismutase
-
- WUE
-
- water use efficiency
1 INTRODUCTION
Drought with annual precipitation of about <400 mm and low soil moisture content is regarded as environmental stress in crop plants (Cruz de Carvalho, 2008, Sun et al., 2016, Cao et al., 2017, Bhuiyan et al., 2019). Jaleel et al. (2009) described drought stress as continuous depletion of water by evaporation or transpiration due to various atmospheric conditions that directly affect soil water content. According to the latest report of the Intergovernmental Panel on Climate Change (IPCC), drought stress will increase specifically in arid and semi-arid regions, and global average surface temperature is subjected to increase by 1.4–5.8°C with the increase in water deficit condition. It has been reported that approximately 45% of agricultural lands are affected by continuous or frequent drought stress conditions, leading to up to 30% loss of global production at the end of the year 2025 (Zhang, 2011). Drought stress exhibits detrimental effects on crop plant at the cellular and morphological level, depending on species, genotype, developmental stage, cell type and organ, sub-cellular compartment and severity of water loss. Those detrimental effects result in reduced photosynthetic pigments, leaf area, and leaf water potential and also lead to disruption of the balance between generation and quenching of the excess reactive oxygen species (ROS) (Rampino et al., 2006; Anjum et al., 2015; Battaglia et al., 2019).
Plants exposed to drought stress exhibit oxidative and osmotic stresses, which serve as a common response to adapt to these stress factors (Golldack et al., 2014). To quench the excess of ROS generated in cells, plants exhibit various enzymatic and non-enzymatic antioxidants, increased the accumulation of osmoprotectants and compatible solutes, which help the plants to obtain oxidative homeostasis (Porcel et al., 2003; Khan et al., 2013; Sekmen et al., 2014; Fatma et al., 2016; Pedranzani et al., 2016; Sehar et al., 2019; Hussain et al., 2020; Rather et al., 2020a, 2020b; Asgher et al., 2021). In addition to the natural defense mechanisms employed by the plants, which help them to withstand exposure of stress, exogenous supplementation of several bio-regulators and mineral nutrients are employed to improve drought stress tolerance.
Hydrogen peroxide (H2O2) considered as a toxic ROS responsible for damaging numerous cellular structures is now gaining importance as a potential signaling molecule involved in numerous physiological functions (Petrov and Breusegem, 2012; Nazir et al., 2020; Asgher et al., 2021). Reports have shown that H2O2 is a potential signaling molecule acting as a stress signal transducer that induces physiological functions for increasing photosynthetic and growth performance of plants under abiotic stress condition (Neill et al., 2002; Hung et al., 2005; Sun et al., 2016; Asgher et al., 2021). Supplementation of H2O2 mitigates abiotic stress through various physiological manifestation such as upregulating the activity of antioxidant enzymes, defense protein, and transcription factors, all these forming an integral component of the intracellular signal transduction (Gechev and Hille, 2005; Slesak et al., 2007; Sun et al., 2016; Nazir et al., 2020; Asgher et al., 2021).
Sulfur (S) is one of the essential mineral nutrients. It has now been recognized to regulate photosynthesis of plants growing under optimal and stressful environments and it plays a significant role in the mitigation of abiotic stress (Nazar et al., 2011; Khan et al., 2013; Jahan et al., 2019). Sulfur is the constituent of many imperative metabolites such as amino acids (methionine [Met] and cysteine [Cys]), proteins and various antioxidants (reduced glutathione [GSH]), glucosinolates, vitamins, co-enzyme A (CoA), thioredoxin systems. These S-containing compounds have shown potential in mitigating stress effects in crop plants (Takahashi et al., 2011; Iqbal et al., 2013; Jahan et al., 2019). It has been reported that S plays a significant role in the electron transport system and the photosynthetic apparatus. The deficiency of S has been related to a decrease in the content and activity of ribulose 1,5-bisphosphate carboxylase/oxygenase (Rubisco) (Lunde et al., 2008; Honsel et al., 2012; Anjum et al., 2015; Jahan et al., 2019). Sulfur nutrition has been shown to play a significant role in defense mechanisms and salt stress tolerance (Nazar et al., 2011).
Keeping in view the importance of H2O2 as a signaling molecule and S as an essential mineral nutrient, both involved in the stress acclimation, the present research was aimed to evaluate the effectiveness of H2O2 in drought tolerance in wheat in the presence of S through observing S-assimilation, antioxidant metabolism, abscisic acid (ABA), and glucose sensitivity and also to find out to what extent the photosynthetic performance was enhanced.
2 MATERIALS AND METHODS
2.1 Plant material
Healthy seeds of wheat (Triticum aestivum L. cv. C-306) were surface sterilized with 0.01% HgCl2 followed by repeated washings with double distilled water. The sterilized seeds were sown in 23-cm diameter earthen pots containing 5 kg of reconstituted soil (sand:clay:peat; 70:20:10 by dry weight). The soil has a sandy loam texture, a pH of 7.6 in 1:2 soil/water mixture. The soil was mixed with 0 or 100 mg S kg−1 soil (sulfur) as magnesium sulfate (MgSO4) before sowing the seeds. The amount of native S present in soil was 100 mg S kg−1 soil. Drought conditions were imposed by withholding water from 10 days after sowing (DAS) for 7 days, whereas control plants were watered on alternate days. The pots were kept in the net house of the Department of Botany, Aligarh Muslim University, Aligarh (India) under natural day/night conditions with a photosynthetically active radiations (PAR) of 680 μ mol m−2 s−1, average day/night temperatures of 21°C/17°C (±3°C), and relative humidity of 68 ± 5%. At 20 DAS, 30 ml of 50 μM H2O2 were applied on the plant foliage individually or in combination with basally applied 100 mg S kg−1 soil in the presence or absence of water-deficit. The concentration of 50 μM H2O2 was selected based on our earlier findings (Khan et al., 2019). An equivalent amount of Mg (as MgCl2) was added to the control to balance the amount of Mg incorporated in the supply of S. The number of sets for each treatment was 4 (n = 4). At 30 DAS, plants were sampled to analyze different parameters.
2.2 H2O2 content and lipid peroxidation
Leaf H2O2 content was determined by adopting the method of Okuda et al. (1991) and as described earlier (Jahan et al., 2020). Lipid peroxidation in leaves was determined by the method described by Dhindsa et al. (1981) as the content of thiobarbituric acid reactive substances (TBARS) with details provided in Jahan et al. (2020). The details of the method are provided in Appendix S1.
2.3 Activity of antioxidant enzymes
Fresh leaf tissues were homogenized with an extraction buffer containing 0.05% (v/v) Triton X-100 and 1% (w/v) polyvinyl pyrrolidone (PVP) in potassium phosphate buffer (100 mM of pH 7.0) using chilled mortar and pestle. The homogenized material was centrifuged at 15000g for 20 min at 4°C. The supernatant obtained after centrifugation was used for the enzyme assays. For APX activity, the extraction buffer was supplemented with 2 mM ascorbate. The activity of superoxide dismutase (SOD; EC, 1.15.1.1), ascorbate peroxidase activity (APX; EC, 1.11.1.11) and glutathione reductase (GR; EC, 1.6.4.2) was determined by using the modified method of Sehar et al. (2019).
2.4 Activity of ATP-sulfurylase, SAT, content of sulfur, cysteine, and GSH
The activity of ATP-sulfurylase (ATP-S; EC, 2.7.7.4), the content of sulfur, cysteine and GSH were determined by using the modified method of Khan et al. (2015). The ratio of GSH to GSSG was calculated to represent the redox state.
2.5 Determination of gas exchange and growth parameters
Net photosynthesis, stomatal conductance, and intercellular CO2 concentration were measured in fully expanded uppermost intact leaves of the plant in each treatment and its replicates using Infra-Red Gas Analyzer (CID-340, Photosynthesis system, Bioscience). The measurements were done between 11 and 12 h at light saturating intensity (PAR: 680 μmol CO2 m−2 s−1), temperature of 22°C and relative humidity of approximately 70%.
Chlorophyll content was measured in intact leaves with the help of SPAD Chlorophyll meter (SPAD, 502 DL PLUS, Spectrum technologies).
Rubisco activity was determined by monitoring NADH oxidation at 30°C at 340 nm when 3-phosphoglycerate is converted into glycerol-3-phosphate after addition of the enzyme extract prepared from the homogenization of leaf tissue in the extraction buffer containing 0.25 M Tris–HCl (pH 7.8), 0.0025 mM EDTA, 0.05 mM MgCl2, and 37.5 mg DTT to the reaction mixture (Usuda, 1985). The reaction mixture contained 100 mM Tris–HCl (pH 8.0), 10 mM MgCl2, 40 mM NaHCO3, 4.0 mM ATP, 0.2 mM NADH, 5.0 mM DTT, 0.2 mM EDTA, 1.0 U of glyceraldehydes-3-phosphodehydrogenase and 1.0 U of 3-phosphoglycerate-kinase and 0.2 mM of ribulose1,5-bisphosphate.The details of the method are given in the Appendix S1.
Plants were uprooted carefully and washed gently under running tap water to remove soil and dried in a hot air oven at 80°C until reaching a constant dry weight (measured by electronic balance). Leaf area was measured by using a leaf area meter (LA211, Systronic).
2.6 Determination of photosynthetic-SUE (P-SUE) and water use efficiency (WUE)
Photosynthetic-SUE was calculated by the ratio of net photosynthesis to S content per unit leaf area. Water-use efficiency was calculated as the ratio of net photosynthesis to stomatal conductance to avoid the effects of small differences in vapor pressure between measurements.
2.7 Relative water content, leaf osmotic potential, and water potential

Leaf water potential was measured on the second leaf from the top (fully expanded youngest leaf) using a water potential system (Psypro, WESCOR). The leaf used for water potential measurement was frozen in liquid nitrogen in sealed polythene bags, which was thawed, and cell sap was extracted with the help of a disposable syringe. The extracted sap was used for the determination of the osmotic potential using a vapor pressure osmometer (5520, WESCOR).
2.8 Measurement of chlorophyll fluorescence
For determining chlorophyll fluorescence parameters, fully expanded leaves were allowed to adapt under the dark condition for 30 min before chlorophyll fluorescence measurements were taken by Junior-PAM chlorophyll fluorometer (Heinz Walz). Minimal fluorescence (Fo) and maximum fluorescence (Fm) were measured in the dark-adapted leaves with a low measuring beam at a light intensity of 125 mmol m−2 s−1, whereas under light-adapted condition, the minimal fluorescence (Fo') and maximum fluorescence (Fm') were measured in the same leaves with saturating light intensity (720 mmol m−2 s−1) together with the steady-state fluorescence (Fs). The variable fluorescence (Fv and Fv') was calculated using the values of Fm–Fo and Fm'–Fo' and PSII was determined as Fm'–Fs'/Fm', maximal efficiency of PSII by using Fv/Fm and intrinsic efficiency of PSII by using Fv'/Fm'. Photochemical quenching (qP) and non-photochemical quenching (NPQ) were calculated using the fluorescence parameters in both light and dark-adapted states. qP were calculated as Fm'–Fs/Fm', whereas NPQ was calculated as Fm–Fm'/Fm' (Maxwell and Johnson, 2000). The electron transport rate was calculated by using the following formula PSII × photosynthetic photon flux density × 0.5 × 0.84 as suggested by Krall and Edwards (1992).
2.9 Scanning electron microscopy
Scanning electron microscopy (SEM) of leaf samples was done by adopting the modified method of Sehar et al. (2019).
2.10 Transmission electron microscopy
For determining the ultra-structure of the chloroplasts, leaf tissues were prepared for transmission electron microscopy by adopting the modified method of Sandalio et al. (2001). Leaf samples were cut with a razor blade into 1 mm segments and fixed in 2.5% glutaraldehyde solution in 50 mM phosphate buffer (pH 6.8) for about 2.5 h at room temperature. Leaf tissue was then post-fixed for 30 min in 1% osmium tetroxide in 50 mM sodium cacodylate buffer (pH 7.2) and dehydrated in graded series of ethanol (30–100%, v/v). After dehydration in a graded series of ethanol, the tissue was embedded in Spur resin. Ultrathin sections were stained with uranyl acetate and lead citrate and examined using a transmission electron microscope (ZEOL 2100F) high voltage at 120 kV and ×6000 magnification. The chloroplast ultrastructure (thylakoid membranes) was observed from transmission electron microscopy images.
2.11 Determination of ABA content
ABA content was determined according to the modified method of Hung and Kao (2003). Leaves were frozen in liquid nitrogen and ground to a fine powder. The details of the method are given in Appendix S1.
2.12 Determination of glucose content
Glucose content in leaf was determined by adopting the method of Krishnaveni et al. (1984) with slight modifications by using glucose as a standard. The details of the method are given in Appendix S1.
2.13 Statistical analysis
Data were analyzed statistically by using analysis of variance (ANOVA) by SPSS 17.0 for windows and presented as mean ± SE (n = 4). The least significant difference was calculated for the significant data at p < 0.05. Bars with the same letter are not significantly different by LSD test at p < 0.05.
3 RESULTS
3.1 Effect of H2O2 and S on stomatal behavior
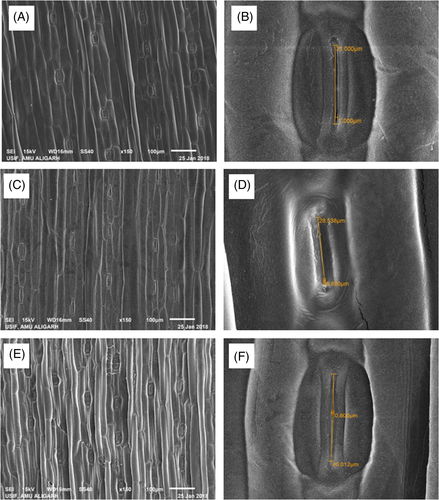
The SEM analysis clearly showed that drought stress-induced partial stomatal closure. Control plants had a stomatal length and width of 31 and 1 μm, respectively, which was decreased to 28.5 and 0.8 μm after the exposure to drought stress. Treatment of H2O2 along with S under drought stress condition increased the frequency of stomata and their length and width (40 and 0.8 μm) compared to the drought-stressed plants (Figure 1).
3.2 Effect of H2O2 and S on ultrastructural studies of chloroplast
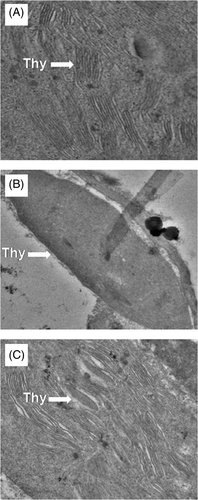
Plants exhibited a well-developed thylakoid system under control condition, but plants exposed to drought had a disorganized chloroplast and thylakoid system. Plants receiving H2O2 and S in the presence of drought had significant difference in the ultrastructure of chloroplast in comparison to the control and drought-subjected plants. The H2O2 plus S treated plants had more thalykoids stack and grana than the other plants, either control or the plants receiving individual treatment (Figure 2).
3.3 Application of H2O2 with S reduces oxidative stress
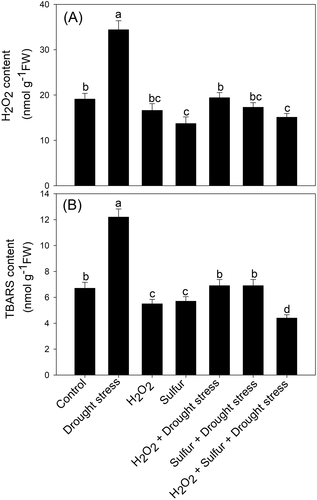
Plants subjected to drought showed higher content of H2O2 and TBARS in comparison to the control plants. Plants receiving H2O2 and S individually exhibited a decrease in H2O2 by 13.1 and 28.3%, respectively, and TBARS content by 17.9 and 14.9% compared to the non-stressed plants. However, in the presence of drought, treatment of H2O2 or S decreased H2O2 by 43.6 and 49.7% and TBARS content by 43.4 and 43.4%, respectively, compared to the drought-stressed plants. Furthermore, the application of H2O2 in the presence of S under drought stress condition maximally decreased H2O2 and TBARS content by 56.1 and 63.9%, compared to the drought-stressed plants (Figure 3).
3.4 Effect of H2O2 and S on antioxidant enzymes
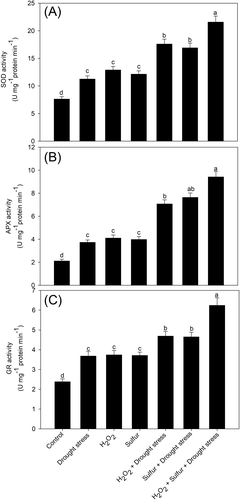
In Figure 4, it is shown that leaves of drought-stressed plants had an increase in the activity of the antioxidant enzymes, SOD, APX, and GR in comparison to the control plants. Plants subjected to individual application of H2O2 and S increased the activity of SOD by 69.7 and 59.7%, respectively compared to the control plants, APX by 95.2 and 89.5% and GR by 57.1 and 55.8%. However, plants receiving H2O2 or S in the presence of drought elevated the activity of SOD by 57.1 and 50.9%, APX by 89.5 and 104.8% and GR by 27.4 and 26.3%, respectively, compared to the stressed plants. Moreover, plants receiving H2O2 and S in the presence of drought exhibited a maximum increase in the activity of these antioxidant enzymes by 92, 152, and 69.6%, respectively, compared to the drought-stressed plants (Figure 4).
3.5 Effect of H2O2 and S on photosynthetic and growth characteristics
Plants grown with drought showed a decreased chlorophyll content, Rubisco activity, net photosynthesis, stomatal conductance and intercellular CO2 concentration in comparison to the control plants, but this reduction was alleviated in the plants receiving H2O2 and S individually and more prominently with the combined H2O2 and S. Under drought stress, plants receiving H2O2 or S decreased the negative effect of drought and had an increased chlorophyll content by 70.1 and 48.3%, Rubisco activity by 54.2 and 42.9%, net photosynthesis by 101.4 and 93.1%, stomatal conductance by 42.6 and 40.3% and intercellular CO2 concentration by 135.5 and 72.5%, respectively, in comparison to the drought-stressed plants. However, combined treatment of H2O2 and S to the plants grown under drought had the best results and the aforesaid parameters were improved by 81, 89.5, 158.3, 58.1, and 127.5%, respectively, compared to the drought-stressed plant (Table 1).
| Treatment | Chlorophyll content | Rubisco activity | Net photosynthesis | Stomatal conductance | Intercellular CO2 concentration | Leaf area | Plant dry mass |
|---|---|---|---|---|---|---|---|
| Control | 24.6 ± 1.2c | 35.6 ± 1.8d | 11.9 ± 0.60c | 339 ± 16.9d | 208 ± 10.4bc | 31.6 ± 1.7bc | 0.94 ± 0.047cd |
| Drought stress | 17.4 ± 1.1d | 27.5 ± 1.3e | 7.2 ± 0.36d | 258 ± 12.9e | 138 ± 2.76c | 18.4 ± 1.4d | 0.53 ± 0.03e |
| H2O2 | 38.8 ± 1.9a | 56.8 ± 2.8a | 19.3 ± 0.97a | 459 ± 22.9a | 328 ± 16.4a | 38.3 ± 1.9a | 1.66 ± 0.086a |
| Sulfur | 36.2 ± 1.7c | 51.9 ± 2.6b | 19.2 ± 0.96a | 448 ± 22.4a | 325 ± 16.2a | 34.7 ± 1.7c | 1.46 ± 0.074b |
| H2O2 + drought stress | 29.6 ± 1.5b | 42.4 ± 2.1c | 14.5 ± 0.73b | 368 ± 18.4c | 242 ± 12.1b | 24.6 ± 1.2ab | 1.12 ± 0.06c |
| Sulfur + drought stress | 25.8 ± 1.3b | 39.3 ± 1.9cd | 13.9 ± 0.7b | 362 ± 18.1c | 238 ± 11.9b | 21.7 ± 1.1ab | 0.98 ± 0.05cd |
| H2O2 + sulfur + drought stress | 31.5 ± 1.5ab | 52.1 ± 2.6b | 18.6 ± 0.93ab | 408 ± 20.4b | 314 ± 15.7ab | 32.8 ± 1.6a | 1.34 ± 0.07bc |
- Note: Plants were treated with 50 μM H2O2 and/or 100 mg S kg−1 soil (sulfur) in presence or absence of drought stress imposed by withholding water from 10 days after sowing for 7 days. Data are presented as treatment mean ± SE (n = 4). Data followed by same letter are not significantly different by LSD test at p < 0.05.
Plants grown with drought had a decreased leaf area and plant dry mass by 43.6 and 41.7%, respectively, in comparison to the control. Plants treated with individual H2O2 and S increased leaf area by 21.2 and 9.8% and plant dry mass by 76.6 and 55.3% in comparison to the control plants. Under stress condition, treatment of H2O2 mitigated the inhibitory effect of drought stress condition and showed an increment in the above-studied parameters by 111.2 and 33.7%, compared to the drought-treated plants. Moreover, S treatment of the plants grown with drought increased these parameters by 84.9 and 18.1%, compared to drought-stressed plants. However, application of H2O2 together with S to the plants grown with drought showed the maximum improvement in leaf area and plant dry mass by 152.8 and 78.3%, respectively, in comparison to the stressed plants (Table 1).
Plants grown with drought stress exhibited a decreased PSII activity (actual PSII efficiency, maximal PSII efficiency, intrinsic PSII efficiency, electron transport rate), whereas NPQ increased in comparison to the non-stressed plants. Plants grown with H2O2 and S individually improved the actual PSII efficiency by 12.1 and 5%, maximal PSII efficiency by 11.4 and 6.3%, intrinsic PSII efficiency by 17.1 and 11.4%, qP by 10.7 and 2.4%, electron transport rate by 20.5 and 17.1% but decreased NPQ by 8.9 and 5.9%, respectively, in comparison to the control plants. Follow-up treatment of H2O2 or S to the drought-treated plants improved the above characteristics by mitigating the negative effect of drought stress compared to the stressed plants. However, the combined application of H2O2 and S in the presence of drought showed an increased actual PSII efficiency by 63.8%, maximal PSII efficiency by 55.5%, intrinsic PSII efficiency by 44.2%, photochemical quenching by 63.6%, electron transport rate by 50%, photochemical quenching by 42.1% compared to the drought-stressed plants, whereas NPQ decreased by 14.3% compared to the drought-stressed plants (Table 2).
| Treatment | Actual PSII efficiency | Maximal PSII efficiency | Intrinsic PSII efficiency | qP | NPQ | Electron transport rate |
|---|---|---|---|---|---|---|
| Control | 0.58 ± 0.03bc | 0.79 ± 0.04bc | 0.7 ± 0.04bc | 0.84 ± 0.043bc | 0.67 ± 0.034bc | 181.4 ± 9.27c |
| Drought stress | 0.47 ± 0.02d | 0.63 ± 0.03d | 0.61 ± 0.03d | 0.66 ± 0.036d | 0.84 ± 0.043a | 149.7 ± 8.23d |
| H2O2 | 0.65 ± 0.03b | 0.88 ± 0.045ab | 0.82 ± 0.04ab | 0.93 ± 0.048b | 0.61 ± 0.031c | 218.6 ± 10.9ab |
| Sulfur | 0.61 ± 0.03bc | 0.84 ± 0.042b | 0.78 ± 0.04b | 0.86 ± 0.043bc | 0.63 ± 0.032c | 212.4 ± 10.6ab |
| H2O2 + drought stress | 0.56 ± 0.028c | 0.74 ± 0.037c | 0.65 ± 0.034c | 0.78 ± 0.04c | 0.73 ± 0.038b | 198.5 ± 9.95b |
| Sulfur + drought stress | 0.52 ± 0.026cd | 0.69 ± 0.3cd | 0.62 ± 0.03cd | 0.73 ± 0.036cd | 0.77 ± 0.04ab | 193.3 ± 9.73bc |
| H2O2 + sulfur + drought stress | 0.77 ± 0.038a | 0.98 ± 0.05a | 0.88 ± 0.044a | 1.08 ± 0.054a | 0.72 ± 0.036b | 224.6 ± 11.2a |
- Note: Plants were treated with 50 μM H2O2 and/or 100 mg S kg−1 soil (sulfur) in presence or absence of drought stress imposed by withholding water from 10 days after sowing for 7 days. Data are presented as treatment mean ± SE (n = 4). Data followed by same letter are not significantly different by LSD test at p < 0.05.
3.6 Effect of H2O2 and S on ATP-S, S content, cysteine, GSH and redox state
Plants exposed to drought had an increase in ATP-S activity, and Cys content but a decreased S content in comparison to the control plants. Plants receiving H2O2 and S individually in the absence of stress also increased the activity of ATP-S by 80.8 and 67.4%, S content by 19.2 and 23.1%, and Cys content by 81.8 and 76.6%, respectively, in comparison to the control plants. In the presence of drought, plants receiving H2O2 or S enhanced the activity of ATP-S by 3.1 and 6.3%, S content by 42.1 and 52.6% and Cys content by 39.3 and 42.3%, respectively, compared to the stressed plants. However, plants subjected to H2O2 plus S in the presence of drought maximally increased the activity of ATP-S by 175.6 and 85.2%, S content by 26.9 and 73.7% and Cys content by 201 and 77.3%, in comparison to the control and stressed plants, respectively (Table 3).
| Treatment | ATP-S activity | Cysteine content | Sulfur content | P-SUE | WUE | Osmotic potential | Water potential |
|---|---|---|---|---|---|---|---|
| Control | 1.72 ± 0.12c | 19.2 ± 0.5d | 5.2 ± 0.3c | 21.6 ± 1.1c | 38.4 ± 1.92bc | 0.84 ± 0.04bc | 0.64 ± 0.034bc |
| Drought stress | 2.56 ± 0.14bc | 32.6 ± 1.32c | 3.8 ± 0.25d | 13.4 ± 0.67d | 26.6 ± 1.18d | 1.43 ± 0.07a | 1.21 ± 0.06a |
| H2O2 | 3.11 ± 0.18b | 34.9 ± 1.98c | 6.2 ± 0.38abc | 26.6 ± 1.36b | 47.2 ± 2.36a | 0.52 ± 0.027d | 0.42 ± 0.021cd |
| Sulfur | 2.88 ± 0.18b | 33.9 ± 1.99c | 6.4 ± 0.4ab | 29.4 ± 1.5a | 43.5 ± 2.17ab | 0.56 ± 0.029d | 0.48 ± 0.024c |
| H2O2 + drought stress | 2.64 ± 0.15bc | 45.4 ± 2.51b | 5.4 ± 0.31c | 21.2 ± 1.06c | 31.5 ± 1.6c | 0.92 ± 0.046b | 0.66 ± 0.033bc |
| Sulfur + drought stress | 2.72 ± 0.15bc | 46.4 ± 2.54b | 5.8 ± 0.38bc | 23.8 ± 1.2bc | 29.8 ± 1.52d | 1.12 ± 0.056ab | 0.72 ± 0.037b |
| H2O2 + Sulfur + drought stress | 4.74 ± 0.336a | 57.8 ± 3.74a | 6.6 ± 0.42a | 27.8 ± 1.4ab | 41.6 ± 2.1b | 0.74 ± 0.038c | 0.53 ± 0.027c |
- Note: Plants were treated with 50 μM H2O2 and/or 100 mg S kg−1 soil (sulfur) in presence or absence of drought stress imposed by withholding water from 10 days after sowing for 7 days. Data are presented as treatment mean ± SE (n = 4). Data followed by same letter are not significantly different by LSD test at p < 0.05.
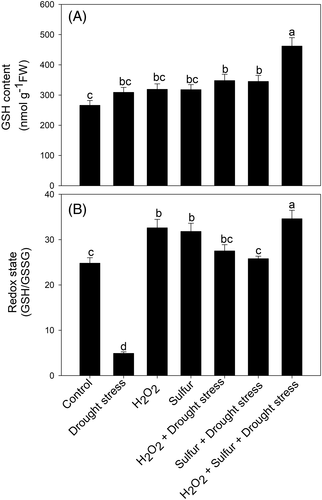
Drought-stressed plants manifested higher GSH content but decreased redox state in comparison to the control plants. Plants treated with individual H2O2 and S had similar responses on GSH content and redox state, and the increase was 1.2 and 1.3 times higher in comparison to the control. Plants subjected to H2O2 or S under stress condition reversed the inhibitory effect of drought and increased GSH content by 1.12 times and 1.11 times and redox state by 5.6 and 5.3 times, in comparison to the drought-treated plants. However, plants treated with H2O2 plus S grown under drought stress condition more prominently increased GSH content by 1.5 times and redox state by 7.1 times compared to the drought-stressed plants (Figure 5).
3.7 Effect of H2O2 and S on photosynthetic-SUE and WUE
It is observed that exposure of plants to drought stress decreased P-SUE and WUE in comparison to the control plants, whereas plants receiving H2O2 and S individually elicited an increase in P-SUE by 23.1 and 36.15% and WUE by 22.9 and 13.3%, respectively, in comparison to the control plants. Under drought stress conditions, treatment of H2O2 or S decreased the inhibitory effect of stress condition and increased P-SUE by 58.2 and 77.6% and WUE by 18.4 and 12%, respectively, as compared to the drought-treated plants. However, plants grown with H2O2 and S in the presence of drought showed significant improvement through increasing P-SUE by 28.7 and 107.4% and WUE by 8.3 and 56.4%, respectively, in comparison to the control and drought-stressed plants (Table 3).
3.8 Effect of H2O2 and S on osmotic and water potential
Drought stress exhibited higher osmotic and water potential as compared to the control plants, whereas plants treated with individual H2O2 and S showed a reduction in osmotic potential by 38.1 and 33.3% and water potential by 34.4 and 25%, respectively, compared to the control plants. Plants receiving H2O2 or S in the presence of drought decreased the deleterious effects of the stress condition and decreased osmotic potential by 35.6 and 21.7% and water potential by 45.5 and 40.5%, respectively, compared to the drought-stressed plants. However, supplementation of both H2O2 and S to drought-treated plants decreased the osmotic and water potential by 48.2 and 56.2%, in comparison to the drought-stressed plants (Table 3).
3.9 Effect of H2O2 and S on RWC, ABA, and glucose content
In this study, plants exposed to drought displayed a marked reduction in RWC (17%) in comparison to the control plants. However, individual treatment with H2O2 or S decreased the RWC by only 6.6 and 7.5%, respectively, in comparison to the control plants but elicited an increase in RWC by 16.2 and 14% compared to the drought-treated plants. Treatment of H2O2 or S in the presence of stress manifested an increase in RWC by 6.6 and 2.1%, respectively, compared to the stressed plants. Furthermore, treatment of H2O2 in the presence of S and drought exhibited a significant improvement of RWC by 21.5% compared to the drought-exposed plants (Figure 6).
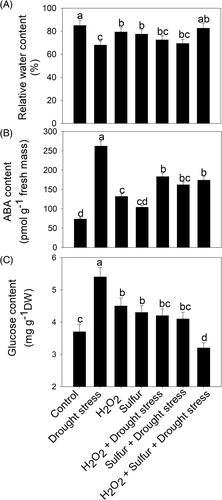
ABA content was influenced by drought stress condition in comparison to the control plants. Plants treated with H2O2 and S individually showed an increment in ABA accumulation by 1.8 and 1.4 times in comparison to the control plants but the ABA content decreased in comparison to the drought-stressed plants. However, plants supplemented with H2O2 or S along with drought also decreased the ABA accumulation by 1.4 and 1.6 times, respectively, in comparison to the drought-stressed plants. Furthermore, the combined application of H2O2 and S along with drought stress decreased the ABA content by 1.5 times compared to the drought-stressed plants (Figure 6).
The glucose content increases in drought-stressed plant in comparison to the control plants. Individual application of H2O2 and S in the absence of stress condition showed approximately an equal increase in glucose content by 21.5%, compared to the control plants but it decreased by 16.6 and 14.8% compared to the drought-treated plants. Plants supplemented with H2O2 or S in the presence of stress showed a decrease in glucose content by 22.2 and 24%, respectively, compared to the drought-stressed plants. However, plants receiving a combined application of H2O2 and S plus drought maximally decreased the glucose content by 13.5 and 40.7% compared to the control and drought-stressed plants (Figure 6).
4 DISCUSSION
Water-deficit conditions impose deleterious effects on plant growth, physiological and metabolic attributes (Lei et al., 2006, Gunes et al., 2008, Ruiz-Sánchez et al., 2010, Bhuiyan et al., 2019). Drought stress is severely increasing in the changing environmental scenario leading to a considerable loss in crop productivity worldwide (Golldack et al., 2014; Shanker et al., 2014). Exposure of plants to drought stress alters water-relations, photosynthetic and growth attributes, osmotic and oxidative stress, and ultimately disturbs the overall growth of plants (Alam et al., 2013, 2014a, 2014b, Nazar et al., 2015, Bhuiyan et al., 2019). In this study, we observed that water-deficit decreased photosynthetic and growth characteristics and the reduction in photosynthesis might occur due to drought-stress-induced stomatal closure and to an increase in ABA accumulation causing a reduction in RWC and water-use efficiency of plants. This finding on the influence of water deficit on photosynthetic characteristics is supported by previous reports (Alam et al., 2013; Nahar et al., 2015; Liu et al., 2019). Under drought stress conditions, the maintenance of water-status is critical for maintaining the turgidity of plant cells to withstand stress and also for higher production of crop plants. This reduction in photosynthesis may be due to the impairment of photosynthetic pigments and their biosynthesis, and it also limits the carboxylation efficiency of plants and inhibits the activity of Rubisco. Earlier reports (Pandey and Shukla, 2015, Perdomo et al., 2017, Bhuiyan et al., 2019) have shown the involvement of photosynthetic pigments and carboxylation efficiency in the regulation of photosynthesis. The photosynthetic characteristics were significantly improved through the supplementation of H2O2 and S individually, and more prominently with their combination, by protecting the photosynthetic pigments from oxidative damage, and this is in agreement with various previous reports (Tian and Lei, 2006; Abass and Mohamed, 2011; Hossain and Fujita, 2013; Sohag et al., 2020). Meanwhile, individual application of H2O2 and S induced drought stress tolerance related to an increased stomatal conductance (Ishibashi et al., 2011; Liao et al., 2012). In these earlier reports, the role of individual application of H2O2 and S in the mitigation of drought stress has been shown. However, the effectiveness of H2O2 combined with S has not been reported earlier.
The effect of H2O2 along with S in mitigating the effects of drought stress on photosynthesis and growth may be accredited to various reasons such as the upregulation of stomatal behavior and a decrease in ABA accumulation, and water and osmotic relations. It also influences glucose sensitivity by decreasing the glucose content and alleviates drought stress tolerance through reduced thiol formation. Accumulation of ABA increased under drought stress, and decrease to optimal range through the supplementation of H2O2 and S due to the formation of reduced thiol. Drought stress increased ROS and ABA contents in plants (Liu et al., 2019), but supplementation of H2O2 and S decreased the oxidative stress by increasing the activity of antioxidant enzymes. It is evident from previous reports that various abiotic stress factors such as drought, salt, and heavy metal stress lead to an increase in the activity of antioxidant enzymes and a decrease of ROS (Sade et al., 2011; Fatma et al., 2016; Sehar et al., 2019; Rather et al., 2020a, 2020b; Asgher et al., 2021). In the present study, our results also suggest that both H2O2 and S coordinately participate in upregulating the activity of antioxidant enzymes to decrease lipid peroxidation observed as content of H2O2 and TBARS in leaves under drought stress. Earlier reports also suggest the individual role of H2O2 and S in improving drought stress, nickel, and arsenic-induced toxicity through upregulating the activity of the antioxidant defense system, regulating AsA-GSH cycle and increased S-assimilation capacity of plants (Khan et al., 2014; Sun et al., 2016; Shan et al., 2018; Li et al., 2020; Asgher et al., 2021). Xu et al. (2011) also showed the involvement of the enzymes of the ascorbate–glutathine cycle in protection of Kentucky bluegrass to drought damage. Guler and Pehlivan (2016) revealed that supplementation of a low dose of H2O2 enhances drought stress tolerance in Glycine max. by improving the antioxidant defense system. Torres-Franklin et al. (2008) showed that the expression of GR remained stable under moderate drought in the tolerant cowpea, and upregulation of GR occurred during the recovery from drought. It has also been observed that drought stress increased the activity of antioxidant enzymes and also up-regulated the expression of GR but down-regulated the gene expression of CuSOD, MnSOD, FeSOD, and APX (Contour-Ansel et al., 2006; Bian and Jiang, 2009). The increase in antioxidant enzymes activity increases the capacity of osmotic adjustment to maintain water status through decreasing lipid peroxidation and membrane damage through re-establishing turgidity of cell in Triticum aestivum and Cucumis sativus (Sun et al., 2016; Li et al., 2018). Han et al. (2019) showed that pre-treatment with sulfur dioxide alleviates the drought-induced oxidative damages in foxtail millet seedlings through the upregulation of the antioxidant defense system and their transcripts, a decrease in malondialdehyde (MDA) content and an increase in proline. Jiang et al. (2010) reported that drought stress did not alter the gene expression of CuSOD, ZnSOD, and APX. Zafar et al. (2014) also emphasized that foliar application of zinc and S tends to decrease the level of oxidative damages and safeguard the cell membrane by decreasing the H2O2 and TBARS content and modulating the activity of antioxidant enzymes in Hellianthus annus L. These results are confirmed by Kaya et al. (2020), who stated that S-enriched soil amendments enhanced drought stress tolerance, hence improving growth and yield characteristics in maize. In the present report, supplementation of combined H2O2 and S proved to be more promising in enhancing photosynthetic characteristics, chlorophyll fluorescence parameters, water status, osmotic and water potential in the presence and absence of drought. It may be possibly correlated with the activity of antioxidant enzymes and recovery of chlorophyll damage, which may be due to increased stomatal conductance and a lower accumulation of ROS (Liu et al., 2009, Sun et al., 2016).
The stomatal responses and ultrastructure of chloroplast by SEM and transmission electron microscopy were also studied. Drought stress-induced partial stomatal closure and disordered the structure of chloroplast, whereas plants treated with H2O2 and S had opened stomata and a well-organized structure of chloroplast easing the effects of drought. The plants treated with H2O2 and S maintained higher water status with lower ABA concentration in the guard cells leading to more opened stomata than the other plants. Supplementation of H2O2 and S also enhanced the frequency of stomata and the number of chloroplasts per cell compared to the control and drought-treated plants. It may be due to the increased activity of antioxidant enzymes, GSH content, S-assimilation, and decreased lipid peroxidation. This increase in GSH content maintained redox homeostasis and stomatal movement. This shows a strong correlation between stomatal movement, the ultrastructure of chloroplast and ABA accumulation in guard cells of stomata.
5 CONCLUSIONS
It may be concluded that H2O2 in the presence of S more conspicuously increased photosynthetic and growth attributes of the plant than their individual effects under normal and drought stress conditions. This increase in photosynthetic and growth attributes was related to the increased GSH production, activity of antioxidant enzymes, decreased ABA accumulation, and glucose-sensitivity. The availability of S induced synthesis of reducing compounds, prominently GSH. The application of H2O2 greatly increased the S-assimilation capacity of plants, the activity of antioxidant enzymes, GSH production, reduced glucose sensitivity, and ABA accumulation. The present findings suggest that supplementation of combined H2O2 and S in the agricultural system might improve the photosynthetic and growth performance of wheat plants, particularly under rainfed conditions.
AUTHOR CONTRIBUTIONS
Nafees A. Khan: conceptualization, supervision; Asim Masood and Naser A. Anjum: writing-reviewing and editing; Zebus Sehar and Badar Jahan: investigation, formal analysis, original draft.
Open Research
DATA AVAILABILITY STATEMENT
The datasets generated during and/or analysed during the current study are available from the corresponding author on reasonable request.


