Niche differences may explain the geographic distribution of cytotypes in Erysimum mediohispanicum
Abstract
- Polyploidisation has played an important role in plant diversification, and variation in ploidy level may be found not only between species of the same genus, but also within a single species. Although establishing the adaptive significance of polyploidy to explain the geographic distribution of cytotypes is challenging, the occurrence of different cytotypes in different ecological niches may suggest an adaptive role of genome duplication.
- We studied the adaptive significance of the geographic distribution of cytotypes across the entire distribution range of the endemic Erysimum mediohispanicum (Brassicaceae). For that, we have used climate variables, population elevation and soil properties to model ecological niches for the different cytotypes. In addition, we analysed the effect that ploidy level has on the floral phenotype.
- We found a clear geographic pattern in the distribution of cytotypes, with diploid individuals occurring in the southernmost part of the distribution range, while tetraploids were found in the northern area. A contact (mosaic) zone between both cytotypes was identified, but diploids and tetraploids occur in sympatry in only one population (although in a highly unbalanced proportion). Gene flow between different cytotypes seems to be negligible, as evident from an almost complete absence of triploids and other minority cytotypes. Niches occupied by both cytotypes showed subtle, but significant differences, even in the contact zone. Precipitation was higher in regions occupied by tetraploid individuals, which present wider corolla tubes and thinner but taller stalks than diploids.
- Our findings highlight the potential role of polyploidy in the ecological adaptation of E. mediohispanicum to both abiotic factors and biotic interactions.
Introduction
Polyploidisation has long been recognised as a key process in plant evolution and diversification (Otto & Whitton 2000; De Bodt et al. 2005; Soltis et al. 2009; Castro et al. 2012), and genome duplications have occurred multiple times during the evolutionary history of angiosperms (Grant 1971; Masterson 1994; Soltis 2005). In addition, genome duplication is one of the few speciation processes that may operate in sympatry, due to the possible immediate emergence of reproductive isolation between individuals with different ploidies (Husband & Sabara 2003 and references therein). Consequently, the role of polyploidisation on species formation has been widely studied since the beginning of the last century (Mayr 1942, 1982).
Polyploidisation may drive changes in plant size (Stebbins 1971), flower size and shape (Segraves & Thompson 1999), and flowering time (Nuismer & Cunningham 2005). Variation in these phenotypic traits influences plant reproductive success by affecting pollinator attraction (Segraves et al. 1999; Thompson et al. 2004; Kennedy et al. 2006; Münzbergová 2006; Arvanitis et al. 2007) and autogamy rates (Petit et al. 1999 and references therein). Thus, studying phenotypic differences associated with variation in ploidy level may be fundamental to understand the reproductive ecology and evolution of species composed of different cytotypes.
Still, quantitative phenotypic variation found in natural populations is the result of multiple factors acting in both the genetic and environmental variance components of those traits. Additionally, the distribution range of most species is wide enough to show environmental heterogeneity, particularly in mountainous areas due to changes associated with elevation, such as precipitation, temperature and soil properties (Frei et al. 2014). Therefore, it is important to account for this heterogeneity and to correlate cytotypes, phenotypes and environmental variables in order to evaluate the adaptive significance of polyploidy.
Intraspecific variation in ploidy level is frequent in angiosperms (Thompson & Merg 2008; Castro et al. 2012; Kolář et al. 2015). When this occurs, studying the geographic distribution of cytotypes can provide valuable information about the origin and maintenance of the different ploidy levels (Segraves et al. 1999; Baack 2004; Rieseberg & Willis 2007; Kolár et al. 2009). For example, the existence of intermediate ploidies is compatible with gene flow between cytotypes (Zozomová-Lihová et al. 2015), whereas a random distribution of cytotypes may suggest that they share similar habitat requirements. In contrast, the existence of different cytotypes showing strong spatial segregation may be due to, at least, three non-exclusive hypotheses (Petit et al. 1999; Baack 2004): niche differentiation (Ehrendorfer 1980; Lewis 1980), reproductive exclusion (Levin 1975; Van Dijk & Bakx-Schotman 1997) and historical factors (Ančev 2006). According to these hypotheses, the disjunct distribution of cytotypes would be due to their different environmental requirements, differential success in reproduction and the occurrence of particular evolutionary constraints or demographic stochasticity, respectively.
Mixed ploidy populations have been found in multiple plant species but in most cases they are restricted to geographic areas of close spatial proximity between pure ploidy populations (Kolár et al. 2009; Hülber et al. 2015). Such geographic areas are called ‘contact zones’ and can be classified as hybrid zones, showing a particular habitat suited for multiple cytotypes; (Barton & Hewitt 1985), and mosaic zones, showing multiple habitats each suited for a particular cytotype; (Harrison & Rand 1989). Niche differences in hybrid zones are expected to be smaller compared to those in pure populations, but similar niche differences are expected in case of mosaic zones (Hülber et al. 2015).
Ecological niche modelling allows a quantitative evaluation of the ecological divergence of species based on their empirical geographic distributions and is becoming a valuable tool for habitat assessments applied to multiple disciplines, such as ecology, evolution, conservation and agronomy (Laport et al. 2016 and references therein). Niche modelling approaches also allow statistical comparison of the overlap of niches occupied by different taxa using the niche similarity and the niche equivalency tests (Warren et al. 2008; Broennimann et al. 2012). The former evaluates if one cytotype niche predicts the other niche better than a randomly generated niche, while the latter directly compares both niches (Glennon et al. 2014). The sensitivity of the equivalency test to identify niche differences is extremely high compared with the similarity test (Visger et al. 2016).
In this study, we use niche modelling to evaluate the adaptive basis of ploidy through its effect on reproductive traits and on its ability to occupy different habitats. For that, we used the herb Erysimum mediohispanicum as a model. Erysimum L. is remarkable in Brassicaceae: it is one of the largest genera (composed of more than 200 species; Al-Shehbaz 2012), has one of the largest polyploid series (diploid to dodecaploids; Marhold & Lihová 2006; Warwick & Al-Shehbaz 2006) and is one of the few polybasic genera (base chromosome numbers x = 7 and x = 8; Lysak & Koch 2011). In addition, the existence of intraspecific variation in ploidy level has been repeatedly reported for the genus in Europe and North America (Mulligan 1966; Michalková 2000; Ančev 2006). E. mediohispanicum is the most widely distributed species of Erysimum in the Iberian Peninsula (Nieto-Feliner 1993). Chromosome counts revealed the existence of diploid (2n = 2x = 14 chromosomes) and hypotetraploid (2n = 4x = 26 chromosomes; hereafter called tetraploid) individuals (Polatschek 1979; Blanca et al. 1992). Despite the fact that both cytotypes were originally defined as different species (Polatschek 1979), the lack of phenotypic characters consistently supporting this division led several authors to reject this taxonomic separation of cytotypes (Ball 1990; Blanca et al. 1992; Nieto-Feliner 1993). As observed in many other Erysimum species, the existence of tetravalent structures during meiosis points to autopolyploid origin of tetraploid E. mediohispanicum (Blanca et al. 1992; Clot 1992).
In this study, we aimed to: (i) assess the geographic distribution of the diploid and tetraploid E. mediohispanicum cytotypes; (ii) explore the potential existence of contact zones between cytotypes; (iii) determine the effect of ploidy level on floral phenotype potentially affecting the interaction with pollinators; and (iv) determine the relationship between distribution of the cytotypes and environmental factors.
Material and Methods
Study populations
We gathered information on ploidy level, floral phenotype and climate from 118 E. mediohispanicum populations, representing the entire distribution range of the species. To minimise the impact that environmental conditions of a particular year on floral phenotypes, we measured phenotypic traits for at least 2 years in most populations (see Table S1 for further details on location, ploidy, sample size and sampling strategy). Using leaf tissue from individuals of a single year per population, we estimated ploidy level of 52 populations by analysing microsatellite electropherograms obtained following Muñoz-Pajares et al. (2011). To confirm the accuracy of microsatellite markers to discriminate between diploid and polyploid individuals, we used flow cytometry (FCM) to re-estimate genome size of 16 populations previously studied using microsatellite markers. Because ploidy level was homogeneous in the five populations where FCM was applied to more than 20 individuals (representing 15–30% of the entire populations), ploidy levels of 51 additional populations were estimated using a low number of individuals (average of three individuals per population), except in areas of special interest (where we analysed an average of 17 individuals per population; Table S1). Finally, in 15 populations, ploidy level was obtained from the literature, being estimations based on chromosome counts (Polatschek 1979; Clot 1992). Details on methods to estimate ploidy level using both, FCM and microsatellite analyses, are provided in Appendix S1 and Fig. S1.
Determination of floral phenotype
We studied the floral phenotype of 54 populations, characterising at least 30 individuals per population. However, some populations were smaller; in those cases, all flowering individuals occurring in the population were studied (Table S1). In each plant we measured: (i) stalk height, height of the tallest flowering stalk, obtained using a measuring tape (error ± 0.5 cm); (ii) stalk diameter, diameter at the base of the tallest flowering stalk; (iii) flower number, counting all flowers and flower buds produced per plant; (iv) corolla diameter, distance between the apical edges of two opposite petals; (v) corolla tube length, distance between the corolla tube aperture and base of the sepals; (vi) corolla tube width, internal space between petals at the top of the corolla tube aperture, and estimated as the difference between corolla diameter minus length of two opposite petals. Traits (ii) and (iv) to (vi) were measured using digital callipers with 0.1 mm resolution. Traits (iv) to (vi) were estimated in one flower per plant.
Climate variables
Interpolated climate variables at 0.5 arc min resolution were obtained for the studied populations from the Worldclim 1.4 database (Hijmans et al. 2005) using the raster package in R (Hijmans 2016). Specifically, we selected three climatic variables based on their expected biological importance to E. mediohispanicum reproductive cycle: Precipitation (PR, mm·day−1) during the period of flowering (and pollination) and fruiting; Mean temperature (TM, °C) during seedling establishment; and Temperature range (TR, °C) during the final vegetative growth before plant reproduction. To better represent climatic environment, we also retained the bioclimatic variables showing Pearson's correlation coefficients lower than 0.7 (Table S2), raising the total number of climatic variables used to seven: PR, TM, TR, Bio3 (isothermality, that is, the quotient between day-to-night and summer-to-winter temperature oscillation), Bio8 (mean temperature of wettest quarter), Bio9 (mean temperature of driest quarter), and Bio19 (precipitation of coldest quarter). See Appendix S1 for a complete description on the variables used in this work.
Correlations between phenotype, ploidy and climate
Prior to any analyses, we log-transformed phenotypic traits departing from normality (namely, stalk diameter, stalk height and number of flowers). The relationships between phenotypic traits, ploidy level and climate variables were evaluated using canonical correlation analyses (CCA). We normalised all climatic and phenotypic variables and computed the CCA using the CCA package in R (González & Déjean 2012).
Environmental niche modelling and niche overlap
To obtain a more accurate estimate of the environmental niche of the two cytotypes, we also downloaded six variables describing soil properties from the European Soil Database version 2 Raster Library (Panagos 2006). Specifically, we used parmado (dominant parent material), wrbadj1 (first soil adjective code), DR (depth to rock), oc_top (topsoil organic carbon content), text (dominant surface textural class) and usedo (dominant land use). Finally, we used the same database to download the altitude layer to account for effects of population elevation. Because altitude had a strong negative correlation with TM (Pearson's coefficient = −0.87; Table S2), the latter was excluded for analyses including altitude.
Niche modelling was performed with maximum entropy modelling using the MaxEnt software (Phillips & Dudík 2008) with default parameters, except for number of replicates (15), percentage of random tests (25) and maximum number of iterations (5000). We used the area under the curve statistic (AUC) to evaluate model accuracy and the relative contribution of each variable to the final model. Overlap between niches of both E. mediohispanicum cytotypes was quantified using the Schoener's D (See Appendix S1 for further details).
Results
Distribution pattern of cytotypes in E. mediohispanicum
Using FCM analysis, we estimated ploidy level in 416 individuals from 67 populations (Table S1) and found that 211 of them were diploid (2x; average genome size: 0.47 pg·2C−1) and 200 were tetraploid (4x; average genome size: 0.99 pg·2C−1). However, 2x and 4x individuals inhabit different populations of homogeneous ploidy (Fig. S2). In fact, only four out of the 63 studied populations contained more than one cytotype (Table 1). From these, only in one population (Em93) were 2x and 4x found growing in sympatry and, even in that case, their frequencies within the population were extremely unbalanced (2x + 4x + aneuploids; 27:1:1; Table S1). The remaining three populations with ploidy heterogeneity were Em54 (4x + 5x; 2:1; genome size of the 5x individual was 1.26 pg·2C−1), Em71 (4x + aneuploids, 13:2; genome size of aneuploids was 1.17 and 1.18 pg·2C−1) and Em98 (3x + 4x; 1:4, genome size of the 3x individual was 0.75 pg·2C−1; Table S1, Fig. S2).
| ploidy | southern | contact zone | northern | total |
|---|---|---|---|---|
| 2x | 35 | 6 | 0 | 41 |
| 4x | 0 | 17 | 56 | 73 |
| 2x, 4x, an. | 0 | 1 | 0 | 1 |
| 4x, 5x | 0 | 0 | 1 | 1 |
| 4x, an. | 0 | 1 | 0 | 1 |
| 4x, 3x | 0 | 0 | 1 | 1 |
| Total | 35 | 25 | 58 | 118 |
The geographic distribution of ploidies was mostly disjunct, with diploid individuals being restricted to the southernmost part of the Iberian Peninsula and tetraploids occurring in the central and northern parts of the Iberian Peninsula (Table 1; Fig. S2). Interestingly, a contact zone between diploids and tetraploids was found between these two main areas. Specifically, the contact zone is located in the Prebaetic Ranges of the Baetic Mountains, less than 50 km from the northernmost diploid populations and 100 km from the southernmost tetraploid populations (Fig. S2). Within the contact zone we did not find any populations showing both cytotypes in a similar proportion, but a single tetraploid individual was found in a diploid population; the two populations having aneuploid individuals were also detected in this region (Fig. S2, Table 1). The shortest distance between populations with different ploidies in the contact zone was 6.8 km.
Correlations between phenotype, ploidy and climate
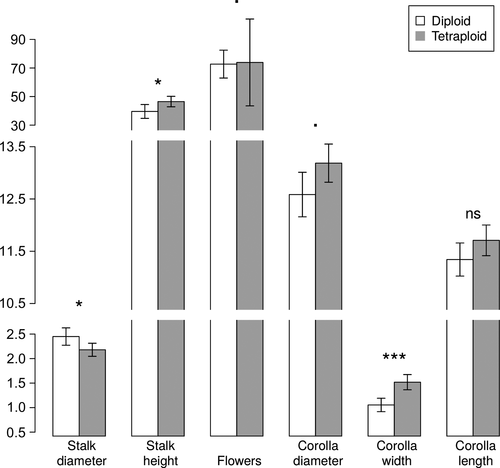
Even though cytotypes could not be distinguished by phenotype in natural populations, after analysing 4733 individuals we found significant differences in several traits (Fig. 1). Specifically, flowering stalks were significantly wider in diploids than in tetraploids, while for stalk height the opposite trend was observed, with tetraploids being taller than diploids. The corolla tube width was also larger in tetraploids than in diploids, being the trait showing the largest differences. The remaining phenotypic traits were not statistically different between ploidy levels (Fig. 1). Similar results were obtained using only the subset of individuals for which both ploidy levels and phenotypic traits were measured (data not shown).
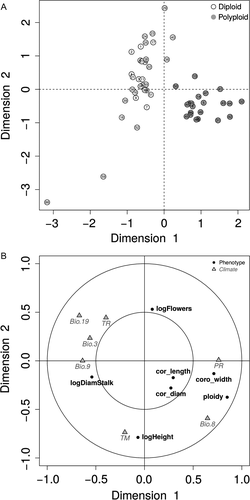
The correlations between ploidy and both stalk diameter and corolla tube width (negative and positive, respectively) were confirmed with CCA results (Fig. 2). The CCA clearly separated diploid and tetraploid populations in dimension 1 (Fig. 2A), which, in addition to ploidy level, corolla tube width and stalk diameter, importantly depends on precipitation and temperature (Fig. 2B, Table S3). Specifically, polyploid populations seem to occur in areas with higher precipitation during flowering and fruiting (PR) and mean temperature during the wettest quarter (Bio8), but lower precipitation of the coldest quarter (Bio19) and mean temperature of driest quarter (Bio9).
Environmental niche modelling and niche overlap
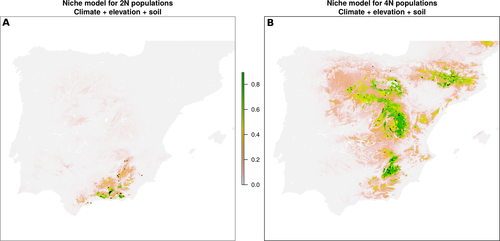
Niche models estimated using climate variables, altitude and soil variables had very high AUC scores for 2x (mean 0.985 ± 0.026; ±SD) and 4x (mean 0.928 ± 0.046) populations, suggesting negligible rates of false negative and false positive suitability predictions. In fact, most of the studied populations were in areas having high predicted probability (Fig. 3). Interestingly, the models point to the observed contact area as one of the few regions in the Iberian Peninsula where environment appears highly suitable for both cytotypes (Fig. 3). Niche overlap was 37.9%, with diploid and tetraploid niches overlapping significantly less than expected by chance according to the equivalency test (P = 0.01). However, according to the similarity test, niche overlap was not significantly lower than random (2N versus 4N, P = 0.57; 4N versus 2N, P = 0.56). These findings are compatible with the existence of subtle differences between the niches occupied by the two cytotypes. We obtained congruent results after using only climate (continuous) variables for niche models estimation (see Appendix S2).
Mean temperature during seedling establishment (TM), altitude and temperature range during bud development (TR) were the variables having the highest contribution to the final models for 4x populations, whereas precipitation during flowering and fruiting (PR), altitude and TR were the most important variables for 2x populations (Table S4). Specifically, 2x populations tend to occur at lower PR but higher TR and TM. Regarding soil variables, the dominant parent material (parmado) had the most consistent influence in both models. According to that variable, E. mediohispanicum mainly grows on limestone, as 60% of the studied populations were found in that type of soil. However, this value importantly varies with ploidy, being as high as 81% for 2x, but only 48% for 4x. Indeed, 4x individuals are found growing on calcareous sandstone in 24% of the populations, on marl soils in 12% of the cases and on other non-marl soils in 16% of the populations (Table S5).
Discussion
The three methods used to obtain information on E. mediohispanicum ploidy variability (FCM, microsatellite analyses and chromosome counts) supported the same patterns of geographic distribution of cytotypes and the occurrence of within-population ploidy homogeneity. Although the ability of microsatellite markers to discriminate ploidy levels higher than the diploid level can be limited, the diploid and polyploid individuals were easily distinguished based on distinct electropherogram patterns. In fact, in all cases, flow cytometry confirmed the ploidy level assignments obtained using microsatellite markers, suggesting that this approach may be valid when the goal is to discriminate between diploid and polyploid individuals.
After combining the different ploidy estimates, we found no population composed of 2x and 4x individuals at a similar frequency. This result agrees with the expectation that mixed ploidy populations are rare due to minority cytotype exclusion (Levin 1975). Despite parental lineages (usually of a lower ploidy level) and their descendants being able to coexist in sympatry in some plant species (Weiss et al. 2002; Sudová et al. 2010), different cytotypes more frequently inhabit different localities (Borrill & Lindner 1971; Levin 1975; Husband & Schemske 1998; Lihová et al. 2003; Stuessy et al. 2004; Buggs & Pannell 2006; Balao et al. 2010). Indeed, this pattern has been found even in species with large polyploid series, such as Dianthus broteri, which is composed of diploid, triploid, tetraploid, hexaploid and dodecaploid individuals, all inhabiting different localities (Balao et al. 2009, 2010). Our results show a clear geographic segregation of E. mediohispanicum cytotypes, with diploid individuals in the south and tetraploids in the north of Spain. However, future research increasing sampling sizes per population is required at a finer scale, especially in the contact zone, to confirm the lack of mixed ploidy populations.
Adaptive basis of ploidy
In E. mediohispanicum populations, the ploidy level is lower in the south than in the north of the Iberian Peninsula. Such a pattern has already been observed in other plant species in this geographic area, such as Arenaria tetraquetra (Vargas 2003). However, opposite (Brachypodium distachyon, Manzaneda et al. 2012; Mercurialis annua, Buggs & Pannell 2006) and more complex patterns (Cardamine pratensis, Lihová et al. 2003; Dianthus broteri, Balao et al. 2009) have also been found. This lack of a general pattern sustains the doubt as to whether the geographic distribution of cytotypes in the Iberian Peninsula is adaptive or, conversely, if it responds to other ecological processes (Lumaret et al. 1987; Buggs & Pannell 2006; Soltis et al. 2010). In the case of E. mediohispanicum, niches of the two ploidies were significantly different according to the equivalency test but not according to the similarity test. These results allowed us to reject the null hypothesis that both cytotypes have a highly conserved environmental niche, but rather suggest the existence of subtle differences between niches (Visger et al. 2016). However, despite niche differences not being strong enough to be detected by the low-sensitivity similarity test, subtle departures from niche equivalency may lead autopolyploids to escape from minimum cytotype exclusion (Visger et al. 2016). Climatic factors and soil properties seem to provide an adaptive basis to explain the distribution of E. mediohispanicum cytotypes. Indeed, our models identified several environmental variables consistently contributing to explain the disjunct distribution of cytotypes, namely altitude, soil dominant parent material and various climate variables.
Erysimum mediohispanicum diploid populations occur at higher elevations than tetraploids (mean elevations: 1536 and 1088 m a.s.l., respectively), with populations in the contact zone occurring at intermediate elevations (Fig. 4). This elevational segregation of diploid and tetraploid populations seems to be frequent in other diploid–polyploid complexes, such as Chamerion angustifolium (Husband & Schemske 1998), Lotus corniculatus (Gauthier et al. 1998), Anthoxanthum alpinum and A. odoratum (Flegrová & Krahulec 1999 and references therein), Taraxacum section Ruderalia (Meirmans et al. 2003) and Larrea tridentata (Laport et al. 2016). Differences in cytotype distribution associated with population elevation are considered difficult to separate from the effects, among other factors, of latitude, climate and soil (Flegrová & Krahulec 1999). Using niche modelling, we were able to discriminate the importance of elevation from other factors. However, evaluating fitness of cytotypes using reciprocal transplants is required to definitively confirm the adaptive basis of the association of cytotype to elevation (Husband & Schemske 1998; Flegrová & Krahulec 1999; Martin & Husband 2013).
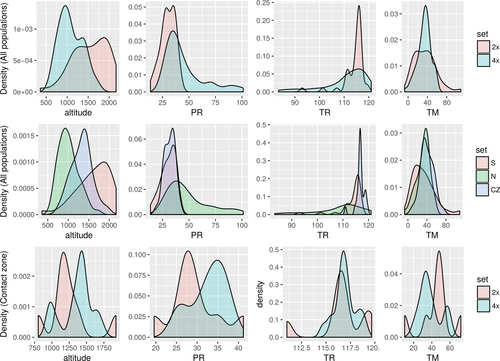
Importantly, phenotypic traits and niche models depend on several climate variables. Interestingly, the three climate variables built on the basis of their putative influence on the E. mediohispanicum life cycle (i.e. precipitation during flowering and fruiting, mean temperature during seedling establishment and temperature range during bud development) were consistently selected as the most influential to explain cytotype distribution. This result demonstrates the importance of considering the biology of the study species when determining the appropriate variables, rather than merely using standard variables.
Our analyses suggest that tetraploid individuals inhabit areas with wetter summers (Fig. 4). This finding contrasts with the expectation that polyploids possess larger but fewer stomata, allowing them to reduce water loss through the leaves, and thus to inhabit dry regions (Levin 2002; te Beest et al. 2012; Manzaneda et al. 2012). Visger et al. (2016) recently found the same pattern in Tolmiea diplomenziesii (2x) and T. menziesii (4x), with a common garden experiment confirming that diploids made better use of water under drought conditions, potentially due to differences in xylem diameter of the two cytotypes. The same may occur in E. mediohispanicum, but specific physiological measurements are necessary to confirm this hypothesis.
After including the valuable information on soil properties in our environmental niche model reconstruction, we found that tetraploids occur on calcareous sandstones much more frequently than diploids, which mostly grow on limestone. Soil differences in water desorption (faster for limestone; Vázquez et al. 2013) may reinforce the lower availability of water in 2x populations during the driest months, thus contributing to a more drastic effect of summer drought. Another interesting result of soil comparison is that 4x populations grow in more diverse soil types, suggesting that they may have increased ecological amplitude. This result is congruent with previous studies on other plant species that attributed larger ecological amplitudes to polyploids due to their increased genomic flexibility and adaptive potential (Levin 2002; Parisod et al. 2010; Wallace et al. 2017).
Contact zone and gene flow between cytotypes
Niche differences between cytotypes seem to be maintained in the contact zone, with diploid and tetraploid populations growing at different altitudes, TM and PR (Fig. 4). This suggests that in the contact zone, cytotypes are distributed in a mosaic zone (Harrison & Rand 1989). In fact, differences in these climate variables are more dramatic at the fine spatial scale of the contact zone than after pooling the whole distribution range (Fig. 4). This result supports the association between ploidy level and environmental variables, suggesting that the observed distribution of E. mediohispanicum cytotypes is, at least partially, explained by the niche differentiation hypothesis.
The Prebaetic Range is the only area where populations of each cytotype are close enough to allow gene flow to occur between them. It was also in this region where the only mixed ploidy population was found. Nevertheless, only one tetraploid individual was found out of 29 plants analysed from this population. This tetraploid plant either originated within the population (through the fusion of unreduced gametes) or was able to reach it from nearby tetraploid populations (the distance to the closest tetraploid population is 15 km). Either way, if this plant has no competitive advantage in fitness in comparison with the more abundant diploids, it will be subjected to strong frequency-dependent selection (Levin 1975). In that scenario, the mating system of the species may play an important role in maintenance of such minor cytotype individuals through self-fertilisation (Rausch & Morgan 2005). However, for this to occur, a similar ability of both cytotypes to inhabit the same population would also be required, which seems unlikely considering the E. mediohispanicum mosaic zone. Thus, despite our results not providing incontrovertible evidence for rejecting the influence of reproductive exclusion and historical factors, the observed distribution of cytotypes seems better explained through niche differentiation.
There was an extremely low frequency of individuals showing intermediate ploidies in the contact zone (only three aneuploid individuals were found in two populations, with a complete absence of triploids). This suggests that hybridisation between cytotypes is rare in nature and points to the occurrence of meiotic abnormalities as the mechanism underlying the low frequency of minority cytotypes observed in natural populations. Meiotic abnormalities (i.e. production of gametes with unexpected ploidy) are common in some species (Brownfield & Köhler 2011; De Storme & Geelen 2013) and have been described in both cytotypes of E. mediohispanicum (Blanca et al. 1992; Clot 1992). These abnormalities may also explain the occurrence of 3x and 5x individuals in the tetraploid populations Em98 and Em54, respectively, as none of the surroundings populations showed the expected ploidy level (2x and 6x, respectively) that could produce, through hybridisation, the individuals with the observed ploidy level.
Phenotypic differences
Most of the evolutionary advantages attributed to polyploids are related to phenotypic changes, especially for traits related to ecological interactions (Segraves et al. 1999; Thompson et al. 2004; Kennedy et al. 2006; Münzbergová 2006; Arvanitis et al. 2007). In this work, we evaluated the existence of significant differences between traits related to survival (plant size) and reproduction (corolla size). In general, we found that tetraploid individuals tend to present thinner stalks than diploids but are taller and their flowers are bigger, with the corolla tube width having the largest difference among cytotypes. These findings are in accordance with patterns reported in other species, with polyploids usually being taller, more robust and producing larger flowers than their diploid counterparts (te Beest et al. 2012 and references therein). Phenotypic changes associated with ploidy have consequences on floral visitors, with polyploids attracting different pollinator assemblages than diploids (Taylor & Smith 1979; Segraves & Thompson 1999). Although an exhaustive comparison must be done with the two cytotypes in sympatry, preliminary analyses have shown marginal, non-significant, differences between pollinator assemblages in diploid and tetraploid disjunct populations of E. mediohspanicum (manova r2 = 0.04, P = 0.07; Muñoz-Pajares 2013).
Conclusions
This work provides a thorough view of the geographic distribution, floral phenotype and environmental preferences of E. mediohispanicum cytotypes. The species is composed of diploid and tetraploid populations, occupying the southern and northern distribution range of the species, respectively. A contact (mosaic) zone between cytotypes was detected, but gene flow between cytotypes was negligible. The differences between niches occupied by diploid and tetraploid individuals are subtle; nevertheless, the distribution of cytotypes seems to be explained through niche differentiation, mainly depending on elevation, soil properties and climate variables. Because we also found a significant positive correlation between ploidy level and corolla tube width, polyploidy may have played an important role in the ecological adaptation of E. mediohispanicum to local biotic and abiotic factors.
Acknowledgements
The authors thank Dr. Sofie Meeus and two anonymous reviewers for comments on a previous version of this manuscript. We are particularly grateful to Dr. Keir Wefferling for assisting with English usage. A. J. Muñoz-Pajares was supported by a post-doctoral fellowship funded by the Portuguese Foundation for Science and Technology (SFRH/BPD/111015/2015). The Portuguese Foundation for Science and Technology with POPH/FSE funds also financed the work of M. Castro (SFRH/BD/89617/2012) and S. Castro (IF/01267/2013), and the Spanish Ministry of Economy and Competitiveness MINECO (CGL2012-34736, CGL2013-47558-P, including EU-FEDER funds) and Junta de Andalucía (P11-RNM-7676, CVI-6649) financed the work of J. M. Gómez and F. Perfectti. Paolo Biella was funded by the Czech Science Foundation (GAČR GP14-10035P) and the University of South Bohemia (grant GA JU 152/2016/P).


