Can we use photography to estimate radiation interception by a crop canopy?
Abstract
Accuracy of determining radiation interception, and hence radiation use efficiency, depends on the method of measuring photosynthetically active radiation intercepted. Methods vary, from expensive instruments such as Sunfleck ceptometers to simple methods such as digital photography. However, before universal use of digital photography there is need to determine its reliability and compare it with conventional, but expensive, methods. In a series of experiments at Lincoln, New Zealand, canopy development for barley, wheat, white clover and four forage brassica species was determined using both digital photographs and Sunfleck ceptometer. Values obtained were used to calculate conversion coefficient (Kf/Ki) ratios between the two methods. Digital photographs were taken at 45° and 90° for barley, wheat and white clover and at only 90° for brassicas. There was an interaction of effects of crop and cultivar for the cereal crops. Barley closed canopies earlier than wheat, and ‘Emir’ barley and ‘Stettler’ wheat had consistently higher canopy cover than ‘Golden Promise’ and ‘HY459′, respectively. Canopy cover was consistently larger at 45° than 90° for cereals. However, for white clover, the angle of digital photography was not important. There was also an interaction between effects of species and method of determining canopy cover for brassicas. Photographs gave higher cover values than ceptometer for forage rape and turnip, but the relationship was variable for forage kale and swede. Kf/Ki ratios of 1.0–1.10 for cereals, white clover and forage rape and turnip show that digital photographs can be used to estimated radiation interception, in place of Sunfleck ceptometer, for these crops.
Introduction
Crop productivity is a product of intercepted photosynthetically active radiation (PARi) over a season and the efficiency with which it is used to produce dry matter (DM; Monteith 1977), the radiation use efficiency (RUE). The accuracy of determining crop RUE depends on the method of measuring PARi and accuracy of DM measurements (Lindquist et al. 2005). Methods of measuring PARi have been previously described (Norman & Campbell 1989; Welles 1990; Welles & Cohen 1996). These include the use of instruments such as tube solarimeters (Szeicz et al. 1964; Szeicz 1974), ceptometers (e.g. O'Connell et al. 2004) and SunScan Canopy Analysis System (Delta-T Devices, UK; Bréda 2003). The PARi can also be estimated from ground cover or measurements of leaf area index (LAI; Burstall & Harris 1983; Firman & Allen 1989). Each approach to determining PARi has benefits and drawbacks. Although the use of instruments is non-destructive, and they are reasonably priced (Burstall & Harris 1983; Steven et al. 1986), they record PARi of green as well as non-green leaves, thus overestimating photosynthetic interception. The requirement for replication makes use of such instruments more expensive in large-scale experiments. These non-destructive instruments are largely used as spot measurements, both in time and space (Wünsche et al. 1995), and therefore are subjective in those respects. Radiation interception can be estimated from percentage ground cover using overhead digital photographs (Steven et al. 1986), followed by modelling with image analysis software, e.g. Quant (Vale et al. 2001), or use of the grid method (Burstall & Harris 1983; Haverkort & Harris 1986; Fahem & Haverkort 1988; Haverkort et al. 1991). Photographs have the advantages of being able to cover a reasonably large area of the plot, being easily reproducible and providing a permanent record of the state of the crop. However, photographs need more time to process and analyse (Wünsche et al. 1995) and require image analysis systems.
 (1)
(1) (2)
(2) (3)
(3)Siddique et al. (1989) reported that plotting In(1 – i) against In(1 – f) gives the ratio Ki/Kf as the gradient of a straight line for each crop and/or cultivar. This ratio allows calculation of either i or f from the other known quantity.
Relationships between foliage cover and PARi have been established for annual crops, e.g. field bean (Vicia faba L.), sugar beet (Beta vulgaris L.), barley (Hordeum vulgare L.; Steven et al. 1986), potato (Solanum tuberosum L.; Fahem & Haverkort 1988) and perennial plants such as trees (Wünsche et al. 1995; Gendron et al. 1998). However, similar relationships for crops of forage brassicas (Brassica spp.) and white clover (Trifolium spp.) and how they compare with botanically different crops (mono- versus dicotyledons) such as cereals, is lacking. Where there are differences between the methods for determining canopy cover, there is no information on conversion coefficient (Ki/Kf) values. The objectives of this study were to determine: (i) the precision with which PARi can be estimated from canopy cover for crops of different leaf architecture (mono- versus dicotyledons), angles for digital photographs and crop species; and (2) conversion coefficients, Ki/Kf, where the two methods differ.
Material and Methods
Three experiments are described, all located at Lincoln, Canterbury, New Zealand (43o39′ S, 172o28′ E) and carried out between 2009 and 2011. Two experiments were at The New Zealand Institute for Plant & Food Research Limited (Plant & Food Research) farm, on a deep, well-drained Templeton silt loam (Udic Ustochrept, USDA Soil Taxonomy; Martin et al. 1992; Jamieson et al. 1995). The third was at the nearby AgResearch farm on a Wakanui silt loam (Typic Eutrachept; Hermawan & Cameron 1993). Two experiments were carried out in the 2010–2011 season; one investigating the effects of different rooting systems (strong versus weak) on growth and development of wheat (Triticum aestivum L.), barley and rye (Secale cereale L.) cultivars; the second investigated the effects of spring management techniques on seed production of two white clover cultivars (Chakwizira et al. 2011). These will be referred to as Experiments A and B, respectively. The third experiment investigated effects of nitrogen (N) rates and timing of application on four forage brassica species: kale, rape, swede and turnip, and this will be referred to as Experiment C.
Experiment A used a randomised complete block design, consisting of a factorial combination of three cereal crop species (wheat, barley and rye) and two cultivars, each replicated six times. Canopy cover was determined for wheat cv ‘Stettler’ (DePauw et al. 2009) and cv ‘HY459’ (De Pauw et al. 2000)) and barley (cv ‘Emir’ and ‘Golden Promise’; Shtaya et al. 2007) only. These were classified as either weak- or strong-rooted cultivars, with ‘Stettler’ and ‘Emir’ as strong rooted and ‘HY459’ and ‘Golden Promise’ as weak rooted. Plots were two-drill width by 12-m long (~48 m2), each at row spacing of 150 mm. Deep soil tests were taken on 23 August 2010 to 1.5-m depth and the test results for the top 150-mm depth were: pH 6.2, phosphorus (Olsen P) 24 mg, potassium (K) 260 mg, calcium (Ca) 1250 mg, magnesium (Mg) 60 mg, sodium (Na) 55 mg·kg−1 soil, and available N 60 kg·ha−1. The amounts of soil nutrients were determined as ‘MAF quick-test units’ (Mountier et al. 1966) and converted into mg·kg−1 dry soil using the following conversion factors: Ca, x125; K, x20; Mg, Na, x5; P, x1.1 (Chapman & Bannister 1994). Full soil details for the experimental site are described in Jamieson et al. (1995) and Martin et al. (1992). The site had been under a potato (Solanum tuberosum L.) crop for the previous 2 years.
Site cultivation involved deep ploughing on 24 August 2010 followed by power harrowing 2 days later. The experiment was sown on 26 August 2010 at a target population of 275 plants·m−2, at 160–180 kg·ha−1 seed, with 95% germination. Basal fertiliser was applied at 150 kg·ha−1 Cropzeal™ 15P (13.5:15.1:12:0.8) at sowing. Additional fertiliser was applied as urea (46% N), at 108 kg·N·ha−1 split applied on 20 October 2010 and 3 November 2010, giving a total of 120 kg·N·ha−1, 22.6 kg·P·ha−1, 18 kg·K·ha−1 and 12 kg sulphur (S) ha−1. Light interception measurements were taken once every week from 22 September 2010 until full cover, assumed to be when the crops were intercepting about 95% of the incoming radiation. Herbicides, pesticides and fungicides were applied as needed, so that crop growth and development were not compromised.
Experiment B included two white clover cultivars (Trifolium repens L. cv ‘Apex’ and ‘Kotare’) grown under three spring treatments as described in Chakwizira et al. (2011). Briefly, the experiment was a randomised complete block design consisting of two white clover cultivars and three spring management techniques, replicated four times. The three management techniques were mechanical topping, chemical topping (two herbicides at different rates) and use of plant growth regulators (PGR; Moddus®, a.i. 250 g·l−1 trinexapac-ethyl EC).
Experiment C is described in recently published papers (Fletcher & Chakwizira 2012a,b; Fletcher et al. 2012). Briefly, this was a split plot experiment, with the four brassica species as main plots and a factorial combination of rate and timing of N application as subplots, replicated four times. The four forage brassica crops represented both winter-fed ‘Kestrel’ kale (Brassica oleracea ssp. acephala) and ‘Keystone’ swede (Brassica napus ssp. napobrassica or rapifera or rapifera), and summer-fed ‘Titan’ rape (Brassica napus spp. biennis) and ‘Barkant’ turnip (Brassica rapa var. rapifera; syn. B. campestris) crops. The N treatments consisted of two rates and two times of fertiliser N application. The application rates and dates varied within crop type, to reflect the longer duration and higher potential yield of the winter-fed crops. For the summer-fed crops, treatment 1 consisted of 200 kg·N·ha−1 applied 16 days after sowing (DAS); treatment 2 consisted of 200 kg·N·ha−1 applied 40 DAS; and treatment 3 consisted of 200 kg·N·ha−1 applied 16 DAS and a further 200 kg·N·ha−1 applied 40 DAS (total of 400 kg·N·ha−1). For the winter crops, treatment 1 consisted of 400 kg·N·ha−1 applied 16 DAS; treatment 2 consisted of 400 kg·N·ha−1 applied 72 DAS; and treatment 3 consisted of 400 kg·N·ha−1 applied 16 DAS and a further 400 kg·N·ha−1 applied 72 DAS (total of 800 kg·N·ha−1). Crops were fully irrigated and nutrients (except N) were managed so as not to limit crop growth. Herbicides and pesticides were applied as necessary to control weeds and pests.
For all three experiments, best fertiliser, weed, pest and disease management practices were used to minimise any limitation to growth and yield apart from the treatments, e.g. time and rate of N application for the brassica crops. For white clover, only the control treatments will be considered in this paper.
Methodology
Digital photographs were used to determine percentage ground cover for green leaves of the crops and a Sunfleck ceptometer (AccuPAR model PAR-80; Decagon, Pullman, WA, USA), hereinafter referred as the ceptometer, for measuring PARi. For the barley, wheat and white clover experiments, both percentage ground cover and PARi were measured at the same place, frequency and day. The fixed positions were marked using a 0.5-m2 quadrat (1 m × 0.5 m), with rods used to mark the position for the duration of the experiment (Fig. 1). Channels were dug into the ground to insert the ceptometer for the white clover and cereal crops, and one measurement was taken for ‘above-’ and one in the channel for ‘below-’canopy position at each location. Photographs were taken at two angles: vertical (90°) and at 45°, at 1.50 m above the centre of each quadrat for each plot on each occasion using a commercial camera (Olympus Digital 800, 24 mm camera, resolution 8 megapixels; Olympus, Tokyo, Japan). The photographs were later cropped (Currie & Smialowski 1961) to the size of the quadrat.
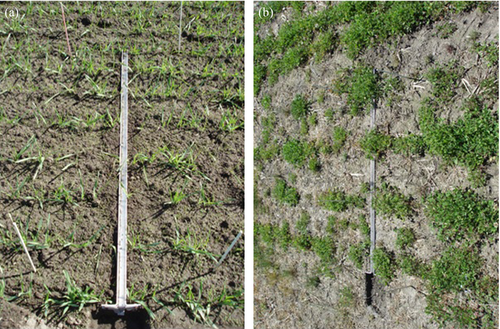
Photographs for percentage ground cover for the brassica crops were taken at randomly selected places across five rows in each plot, vertically above the crops. For PARi, two measurements were taken in rapid succession for the ‘above-’ and five for the ‘below-’canopy position at locations selected randomly in each plot. Other than that, the steps taken for the brassica experiment were similar to those for the cereals and white clover experiments. All PARi measurements were confined to within 1 h of local noon (O'Connell et al. 2004), as spot measurements and were limited to clear days. Steven et al. (1986) reported that differences in between clear and overcast skies are small in summer as most solar radiation comes from angles of elevation >30°. Digital photographs were taken at the same time as PARi.
Data analysis
All statistical analyses were carried out in GenStat version 13 (VSN International, Hemel Hempstead, UK). Initially, data were assessed using exploratory data analysis (EDA; Good 1983) to obtain an understanding of results within each experiment. This was followed by an assessment of difference between the two photographic angles in their efficacy at predicting percentage light measured by the ceptometer. This was tested by deviance comparison of the two mixed models fitted with restricted maximum likelihood (REML; Gilmore et al. 1995). Model testing was done by partitioning sums of squares in anova. Once one of the two angles was chosen as the better angle, equivalence was tested through graphs and analyses. A 1:1 line was used to show systematic variations between the two methods. Similarly, variations around the mean of the two procedures were assessed as described in Bland & Altman (1986). The mean values were the average between ceptometer and digital photography readings and therefore values higher than the mean are shown as negative and vice versa. Variability associated with predicted means is indicated with the Least Significant Difference (LSD) tests (α = 0.05). Conversion coefficients, Ki/Kf, for all crops were determined as described in Eq. 1-3.
Results
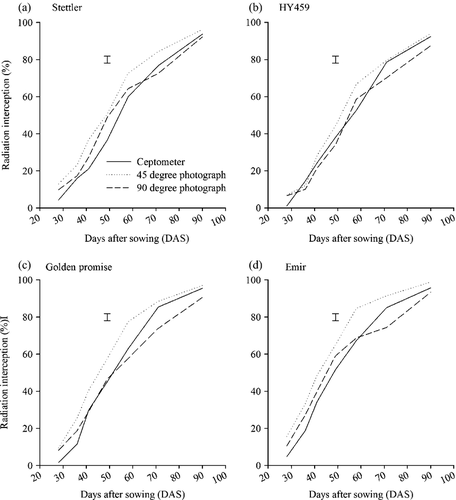
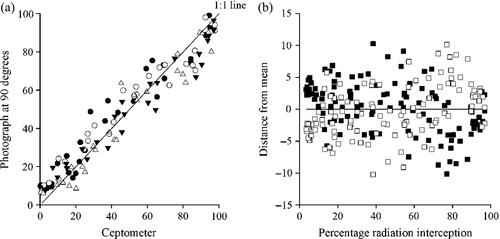
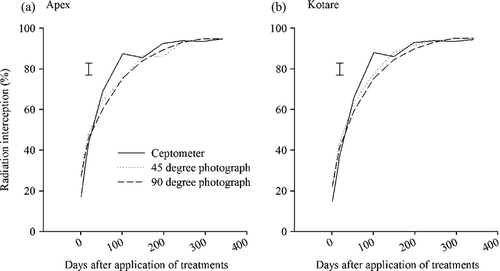
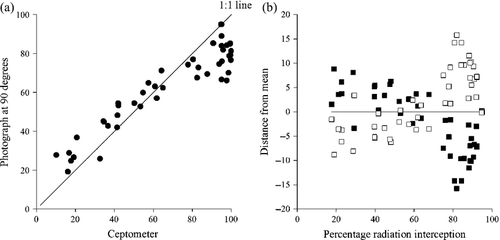
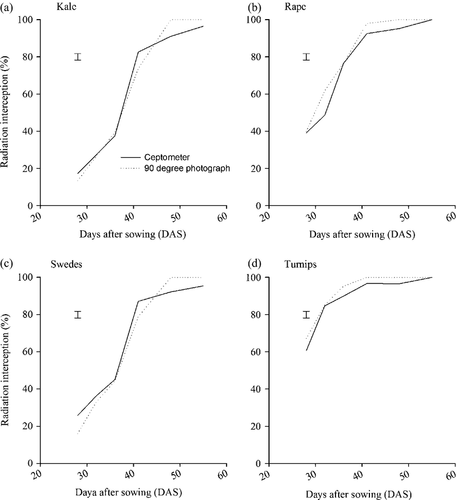
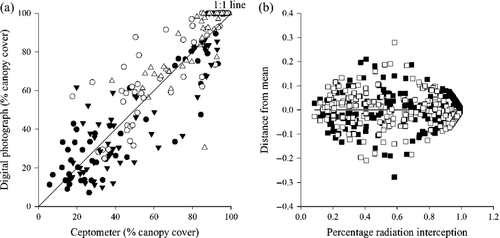
The general trend in both percentage ground cover and PARi for all the crops was an increase (P < 0.001) in canopy cover with time after sowing (Figs 2, 4, 6). Linear relationships were established between percentage ground cover and PARi for cereals (Fig. 3a), white clover (Fig. 5a) and brassica species (Fig. 7a) crops. The relationships between the two methods around the mean for the periods of measurements were mirror images of one another (Figs 3b, 5b, 7b), with ceptometer measurements lower (positive values) earlier in the season than those from digital photographs (negative values).
Experiment A: Wheat and barley
The relationship between the methods was not consistent (P < 0.03) across crops or across cultivars within the crops. There was also an interaction (P = 0.04) between crop effects and cultivar effects on canopy cover, although this was not consistent on all occasions. Barley crops closed canopies earlier (P < 0.01) than wheat crops (Fig. 2). ‘Emir’ barley had consistently higher canopy cover than ‘Golden Promise’. Wheat cv ‘Stettler’ also closed canopy earlier than cv ‘HY459’.
Separating the 45° and 90° photographs improved the fit of the model (P < 0.001) on all sampling occasions. The percentage ground cover values for 90° photographs were lower than those for 45° photographs, but were consistently closer to ceptometer values (Fig. 2) earlier in the season, dropping below those of the ceptometer as the crops reached full cover. For both crops, canopy cover was consistently higher (P < 0.001) when photographs were taken at an angle of 45° than at 90°. Digital photographs gave higher percentage ground cover values earlier in the season (Fig. 3) at both sampling angles. However, as the crops reached full cover, vertical photographs gave lower values than those from the ceptometer.
Readings of radiation interception (PARi; ceptometer) at <75% (Fig. 3) for all cereal cultivars were invariably lower than those for ground cover, so that at higher PARi percentage ground cover decreased below the 1:1 line. Conversely at >75%, ground cover values from photographs were consistently lower than those from the ceptometer for both crops.
Figure 3b also shows the changes between the two methods around the mean throughout the sampling period. Ceptometer measurements were lower (positive values) earlier in the season than those of digital photographs (negative values), but this reversed at about 70% full cover. However, there was good agreement between the linear ceptometer and 90o digital photograph (Fig. 2) values for both crops, compared with those for 45o digital photographs, which consistently gave higher values.
Experiment B: White clover
There was little evidence that separating values from the 45° and 90° photographs improved the fit of the model (Fig. 4), except on the first three sampling occasions for both cultivars. There was also no difference (P = 0.88) between the cultivars in terms of canopy development, except on the first two sampling occasions. The ceptometer measured lower values (Fig. 4) earlier in the season but much higher values between sampling occasions 4 and 6 (about 100 days after sowing; DAS). However, even at the largest point of difference, the ceptometer values were only 13% higher. Figure 5 shows that on earlier sampling occasions (<75% full cover), the digital photographs gave higher canopy cover values, and towards the end of the season (>75% full cover), slightly lower values than the ceptometer (see also Fig. 4). Other than these differences, however, the values were randomly scattered and quite narrowly distributed.
Experiment C: Brassica species
There was an interaction (P < 0.001) between the effects of the method of determining canopy cover development and crop species (Fig. 6), although this was not consistent on all sampling occasions. Digital photographs gave higher canopy cover values than PARi for the summer-fed crops rape and turnip, while the relationship was variable for the winter-fed crops kale and swede. There were also differences (P < 0.001) in cover development among the four brassica species (Fig. 6), with the rape and turnip crops attaining full cover earlier. The application of N did not affect the rate of canopy development for the four brassica species. Methods of canopy cover determination returned similar values (Fig. 6) during earlier development, but the photographs measured full cover earlier than the ceptometer on the final sampling occasions.
Figure 7a shows a strong separation in the relationship of values from the photographs and the ceptometer around the 1:1 line. There was an interaction between the effects of method and of crop, with a high degree of variation overall around the 1:1 line. This is in contrast to the very close alignment in Fig. 6, where there is an even distribution around the 1:1 line for the winter-fed crops earlier in the season (up to 50% canopy cover), and thereafter PARi (ceptometer) recorded predominantly higher values than digital photographs. However, for summer-fed crops, digital photographs tended to record predominantly higher values throughout the sampling period. Although measurements for both summer- and winter-fed crops were made at the same time, Fig. 7a shows that summer-fed brassica crops had faster canopy development, >30% cover compared with <10% for the winter-fed crops at the start of sampling. Fig. 7b shows an even distribution around the mean for values from both methods of measurement. Fig. 8 shows the derived relationship between logarithmic foliage cover and radiation transmission ratio, with corresponding values of Kf/Ki shown in Table 1.
| crop species | image angle (°) | relationship | adjusted R2 (P < 0.05) | Kf/Ki |
|---|---|---|---|---|
| barley | 45 | f = 0.92i | 0.98 | 1.08 |
| barley | 90 | f = 0.90i | 0.98 | 1.10 |
| wheat | 45 | f = 0.94i | 0.98 | 1.06 |
| wheat | 90 | f = 0.97i | 0.99 | 1.03 |
| white clover | 45 | f = 0.95i | 0.95 | 1.05 |
| white clover | 90 | f = 0.95i | 0.95 | 1.05 |
| kale | 90 | f = 0.83i | 0.75 | 1.20 |
| rape | 90 | f = 0.92i | 0.48 | 1.09 |
| turnip | 90 | f = 1.00i | 0.40 | 1.00 |
| swede | 90 | f = 0.69i | 0.77 | 1.45 |
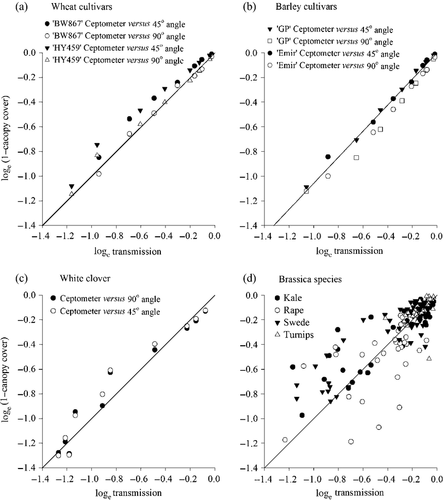
Pooling data for the barley and wheat cultivars (Fig. 8), the regression lines (Table 1) were homogeneous and accounted for ≥98% of the variance. Therefore, for barley and wheat canopy cover measured with digital photographs was a valid estimate of radiation interception obtained from ceptometers.
The ratios were very similar for cereals and white clover crops, where measurements were taken from a fixed place and at the same time, and less similar for brassica species, where measurements were taken randomly in the plots. The correction factors (Kf/Ki) were closer, at between 1.00 and 1.10 for the white clover, compared with 1.00 and 1.45 for the brassica species (Table 1). The Kf/Ki ratio tended to be lower for digital photographs taken vertically for wheat crops, but not for barley and white clover. For brassica crops, the Kf/Ki was closer or equal to 1.0 for rape and turnip (higher growth rate crops) than for the slower-growing winter species.
Discussion
The study looked at two methods of determining canopy development, ground cover with digital photographs and radiation interception with Sunfleck ceptometer, and how these can be extrapolated to determine the proportion of light (radiation) intercepted by the crops. The paper does not look at the quality of light or light frequencies of PAR sensors for the cameras and ceptometer or how they may affect conversion co-efficiencies. It is assumed that once crop cover has been determined, then the amount of PAR intercepted can be calculated.
These studies show that the relationship between percentage ground cover determined with digital photographs and radiation interception determined with the ceptometer were sufficiently close for barley, wheat, white clover and the summer brassica crops for the photographs to be used as a surrogate for measurements of light interception. Digital photography predicted higher (negative values) values for cover earlier in the season than the Sunfleck ceptometer (Figs 3b, 5b, 7b), but this was reversed as the crop neared full canopy cover. This can be attributed to photographs involving whole leaf areas irrespective of the angles facing direct light, and therefore representing more cover, whereas with the ceptometer, some of the light may still be passing between leaves, depending on both sun and leaf angle and thus recorded as open canopy. This, however, changes as the number and size of leaves and hence leaf area increases, blocking more light that would have been received by the sensors, while the photographs still show leaf area of the upper leaves only. The inflexion point for all the crops analysed was within the 60–70% range.
The use of digital photographs to predict light interception may depend on the angle at which the photographs were taken for cereals (Fig. 2), but not for white clover (Fig. 4). Higher values were consistently produced when digital photographs were taken at 45° than at 90° throughout the sampling period for cereal crops, while the values from the ceptometer measurements were closer to the 90° photographs. However, at the end of the sampling period there was little difference between ceptometer values and those from the 45° photographs (Figs 2, 5). This suggests that prediction of light interception using photographs may be accurate when photographs are taken at 90°, but may be underestimated at the end of the season. This may lead to differences in RUE calculated using ground cover-based photographs.
For the barley and wheat crops, the difference between cultivars in attaining full canopy cover (Fig. 3a) can be attributed to differences in root structure. Both ‘Emir’ barley and ‘Stettler’ wheat cultivars are deep-rooted, with a high root volume compared with ‘Golden Promise’ and ‘HY459’, respectively. Deep and high root volume characteristics may have resulted in improved water and nutrient uptake and hence increased canopy growth, as reported in other crops (Grant et al. 2001).
For white clover, there were no differences in canopy cover between digital photographs and ceptometer measurements at the end of the season, irrespective of the angle at which the digital photographs were taken. Overall, the relationships between canopy cover as measured from digital photographs and ceptometer were similar when measurements were taken from the same place rather than randomly.
For forage brassica crops, the higher variation around the 1:1 line (Fig. 7 compared with Fig. 6) when cover was based on days after sowing (DAS) could be attributed to the sampling procedure, where both types of measurement were taken at random places in the plots. Brassica crops have a variable and extended establishment period (Zyskowski et al. 2004) and this may have resulted in variable cover proportions within and across the plots; this is supported by low R2 values (Table 1). Furthermore, brassica species also vary in their phenology. Fletcher et al. (2012) using the same dataset, established that summer brassicas forage rape and turnip have a faster rate of canopy closure (base temperature = 4 °C) at 360 degree days (°Cd) and 300°Cd, respectively. The winter-fed brassicas closed canopies after about 500°Cd. These differences were attributed to a variable phyllochron across the brassica species at 47°Cd for turnip, 60°Cd for rape, 51°Cd for swede and 76°Cd for kale. The slow rate of canopy closure (similar to kale) and a short phyllochron (similar to turnip) for swede implies that individual leaves of swede are much smaller than those of kale.
The Kf/Ki ratios of 1.0–1.10 for cereals, white clover and summer brassicas mean the use of digital photographs to determine canopy cover was a valid method to estimate radiation interception compared with the ceptometer, and hence the two methods may be used interchangeably. The Kf/Ki ratio for barley (Table 1) was about 20% less than that reported by Steven et al. (1986), and this may be attributed to the different methods used: Quant versus Grid, respectively. Steven et al. (1986) also reported that the Quant method was more suited to broadleaved crops. Moreover the close relationship for white clover and summer brassica (Table 1) supports this view. Less direct relationships were established for the winter-fed brassicas kale and swede. The high Kf/Ki ratio for swede (Table 1) may be attributed to undiagnosed disease that lead to loss of leaves (Fletcher & Chakwizira 2012b), meaning that the crop never stayed at full cover for long periods of the growing season. Nevertheless, the Kf/Ki ratios established here may be used to convert photographic measurements of cover into radiation interception for possible crop growth analysis.
Conclusions
Canopy cover was consistently higher when photographs were taken at an angle of 45° than at 90° for the cereal crops. For white clover, the angle of digital photographs had no effect on canopy cover. Digital photographs gave higher canopy cover values than the ceptometer for summer-fed brassica crops forage rape and turnip, while the relationship was variable for the winter-fed brassica crops forage kale and swede. In general, the conversion coefficient (Kf/Ki) ratios between canopy cover and radiation interception were 1.0–1.10 for cereals, white clover and summer brassica crops. This means that the use of digital photographs to determine canopy cover provides a valid estimate of radiation interception compared with that using a Sunfleck ceptometer, and hence the two methods may be used interchangeably.
Acknowledgements
The three experiments were funded by the Ministry of Business, Innovation and Employment (MBIE) – formally FRST – through the Land Use Change and Intensification (C02X0812) programme for both the brassica luxury N (Obj. 2) and Roots for Sustainable Production (wheat and barley; Obj. 1) experiments, and the Advanced Seed programme (LINX0803, Obj.1) for the white clover experiment.


