Identifying Risk Factors for Graft Failure due to Chronic Rejection < 15 Years Post-Transplant in Pediatric Kidney Transplants Using Random Forest Machine-Learning Techniques
ABSTRACT
Background
Chronic rejection forms the leading cause of late graft loss in pediatric kidney transplant recipients. Despite improvement in short-term graft outcomes, chronic rejection impedes comparable progress in long-term graft outcomes.
Methods
Data from the national Standard Transplant Analysis and Research (STAR) quarterly file from 1987 to 2023, provided by the Organ Procurement and Transplantation Network (OPTN), and machine-learning techniques were leveraged to determine novel risk factors for graft failure due to chronic rejection in pediatric kidney transplants. A predictive model was developed in conjunction, based on the performances of six classification models, including logistic regression, k-Nearest Neighbors, Support Vector Machine, Decision Tree, Artificial Neural Network, and Random Forest.
Results
The 19 pre-transplant and at-transplant factors identified include those substantiated in literature, such as living donor type, cold ischemic time, human leukocyte antigen (HLA) matching, recipient age, and recipient race. Other factors include one-haplotype matched transplants, recipient age being < 5 years, and the proximities of the most and least recent serum crossmatch tests to transplantation. The latter may correlate with recipient sensitization and socioeconomic disparities, but further research must be done to validate this hypothesis. The Random Forest model was selected based on its performance metrics (AUC 0.81).
Conclusions
This case–control study identifies key factors for chronic rejection-caused graft failure 15 years post-transplant in pediatric kidney transplants and develops a Random Forest predictive model based on these factors. Continued investigation is needed to better understand the variables contributing to pediatric chronic kidney rejection.
Abbreviations
-
- AUC
-
- area under the curve
-
- HLA
-
- human leukocyte antigen
-
- KNN
-
- k-nearest neighbors
-
- OPTN
-
- Organ Procurement and Transplantation Network
-
- RF
-
- Random Forest
-
- STAR
-
- Standard Transplant Analysis and Research
1 Introduction
Recent decades have witnessed significant advancement in pediatric kidney transplantation. The most notable progress can be observed in short-term outcomes, where 1-year graft survival has increased from 81% in 1987 to 97% in 2010, and 1-year patient survival has increased from 95% in 1987 to 99% in 2010 [1]. However, numerous studies have observed that comparable improvements in long-term results have not yet been realized [2].
Chronic rejection, the immune-mediated process wherein a transplanted organ undergoes gradual deterioration, forms the leading cause of late graft failure in pediatric kidney transplantation [3, 4]. Due largely to chronic rejection, the half-life of a pediatric kidney graft is 12–15 years, frequently necessitating re-transplantation during the patient's lifetime [5]. However, re-transplantation is associated with an elevated risk of graft loss, rendering a second transplant less favorable than a long-lasting primary transplant [6]. Therefore, it is preferable to reduce the occurrence of chronic rejection and improve primary transplant survival.
Methods of preventing chronic rejection relate to minimizing acute rejection, as acute rejection has been identified as a significant risk factor for chronic rejection [7, 8]. Such measures include optimization of donor-recipient human leukocyte antigen (HLA) matching and adherence to immunosuppressive regimens [9]. Despite the efficacy of these measures in reducing acute rejection, they fail to consistently ensure the absence of chronic rejection.
There do not exist many pediatric kidney transplantation models that predict for chronic rejection-caused graft failure. A 2017 review examined 39 studies that developed or validated risk prediction models for graft failure in kidney transplants [10]. Of these studies, none targeted the pediatric population. In 2021, a predictive model for graft failure in pediatric kidney recipients was proposed, but it lacks specificity to cases of graft failure caused by chronic rejection [11]. This study proposes a predictive model for chronic rejection-caused graft failure in pediatric kidney transplants. We hypothesize that there exist factors distinguishing recipients who experience chronic rejection within 15 years post-transplant from those who do not.
2 Materials and Methods
2.1 Patient Selection
This study used de-identified, publicly available data from the Standard Transplant Analysis and Research (STAR) quarterly file provided by the Organ Procurement and Transplantation Network (OPTN). The file includes information on all waiting list registrations and transplants listed or performed in the United States from 1987 to 2023, and the dataset encompasses demographic and clinical details pertaining to donors and recipients. Data were filtered to include pediatric kidney transplant recipients based on age at transplant (< 18 years) and organ (kidney). The threshold for graft survival was established at 15 years, motivated by it being the upper limit of the half-life for pediatric kidney transplants [5]. Chronic rejection-caused graft failure was determined using a variable in the dataset that indicated chronic rejection as the primary etiology of graft loss. Duration of graft survival was determined using an existing variable. Data were collected in accordance with the terms of service and privacy policies of the OPTN.
2.2 Filtering for Pre-Transplant and At-Transplant Sub-Files and Variables
This study aimed to rely on pre-transplant or at-transplant features for predicting graft survival at 15 years to identify risk factors and aid in pre-transplant interventions to enhance long-term outcomes. Thus, sub-files containing post-transplant follow-up and discharge data were discarded. Sub-files containing recipient and donor characteristics, recipient and donor HLA data, recipient panel reactive antibody and crossmatch data, and waitlist data were included.
2.3 Combining Variables Common to Sub-Files
Due to concatenating sub-files together, variables present on more than one sub-file were redundantly carried over. Upon inspection, many of these variables contained distinct information. To maximize data retention, these variables were combined into “union” variables. If versions of the same variable conflicted at a given row, the “union” value for that row was set to null. Less than 0.4% of the “union” values were set to null.
2.4 Feature Engineering
Two types of variables were engineered into additional features: dates and antigens. Columns were created for the duration between each date and transplant date, as information can be inferred from this duration's relationship to graft survival. For antigens, the data included donor and recipient HLA alleles. Variables assessing the HLA-A, HLA-B, HLA-DR locus mismatch levels and total HLA mismatch level already existed in the given file. Additional columns were created to indicate whether each allele exhibited donor-recipient concordance. All variables present at this stage, including alleles analyzed, are listed (Appendix S1).
2.5 Imputation of Missing Values
The failure class consisted of 3703 transplants; the success class consisted of 3626. Variables and transplants with a significant number of missing values were addressed by removing variables with fewer than 50% non-null values and transplants with fewer than 75% non-null variables. The resulting data consisted of 6604 transplants (3362 = failure; 3242 = success) and 132 variables. Missing values were imputed via k-Nearest Neighbors Imputation (k = 3). All variables satisfying both missingness thresholds are listed (Appendix S2).
2.6 Model Selection
Preliminary feature selection was carried out by performing mutual information 20 times and recording the frequency with which each variable was among the 20 most significant variables. The 20 variables with the highest frequencies were used for model selection. After utilizing grid-search to refine hyperparameters, six models were evaluated based on the area under the curve (AUC) statistic: logistic regression (AUC 0.67), k-Nearest Neighbors (AUC 0.65), Support Vector Machine (AUC 0.67), Decision Tree (AUC 0.68), Artificial Neural Network (AUC 0.71), and Random Forest (AUC 0.75). Based on AUC performance, Random Forest was selected as the model. A Random Forest (RF) model is an ensemble learning algorithm that constructs multiple decision trees using bootstrapped samples of the data and random feature subsets, reducing overfitting and providing robust predictions for classification problems. The scikit-learn and Keras APIs were utilized to implement machine-learning models. After optimization by grid-search, the final hyperparameters were thus comprised: n_estimators = 700, criterion = “entropy,” max_depth = 15, min_samples_split = 2, min_samples_leaf = 2, bootstrap = False, random_state = 42.
2.7 Revisiting KNN Imputation
KNN imputation was revisited to optimize the number of neighbors used for imputation. For each test, feature selection and hyperparameter tuning were conducted as described. The best model was associated with a k-value of 30 (AUC 0.81).
2.8 Revisiting Feature Selection
Among the 20 features associated with the best model, two variables were found to be highly correlated due to overlapping definitions. After feature importance was determined, the less important variable was eliminated. The final model used the 19 remaining variables.
2.9 Subgroup Analysis by Sex
To perform subgroup analysis by sex, the data were split by recipient sex. The remaining variables were analyzed for significant differences between subgroups. After hyperparameter optimization by grid-search, the RF model was trained, validated, and tested on the subgroups. Differences between continuous and categorical variables across subgroups were evaluated using the Mann–Whitney U test and chi-square test of independence, respectively.
3 Results
3.1 Risk Factors Identified Using RF Model
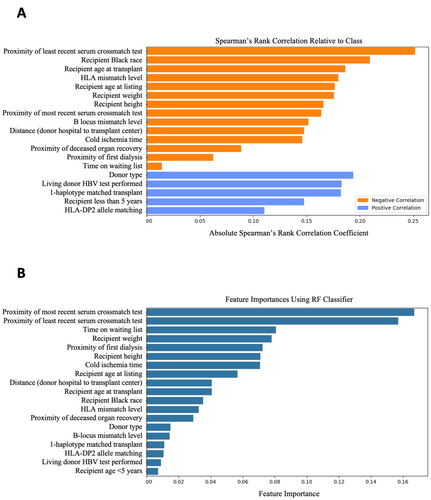
The final dataset consisted of 6604 transplants and 19 features. Demographic characteristics are shown (Table 1). The number of chronic rejection and survival cases with missing data prior to imputation are shown (Table 2). The Spearman's rank correlation coefficients of variables relative to graft survival at 15 years post-transplant are visualized (Figure 1A). The importances attributed to variables by the RF classifier are visualized (Figure 1B). All features, except waiting list duration, were found to be significant (p < 0.05) using the Mann–Whitney U test and chi-square test of independence for continuous and categorical variables, respectively. Proximity of least recent serum crossmatch test refers to the duration in days between the earliest serum crossmatch test date and transplant date. Similarly, proximity of deceased organ recovery refers to the duration in days between organ recovery and transplantation. For living donor transplants, this variable has a mean of 0.038 rather than the expected value of 0.0, likely due to the imputation method. Mismatch level refers to the number of mismatches on a given locus. HLA mismatch level is the sum of HLA-A, HLA-B, and HLA-DR mismatch levels. Recipient height and weight are absolute values instead of percentiles by age. Living donor HBV test performed refers to whether the HBV test was performed on the living donor. For deceased donor transplants, this variable has a mean of 0.00, as expected.
| Characteristic | Chronic rejection (n = 3362) | Survival > 15 years (n = 3242) |
|---|---|---|
| Sex, % | ||
| Female | 43.0 | 38.9 |
| Male | 57.0 | 61.1 |
| Race, % | ||
| White | 50.0 | 67.0 |
| Black | 26.7 | 10.4 |
| Hispanic/Latino | 19.7 | 17.5 |
| Asian | 1.6 | 3.5 |
| American Indian/Alaska Native | 0.9 | 1.2 |
| Native Hawaiian/other Pacific Islander | 0.4 | 0.2 |
| Multiracial | 0.6 | 0.2 |
| Agea, % (year) | ||
| 0–5 | 12.3 | 25.1 |
| 5–13 | 33.4 | 35.7 |
| 13–18 | 54.4 | 39.2 |
- a The first age value is inclusive, and the second age value is exclusive (e.g., the 5–13 category includes all recipients who are at least 5 years of age but not yet 13 years).
| Feature | Chronic rejection | Survival > 15 years |
|---|---|---|
| Proximity of most recent serum crossmatch test | 1987 | 167 |
| Proximity of least recent serum crossmatch test | 2064 | 163 |
| Cold ischemia time | 500 | 733 |
| Recipient age at listing | 870 | 1354 |
| Time on waiting list | 870 | 1354 |
| Proximity of deceased organ recovery | 714 | 1084 |
| Recipient height | 137 | 175 |
| Recipient weight | 78 | 89 |
| HLA mismatch level | 12 | 13 |
| B-locus mismatch level | 5 | 6 |
| Distance from donor hospital to transplant center | 33 | 35 |
| Proximity of first dialysis | 888 | 1112 |

Subgroup analysis by sex found significant differences (p < 0.05) between the sexes in age at listing, age at transplant, recipient height, weight, Black race, and being < 5 years. The signs (e.g., positive) of the Spearman correlations for all variables with respect to graft survival were shared across subgroups. The model performed with AUC 0.82 and 0.80 on the female and male subgroups, respectively.
3.2 Model Threshold Modifications
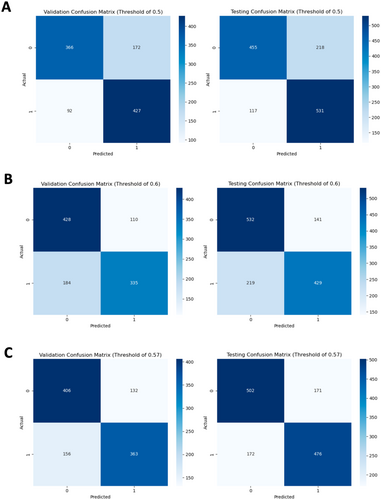
The model's default threshold of 0.5 resulted in a high false positive rate. The validation and test confusion matrices associated with this value are visualized (Figure 2A). The four cells of the matrix display the counts for true negatives (top left: correctly predicted graft failure), false positives (top right: failure when predicted survival), true positives (bottom right: correctly predicted survival), and false negatives (bottom left: survival when predicted failure).

The threshold was modified to 0.6, as it is preferable to encounter false negatives compared to false positives. The consequences of false negatives are typically limited to increased monitoring or testing, while false positives may lead to the mismanagement of high-risk patients [12]. The resulting confusion matrices are visualized (Figure 2B). The threshold of 0.6 was adjusted to 0.57 after observing that a threshold of 0.6 resulted in a poor sensitivity of 0.66. The resulting confusion matrices are visualized (Figure 2C). Choosing between thresholds depends upon the priority given to decreasing the false positive rate and increasing the false negative rate. The model utilizing a threshold of 0.57 was selected, given its superior overall performance and satisfactory management of false positives.
3.3 Model Performance Evaluation
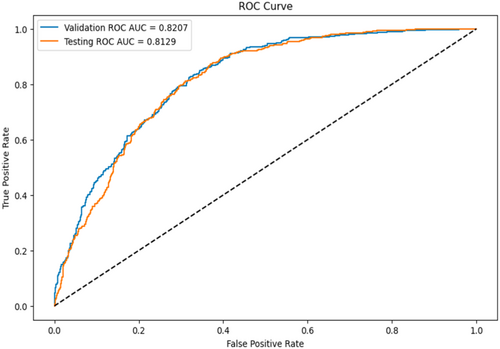
The RF model with threshold 0.57 was evaluated on the testing set. The model achieved an AUC of 0.81, precision of 0.74, and accuracy of 0.74. The AUC curve is visualized (Figure 3).

4 Discussion
Several features used by the model have been cited in literature as risk factors for chronic rejection in pediatric kidney transplants. Deceased donor type, Black race, prolonged dialysis and cold ischemic time, adolescent age, and increased level of HLA mismatching have been associated with poorer long-term graft survival, while recipients < 5 years have been noted to exhibit excellent long-term graft outcomes when compared to older pediatric patients [13-19].
Interestingly, Spearman's correlation appears to prefer categorical variables over continuous variables, while the RF classifier appears to favor the opposite. Key similarities include importance placed on the proximity of the least recent serum crossmatch test, physical characteristics (age, height, weight), living donor, Black race, and HLA matching. In the subgroup analysis by sex, six variables were determined to be significantly different across subgroups. However, the sharing of Spearman's correlation signs for all variables across subgroups suggests differences in variable distribution rather than relationship to graft survival. The RF model performed similarly on both subgroups.
Regarding the importance of recipient height and weight, Bonthuis et al. [20] observed in 2023 that recipients of short or tall stature are more likely than recipients of normal stature to experience graft failure. In 2018, Kaur et al. [21] determined that recipient overweight or obese status may result in poorer graft survival. It is unclear whether these relationships exist in the present data. Though the failure class comprised recipients with greater height and weight compared to those in the success class, both characteristics exhibited very strong correlations with age. However, the RF classifier attributed greater importance to height and weight than features referencing age, suggesting a need for further investigation.
Turning our attention to features that have received less recognition, one of the most important features identified by Spearman's correlation was the proximity of the least recent serum crossmatch test. The variable's negative Spearman's correlation indicates that shorter durations between first crossmatch test and transplant correlate with favorable outcomes. The importance of this variable may reflect the significance of recipient sensitization and socioeconomic barriers to long-term transplant outcomes. Due to the nature of the data, the least recent serum crossmatch may have involved an incompatible donor; in this case, the transplant team would not have proceeded with the transplantation. Thus, an extended duration may suggest sensitization of the recipient. Furthermore, in 2015, Freeman and Myaskovsky [22] found that racial minorities are more likely to experience delayed initiation of care (e.g., late referral to specialty care, delayed dialysis). A 2003 analysis conducted by Furth et al. revealed that physicians are less inclined to recommend transplantation for pediatric patients with questionable medication adherence or lower level of parental education, and a study conducted in 2000 by Van Ryn and Burke demonstrated that physicians tend to perceive African American and low-socioeconomic status patients as being at higher risk for medication non-adherence [23, 24]. In 2012, Myaskovsky et al. [25] conducted a study affirming the association between African American race and an extended duration for transplant acceptance. The study also noted a substantial delay in African American patients' completion of medical workup before receiving approval for kidney transplantation in comparison with white counterparts. Pre-transplant barriers such as these may affect the earliest date of serum crossmatch testing, and consequently, the likelihood of chronic rejection.
However, this finding has limited clinical applications, likely serving as an indicator of sensitization and barriers to transplantation, as the duration between least recent crossmatch test and transplant cannot easily be controlled to optimize graft outcomes. Additionally, interpreting the importance of this variable is challenging due to the limited information it offers about the patient: a longer duration between the first crossmatch test and transplantation may characterize a patient who had a preemptive transplant but took considerable time to find a compatible donor. Similarly, a shorter duration may characterize a patient on dialysis for years but who did not perform a crossmatch test until closer to transplantation. The proximity of the least recent crossmatch test encapsulates a wide range of possibilities pertaining to patient status. Thus, its relationship with graft survival is unclear.
Despite the well-established relationship between HLA mismatch level and graft survival, the influence of donor-recipient HLA-B, HLA-DR, and HLA-DP mismatch levels on long-term graft survival remains ambiguous. In 2003, HLA-B matching was removed as a priority in the U.S. kidney allocation system to improve racial equity by increasing transplantation rates among non-whites [26]. Ashby et al. found this policy had no adverse effect on graft survival, even improving 2-year graft survival for all racial and ethnic groups. In 2018, Shi et al. [19] observed that HLA-B mismatches had an insignificant impact on graft survival. Conversely, a 2014 study by Kosmoliaptsis et al. [27] found HLA-A, HLA-B, HLA-DR, and HLA-DQ mismatches contribute to recipient allosensitization to a similar degree. While HLA-DR-matching was not among the 19 variables identified in this study, a 2017 analysis by Shi et al. [28] evaluated 18 studies and found that recipients with 2-HLA-DR mismatches are at significantly greater risk of 1-, 3-, 5-, and 10-year graft failure. However, a 2008 study by Gritsch et al. [29] noted that 0-DR-mismatched pediatric kidneys had statistically similar 5-year graft survival rate compared to 1- and 2-DR-mismatched kidneys, and it concluded there is no apparent graft survival advantage to HLA-DR-matching. Additionally, HLA-DP-matching is among the 19 variables identified, yet is rarely mentioned in literature. A study in 2016 acknowledges the sparse attention given to HLA loci other than HLA-A, -B, or -DR, but cites several other studies wherein graft failure and antibody-mediated rejection occurred due to DP-mismatching or antibodies to donor DP [30]. The authors include HLA-DP in their list of recommended loci for donor-recipient typing and antibody testing. These conflicting findings emphasize the nuanced nature of HLA matching.
This study corroborates the influence of various features on chronic rejection-caused graft failure, reintroduces features that are contentious regarding their impact on long-term graft survival, and identifies factors that may be influenced by healthcare disparities. Regarding clinical applications, this study's findings support the long-term graft survival benefits of living donor transplantation, younger recipient age, and minimizing HLA mismatches, duration of dialysis, and cold ischemia time. The significance of the proximity of the least recent serum crossmatch date to transplantation suggests a link between recipient sensitization (and other barriers) and graft outcome, though the clinical applications of this finding remain unclear.
4.1 Study Limitations
Limitations of this study relate to the nature of retrospective database analysis. The STAR file lacked detailed information, such as test results and characteristics beyond demographics. Included variables may suffer from confounding effects or discrepancies in data collection. Importantly, the “chronic rejection” designation—delineated via a “chronic rejection” key—may not be supported by pathology for all cases labeled “chronic rejection.” The variables for height and weight described absolute values rather than percentiles by age; consequently, it is difficult to determine, for example, whether being tall or overweight for their age is advantageous for a recipient.
5 Conclusions
This study validates risk factors for chronic rejection-caused graft failure in pediatric kidney transplant recipients 15 years post-transplant, such as prolonged cold ischemia time, deceased donor type, HLA mismatches, older recipient age, Black race, and introduces factors that have received less recognition. The proximity of the least recent serum crossmatch date to transplantation emerges as significant, potentially reflecting recipient sensitization and socioeconomic disparities in healthcare. The association between HLA-B and HLA-DP mismatch levels and long-term graft survival remains contentious. Further research is needed to elucidate the relationships between these variables and chronic rejection-caused graft failure in pediatric kidney transplants.
Acknowledgments
I would like to thank Dr. Nancy Rodig and Dr. David Briscoe from the Boston Children's Hospital for their insightful comments and feedback on the manuscript.
Open Research
Data Availability Statement
The data that support the findings of this study are openly available in OPTN Standard Transplant Analysis and Research (STAR) File at https://optn.transplant.hrsa.gov/data/view-data-reports/request-data/.


