Comparison of cystatin C-based estimated glomerular filtration rate with measured glomerular filtration rate in a pediatric cohort of patients with chronic kidney disease
Abstract
Background
It is essential to have an accurate assessment of the renal function of patients with chronic kidney disease to monitor, treat, and predict further development of the condition. Measurement of renal function in terms of glomerular filtration rate (GFR) requires either urine or blood sampling, but especially in children, more simple methods of measurement are preferable. The main objective of this study was to examine if the estimated GFR (eGFR) calculated with different cystatin-C-based equations was comparable to the GFR measured by a radiotracer (mGFR) in pediatric patients.
Methods
In this retrospective study, 28 pediatric patients contributed with 73 pairs of measurements collected within 5 years. Bland–Altman Limits of Agreement were used to evaluate the performance and accuracy of two different cystatin-C-based estimates, the CKiDCrea-CysC and the CKiDU25 respectively, compared to an mGFR based on plasma clearance of technetium-99m-diethylenetriaminepentaacetic acid or chromium-51-ethylenediaminetetraacetic acid.
Results
Using the CKiDCrea-CysC equation, 58.9% of the datasets were within P10 and 87.7% were within P30. The mean difference was 4.8 mL/min/1.73m2 (standard deviation: 8.5 mL/min/1.73m2) and tended to overestimate GFR and thereby overrate the kidney function within the entire GFR range. Using the CKiDU25 equation, 53.4% were within P10 and 93.2% within P30. The mean difference was −2.9 mL/min/1.73m2 (standard deviation: 8.4 mL/min/1.73m2), but the difference varied with the GFR value.
Conclusions
A cystatin-C-based eGFR provides a viable substitute for monitoring renal function in pediatric patients with chronic kidney disease. However, it has a lower accuracy than mGFR and can therefore not replace mGFR in clinical use.
Abbreviations
-
- 51Cr-EDTA
-
- chromium-51-ethylenediaminetetraacetic acid
-
- 99mTc-DTPA
-
- technetium-99m-diethylenetriaminepentaacetic acid
-
- CKD
-
- chronic kidney disease
-
- CKiD
-
- chronic kidney disease in children study
-
- crea
-
- creatinine
-
- CysC
-
- cystatin C
-
- eGFR
-
- estimated glomerular filtration rate
-
- GFR
-
- glomerular filtration rate
-
- KDIGO
-
- kidney disease improving global outcomes
-
- mGFR
-
- measured glomerular filtration rate
1 INTRODUCTION
Accurate assessment of kidney function in pediatric patients with kidney failure is most important in dose adjustment of medicine, the planning of kidney transplantation, or the start-up of dialysis.1 After kidney transplantation in a pediatric patient, the child's condition is carefully monitored with frequent blood samples, and at most centers, the kidney function is measured every year. Glomerular filtration rate (GFR) is a criterion for staging kidney function in adult and pediatric patients, and chronic kidney disease (CKD) is classified based on GFR.2
It is not possible to measure GFR directly, however, estimated GFR (eGFR) can be obtained by computations based on endogenous substances, and measurements of urinary or plasma clearance of exogenous markers can provide surrogate measurements of GFR.3 When using plasma levels of filtration markers to estimate GFR, it is required that the marker is not bound to any proteins, filtered freely in the glomeruli, and neither secreted, metabolized, or reabsorbed by the renal tubular cells.4
P-creatinine is the most frequently used endogenous indicator of kidney function, however, the P-creatinine level in the blood is influenced by muscle mass and body composition.5 A child will naturally increase their height and weight, which will lead to rising P-creatinine values due to an increase in the total mass of muscle. Hence, increasing P-creatinine does not necessarily signify decreasing kidney function, which is why an eGFR based solely on P-creatinine as a filtration marker is not optimal in pediatric patients. Several equations developed to estimate GFR in pediatric patients rely on data from the CKiD prospective cohort study,6 and many new equations based on the same material have been developed over the last few years. A combination of P-creatinine and P-cystatin C as endogenous substances has been shown to give a significantly more accurate estimate of GFR than equations only relating to one of them.7, 8
Cystatin C is a protein that regulates the activity of cysteine proteinases and is produced in almost all nucleated cells. It has a constant rate of production and is metabolized and reabsorbed completely in the renal tubular cells, which enables it to be a credible substance to use in an eGFR equation.9, 10
In addition to the bare measurement of P-creatinine levels, the urinary excretion of P-creatinine can be calculated and related to the blood level, which makes the evaluation less susceptible to the abovementioned factors and gives a more accurate picture of the renal handling of the substance. This method, however, requires the meticulous collection of 24 h of urine, which makes it less suitable for pediatric patients due to the advanced requirement of compliance.11
A way to measure the GFR indirectly is to calculate the plasma clearance of an intravenously administered pharmaceutical that is excreted primarily by glomerular filtration. Different exogenous markers have been applied, all with different pros and cons. In our country, the two most commonly used radioactive pharmaceuticals are technetium-99m-diethylenetriaminepentaacetic acid (99mTc-DTPA) and chromium-51-ethylenediaminetetraacetic acid (51Cr-EDTA). This method gives quite accurate GFR values but requires the establishment of an intravenous line and multiple blood samples, which is an extensive procedure in time and the handling of the patients. If it were possible to avoid a complex and invasive test on patients, especially on severely chronic sick children, it would be preferable.
The main objective of this study was to examine whether eGFR from one of two cystatin C-based equations, respectively the CKiDCrea-CysC equation and the CKiDU25 equation, was comparable to the GFR by plasma clearance of 99mTc-DTPA or 51Cr-EDTA (here termed measured GFR, (mGFR)) within a pediatric population of patients with chronic kidney disease before and after kidney transplantation. For comparison, we also tested the original CKiDCrea equation.
2 MATERIALS AND METHODS
2.1 Patients
This retrospective quality assurance project included data from 23rd January 2018 to 23rd January 2023 on pediatric patients at Odense University Hospital, a renal transplantcenter for pediatric patients in the western part of Denmark. All patients were identified from the outpatient clinic. The inclusion criteria were age below 19 years, CKD, and/or kidney transplant requiring monitoring of kidney function. The collected data were retrieved from the patients' health journals and included only already accessible data. In this period, all patients had an mGFR in terms of plasma clearance of the radiotracer, available information on contemporary P-cystatin C, gender, height, weight, P-creatinine, P-carbamide, and underlying disease to create a full dataset.
The study conformed to the Declaration of Helsinki. It was approved by The Danish Data Protection Agency. As a quality assurance project, no approval by the ethics committee was required, and due to the retrospective nature, informed consent from the patients was not needed.
2.2 Measured GFR
The mGFR was determined by a nuclear medicine multi-sample examination at Odense University Hospital. The test included an intravenous injection of the radiotracer (3.7 MBq 51Cr-EDTA, GE Healthcare, or 8 MBq 99mTc-DTPA, Mallinckrodt Pharmaceuticals) followed by blood sampling at minutes 120, 150, and 240.12 Blood samples and spill samples were analyzed in duplicate on a gamma counter (2470 Wallac Wizard 2TM, Perkin Elmer) with an energy window 121–159 keV. Standard GFR (mL/min/1.73m2) was calculated according to the formula by Brøchner-Mortensen & Jødal,13, 14 body surface area (m2) was calculated from the Haycock formula: BSA(m2) = 0.024265 · W0.5378(kg) · H0.3964(cm).15
2.3 Estimated GFR
CKiDCrea-CysC, CKiDU25, and CKiDCrea were calculated according to the formulas shown in Table 1.
| Equation | Formula |
|---|---|
| CKiDCrea-CysC |
Male: 39.1 · (height/P-creatinine · 0.0113)0.516 · (1.8/P-CystatinC)0.294 · (10.7/P-Carbamid)0,169 · (height/1.4)0.188 · 1.099 Female: 39.1 · (height/P-creatinine · 0.0113)0.516 · (1.8/P-CystatinC)0.294 · (10.7/P-Carbamide)0.169 · (height/1.4)0.188 |
| CKiDU25 |
eGFR as the average (mean) of the eGFR from serum creatinine level and serum cystatin C level: K · (height/creatinine) K · (1/CystatinC) K-values: Male: K = 0.390 · 1.008(age-12) for 1 < age < 12 K = 0.390 · 1.045(age-12) for 12 < age < 18 K = 0.508 for 18 < age < 25 Female: K = 0.361 · 1.008(age-12) for 1 < age < 12 K = 0.361 · 1.023(age-12) for 12 < age < 18 K = 0.414 for 18 < age < 25 |
| CKiDCrea | 36.52 · (height(cm)/P-enzymatic creatinine) |
Cystatin C values were analyzed on a Cobas 8000 module c702 (Roche). The principle of the method was particle-enhanced immunoturbidimetry, where human cystatin C agglutinates with latex particles coated with anti-cystatin C-antibodies. The aggregate was determined turbidimetric at 546 nm. The analysis method was standardized to reference material ERM-DA471/IFCC. The total imprecision was determined at two levels: 0.87 mg/L, CV% = 2.28% and 2.82 mg/L, CV% = 1.39% and the lower limit of quantification was 0.40 mg/L. All P-creatinine was measured enzymatically at Odense University Hospital and were all IDMS traceable. The total imprecision was CV% <2. The lower limit of detection was 5 μmol/L. P-creatinine and P-carbamide values obtained within 1 week from the mGFR were accepted. The height of the patient was accepted up to 3 months apart from the mGFR if there was a following height measurement that showed that the height was stable. Regarding the P-cystatin C values, a time gap of 3 months was also accepted as long as several stable P-creatinine values were available to indicate a steady state in P-creatinine as well as in P-cystatin C. We also monitored if the patients' height and weight were stable during the gap time. In the majority of the datasets (68 out of 73), P-cystatin was analyzed within less than 14 days compared to mGFR.
2.4 Statistical analysis
Descriptive statistics comprise mean ± standard deviation (SD) for continuous and roughly normally distributed variables (as judged by histograms with approximating normal distributions), median (minimum-maximum) for continuous, non-normally distributed variables, and frequencies with respective percentages for categorical variables. Bland–Altman analyses were used to assess the performance of both eGFR equations compared to mGFR.16 We regressed the differences on the mean values and detected a negative slope over the measurement range, suggesting a non-constant bias; therefore, we applied a regression approach for non-uniform differences to derive the Bland–Altman Limits of Agreement.17-19 Relative differences between the eGFR and mGFR were described with P10 and P30, which show the percentage of eGFR values that differ by <10% or <30% from the corresponding mGFR. All analyses were done with STATA/MP 17.0 (StataCorp, College Station, Texas 77 845 USA).
3 RESULTS
3.1 Description of patients
A total of 35 patients were assessed for eligibility. Twenty-eight patients were included in a total of 73 datasets because several of the patients had more than one dataset available in the course of our 5-year period. A dataset consisted of an mGFR and two corresponding eGFR values calculated from the retrieved patient data. Nine patients contributed with one dataset each. Six patients had two datasets. Three patients had three datasets. Seven patients had four datasets and three patients had five comparable datasets available. Seven patients (#6, 11, 15, 16, 18, 22, 29) were not included, as the needed data were not available. The included patients were children and adolescents 3.5–18.5 years of age. All patients had CKD, and the majority had a renal transplant. The CKD was due to several known diseases, e.g., congenital renal hypo-dysplasia, posterior urethral valves, and ANCA-associated vasculitis. The datasets were subdivided into GFR categories based on mGFR.2 Two measurements in one patient showed normal kidney function. Approximately one-third showed mildly decreased kidney function. Just over 50% were in the category of moderately decreased kidney function. Five patient datasets showed severely decreased kidney function, and two patient datasets revealed definitive kidney failure. Patient characteristics are presented in Table 2.
| Number | |
| Patients | 28 |
| Datasets | 73 |
| Gender | n (%) |
| Female | 10 (35.7%) |
| Male | 18 (64.3%) |
| Age (years) | |
| Median (range) | 14.0 (3.5–18.5) |
| <6 (%) | 3 (4.1%) |
| 6–12 (%) | 23 (31.5%) |
| >12 (%) | 47 (64.4%) |
| mGFR (ml/min/1.73 m2) | |
| Mean ± SD | 56.6 ± 17.9 |
| >90 (%) | 2 (2.8%) |
| 60–90 (%) | 25 (34.2%) |
| 30–60 (%) | 39 (53.4%) |
| 15–30 (%) | 5 (6.8%) |
| <15 (%) | 2 (2.8%) |
| Underlying disease | |
| CAKUTa | 11 (39.3%) |
| Geneticb | 9 (32.1%) |
| Glomerulonephritisc | 5 (17.9%) |
| Otherd | 2 (7.1%) |
| Unknown | 1 (3.6%) |
| Type of chronic kidney disease | |
| Kidney transplant | 24 (85.8%) |
| Pretransplant | 4 (14.3%) |
- a CAKUT—Congenital anomalies of the kidney and urinary tract.
- b Genetic—Juvenile nephronophthisis, Autosomal recessive polycystic kidney, Mitochondria disease, Alport disease, Schminkes immune-osseous dysplasia.
- c Glomerulonephritis—IgA nephritis, Henoch Schönlein, focal segmental glomerular sclerosis.
- d Other—Perinatal asphyxia, leukemia + bone marrow transplantation.
3.2 Agreement analysis
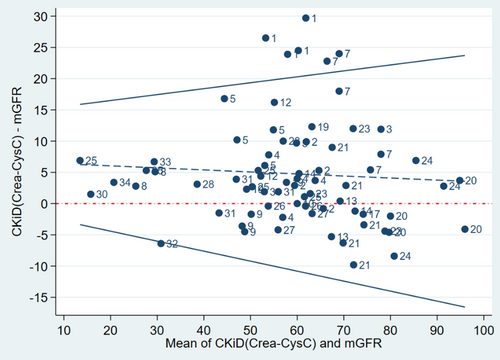
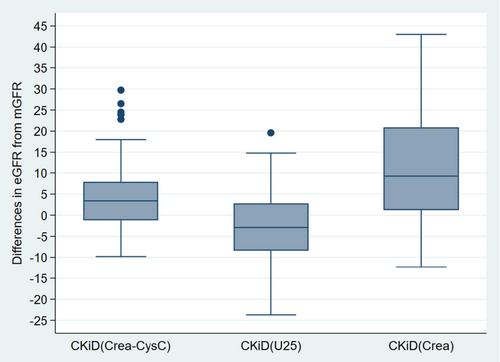
The mGFR mean ± SD was 56.6 ± 17.9 mL/min/1.73m2. The CKiDCrea-CysC estimate was 61.1 ± 17.4 mL/min/1.73m2. Of all the paired observations, 58.9% of the estimates were within P10 and 87.7% within P30 of the mGFR results. The mean difference ± SD was 4.8 ± 8.5 mL/min/1.73m2 with the mean value being positive over the whole GFR spectrum (Figure 1). Figure S1 shows a scatterplot of CKiDCrea-CysC and mGFR values.
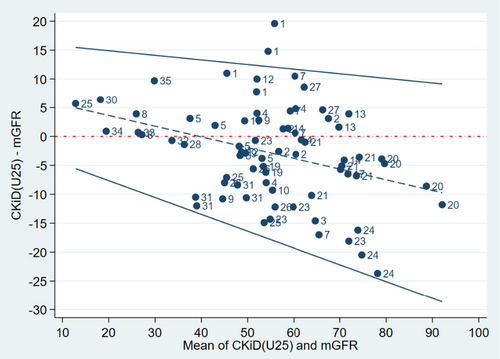
The CKiDU25 estimate resulted in an eGFR of 53.7 ± 15.0 mL/min/1.73m2; 53.4% of the observations were within P10 and 93.2% within P30 of the mGFR values. The mean difference ± SD was −2.9 ± 8.4 mL/min/1.73m2 and varied with the GFR so that GFR was overestimated when mGFR was lower than approximately 40 mL/min/1.73m2, and underestimated when mGFR was higher than that (Figure 2). Figure S1 shows a scatterplot of CKiDCrea-CysC and mGFR values.
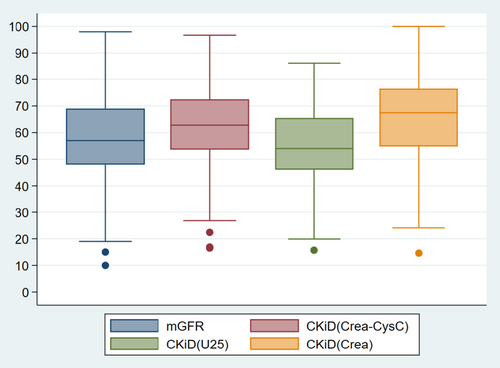
The original CKiDCrea equation resulted in an eGFR of 64.0 ± 18.8 mL/min/1.73m2. CKiDCrea overestimated GFR significantly, with a mean difference ± SD of 11.1 ± 12.3 mL/min/1.73m2. P10 and P30 were assessed as 24.7% and 54.8%, respectively (Table 3, Figures 3 and 4).
| Equation | Mean ± SD | Median (min–max) | Mean difference ± SD | P10 (%) | P30 (%) |
|---|---|---|---|---|---|
| CKiDCrea-CysC | 61.4 ± 17.4 | 62.8 (16.5–96.7) | 4.8 ± 8.5 | 58.9 | 87.7 |
| CKiDU25 | 53.7 ± 15.0 | 54.0 (15.7–86.2) | −2.9 ± 8.4 | 53.4 | 93.2 |
| CKiDCreaa | 64.0 ± 18.8 | 67.5 (14.6–100) | 11.1 ± 12.3 | 24.7 | 54.8 |
- a CKiDCrea is only validated for use when the estimated GFR is between 15 and 73 mL/min; therefore, only 62 datasets were available for this equation.
In Figures 1 and 2, datasets belonging to the same patient can be identified, allowing for evaluation of the difference between eGFR and mGFR at different time points. It shows that for some of the datasets of patient #1, the difference between eGFR based on CKiDU25 and mGFR exceeded the 95% limit of agreement (Figure 2). With CKiDCrea-CysC this was the case for all of the datasets of patient #1 and some of the datasets of patient #7 (Figure 1). There seemed to be a tendency towards intraindividual differences being at the same level in the majority of the patients.
4 DISCUSSION
4.1 Summary of main findings
This study examined how eGFR based on two cystatin C equations performed in comparison to mGFR. In the Region of Southern Denmark, the CKiDCrea-CysC equation20, 21 is the standard used to estimate GFR in pediatric patients. To consider age, we also estimated GFR using CKiDU25. Furthermore, we compared mGFR with the original CKiDCrea equation.
Regarding P10 and P30 values, the two GFR estimates were comparable. The CKiDCrea-CysC tended to overestimate GFR and therefore overrate the kidney function within all the GFR ranges. The CKiDU25 tended to overestimate GFR in patients with very low kidney function but underestimated GFR in patients with higher GFR.
4.2 Comparison
The findings in this study are similar to others. The P10 and P30 values found were marginally more accurate than previously proven.22, 23 For instance, Edward J. Nehus et al. found a P30 of 86.2% and a P10 of 43.7% using the CKiDCrea-CysC equation.24 George J. Schwartz found similar results using the CKiDU25 with a P30 of 89.4% and a P10 of 47.1.25
Studies show an association between higher values of P-cystatin C and obesity-related conditions such as type-2 diabetes mellitus (DM2) and metabolic syndrome. The thesis is that adipocytes might increase the secretion of cystatin C as a response to the expansion of the adipose tissue. In this study, none of the patients were diagnosed with DM2 or metabolic syndrome, which eliminates the risk of this association causing an unbalanced bias. Other non-GFR factors that might affect a cystatin C-based eGFR are inflammation, smoking, hypo- and hyperthyroidism, overhydration, and acute kidney injury (AKI). Therefore, the clinical use of a cystatin C-based eGFR should be reconsidered or at least not stand alone in these patient groups.4, 26
Previously, it has been proven in several studies, that the Schwartz CKiDCrea equation tends to overestimate GFR and therefore kidney function.27, 28 In the Foundation for the National Institutes of Health-sponsored CKiD study, the CKiDCrea equation overestimated GFR by 12 mL/min/1.73m2.1 Our study showed a mean difference of 11.1 mL/min/1.73m2 from the mGFR which correlated very well with previous results.
4.3 Strengths and limitations
Our gold standard is not precise in itself. The mGFR by radiotracer has an uncertainty of up to 13% although less with the multi-sample versus the single-sample method.14, 19 It is, however, used in daily practice. We only processed two different contemporary GFR estimates, since we chose to focus on the one most used in clinical practice in Denmark, which is CKiDCrea-CysC. Additionally, we examined the CKiDU25 to investigate whether it would be a more accurate estimate because it took age into account.21, 29
The rarity of CKD in children is the reason for the small number of patients included. Apart from one dataset, we only included patients with reduced kidney function, and we cannot tell from our results, how the equations perform in patients with normal kidney function. One further limitation was that this study primarily included patients of Caucasian ethnicity, however, a previous study showed that a CKiD estimate that does not consider race had the best overall performance, but also highlighted that further research was needed to conclude the rejection of race-corrected equations.30
Because several patients had several datasets, it allowed the monitoring of the consistency of eGFR versus the mGFR within an individual, in contrast to other similar studies, which often only included one dataset per patient.24
Filler G addresses an important issue regarding mGFR indexed to BSA. The standard is to use the actual weight, but if the ideal weight is better, it needs to be clarified. The concern is that overweight overestimate mGFR and underweight overestimate mGFR. In our study, the majority of patients had an ideal weight within ± 2 SD.31
During the time of the study, the radiotracer was changed from 51Cr-EDTA to 99mTc-DTPA. However, several studies found that the two clearance methods correlated well (r = .996).32 A recent study concluded that no clinically relevant differences were found between the 99mTc-DTPA and 51Cr-EDTA plasma clearances, and that 99mTc-DTPA can replace 51CrEDTA.33
4.4 Perspectives
It was clear that the eGFR was not a perfect substitute for mGFR. However, given that intraindividual differences tended to be in the same order of magnitude over time, estimation of GFR might be a possible means of monitoring the kidney function if there is a combined mGFR and eGFR at the baseline. The results clearly showed that GFR estimates were considerably more inaccurate for patients #1 and #7. Patient #1 suffered from syndromes that cause low muscle mass with a possible impact on P-creatinine, thereby affecting the eGFR. Patient #7, on the contrary, had no obvious reason for the eGFR to be so inaccurate. This example causes doubt about the use of eGFR. Therefore, a baseline mGFR should at least be available, and if the eGFR differentiates significantly, eGFR would supposedly be discouraged as a valid estimate of GFR and kidney function.
5 CONCLUSION
This study showed that the equations used to estimate GFR give a good estimation of the GFR in most of our patients. Overall, the CKiDU25 performed best according to the mean difference and regarding the P30 value. However, the CKiDCrea-CysC equation performed best regarding the P10 value and was more consistent over the GFR values. Therefore, it is open which estimate to prefer in clinical use. However, a concerning tendency was that both formulas performed differently within the low versus high GFR range. The results showed that the intraindividual variety in the eGFR was often small. eGFR can probably be used to monitor the progress of CKD if there is a baseline mGFR to compare with. Further research about the intraindividual consistency of eGFR is needed, and it would not be recommended from this study to replace mGFR with eGFR at this point.
ACKNOWLEDGMENTS
We wish to thank Associate Professor Mette Neland from the Department of Pediatrics at Odense University Hospital for her valuable contribution to the conceptualization of this study. The skilled technical assistance from the staff is highly appreciated. Also, thanks to the patients and their families.
Open Research
DATA AVAILABILITY STATEMENT
Data can be obtained from the authors by request.


