Pancreatic beta-cell function dynamics in youth with GCK, HNF1A, and KCNJ11 genes mutations during mixed meal tolerance test
Funding information: Federal Department of Foreign Affairs of Switzerland; Lithuanian Research Council Lithuanian-Swiss program “Research and development”, Grant/Award Number: CH-3-ŠMM-01/09; Swiss National Science Foundation, Grant/Award Numbers: CR33I3_140655, CR33I3_1166591
Abstract
Objective
The aims were (1) to assess beta-cell function in GCK diabetes patients over 2-year period; (2) to evaluate the dynamics of beta-cell function in HNF1A and KCNJ11 patients after treatment optimization; using mixed meal tolerance test (MMTT) as a gold standard for non-invasive beta-cell function assessment.
Research Design and Methods
Twenty-two GCK diabetes patients, 22 healthy subjects, 4 patients with HNF1A and 2 with KCNJ11 were recruited. Firstly, beta-cell function was compared between GCK patients versus controls; the dynamics of beta-cell function were assessed in GCK patients with two MMTTs in 2-year period. Secondly, the change of beta-cell function was evaluated in HNF1A and KCNJ11 patients after successful treatment optimization in 2-year period.
Results
GCK diabetes patients had lower area under the curve (AUC) of C-peptide (CP), average CP and peak CP compared to controls. Also, higher levels of fasting, average, peak and AUC of glycemia during MMTT were found in GCK patients compared to healthy controls. No significant changes in either CP or glycemia dynamics were observed in GCK diabetes group comparing 1st and 2nd MMTTs. Patients with HNF1A and KCNJ11 diabetes had significantly improved diabetes control 2 years after the treatment was optimized (HbA1c 7.1% vs. 5.9% [54 mmol/mol vs. 41 mmol/mol], respectively, p = 0.028). Higher peak CP and lower HbA1c were found during 2nd MMTT in patients with targeted treatment compared to the 1st MMTT before the treatment change.
Conclusion
In short-term perspective, GCK diabetes group revealed no deterioration of beta-cell function. Individualized treatment in monogenic diabetes showed improved beta-cell function.
1 INTRODUCTION
Monogenic diabetes (MD) is a very heterogenous group of disorders from relatively benign hyperglycaemia caused by mutations in glucokinase (GCK) gene to syndromic diabetes with severe clinical presentation.1-3 The most common types of MD are subtypes of maturity onset diabetes of the young (MODY) that results of pathogenic variants in the genes encoding transcription factors HNF1A, HNF4A, and HNF1B. Even this relatively small group of disorders can manifest in different phenotypes.1, 4 The precise molecular diagnosis could lead to targeted individualized treatment, well demonstrated in patients with neonatal KCNJ11 diabetes successfully treated with high-dose sulfonylureas.5
Improved HbA1c and quality of life after successful switch from multiple daily insulin injections to oral agents in MD patients are well described by various authors.6-8 However, there is a lack of specific data on the dynamics of their pancreatic beta-cell function after the change of treatment. Moreover, GCK diabetes is usually described as stable hyperglycaemia requiring no specific treatment without substantial deterioration,9, 10 but little evidence exists about the dynamics of actual beta-cell function in these patients.
The aims of this study were to evaluate pancreatic beta-cell function in patients with GCK diabetes within 2-year period and to assess the change of beta-cell function after treatment optimization in patients with HNF1A and KCNJ11 diabetes. To accomplish these goals, we applied the mixed meal tolerance test (MMTT) as a gold standard for non-invasive assessment of pancreatic beta-cell function.
2 RESEARCH DESIGN AND METHODS
2.1 Design and study cohort
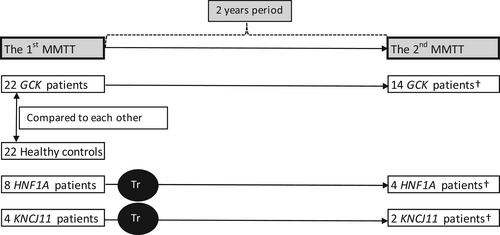
This study enrolled 22 patients with diagnosis of GCK diabetes, and their beta-cell function was compared with that of 22 healthy controls. About 63.6% (n = 14) of GCK patients agreed to undergo a second MMTT 2 years after the first one, for the evaluation of dynamics of beta-cell function.
Two MMTTs were also performed in HNF1A (n = 4) and KCNJ11 (n = 2) diabetes patients before and 2 years after successful treatment optimization (switch to oral sulfonylurea agents).
Detailed research design is presented in Figure 1. This particular study group is a part of binational Lithuanian-Swiss project “Genetic Diabetes in Lithuania”. The entire cohort (n = 1209) was represented previously.11, 12 In general, the cohort comprised of young (under the age of 25) diabetes patients. At the 1st step, 153 patients were selected for genetic analysis, after exclusion of the diagnosis of autoimmune type 1 diabetes. Forty-one patients (22 GCK, 8 HNF1A, 3 HNF4A, 4 KCNJ11, 2 ABBC8, 1 INS, and 1 KLF11) were confirmed with a diagnosis of genetic diabetes due to a pathogenic variant in one of known MD genes, they were in depth described previously.11

The control group consisted of healthy volunteers with no documented chronic disease. Volunteers were young adults aged 18–25 years (median age 21.75 years), as well as participants in the entire cohort; for bioethical reasons, subjects under the age of 18 were not included in the study as volunteers.
2.2 Mixed meal tolerance test
MMTT was performed after a night of fasting, between 7 and 10 AM. Patients with diabetes were admitted to the in-patient Department of Endocrinology to ensure optimal glycemia (3.9–11.1 mmol/L) before the investigation, and healthy controls underwent the MMTT in the out-patient clinic. Fasting glycemia was tested before the MMTT and it did not exceed 5.6 mmol/L in any of the healthy subjects.
The portion of standard liquid meal (1 kcal/ml) was calculated based on participants' weight 6 ml/kg (maximum 360 ml). Commercially available drink BOOST® (Mead-Johnson) was used for this test. Blood samples for CP levels and glycemia were taken at nine time points: 10 min prior to the meal (t−10), at the mealtime (t0), and at 15 (t15), 30 (t30), 60 (t60), 90 (t90), 120 (t120), 150 (t150), and 180 min (t180) after the meal. The full MMTT protocol was described previously.12
2.3 Laboratory assays
Detailed methods for measuring C-peptide (CP) and plasma glucose levels have been described previously.12 Briefly, CP levels were measured by immunoradiometric assay (IRMA), and glycemia levels were measured using the oxygen coefficient method.
2.4 Analysis of pancreatic beta-cell function dynamics
Kinetic indices of CP: area under the curve of CP (AUCCP), fasting baseline CP (CPBase), peak CP level (CPmax), average CP concentration (CPAve), and glycemia dynamics during MMTT were evaluated in all subjects.
The parameters were compared between the GCK diabetes group and the control group. The dynamics of beta-cell function were assessed in 14 GCK diabetes patients, who agreed to undergo both MMTTs over a 2-years break.
A treatment optimization trial was performed for all patients with HNF1A (n = 8), HNF4A (n = 3), KCNJ11 (n = 4), and ABCC8 (n = 2) after the first MMTT across the entire project cohort. Six patients with HNF1A and three patients with KCNJ11 were successfully switched from insulin injections to oral sulfonylureas, described previously.12 Of these, four patients with HNF1A and two with KCNJ11 diabetes agreed to undergo a second MMTT and were included in this analysis. None of the patients from “unsuccessful” switch agreed to undergo the 2nd MMTT.
2.5 Statistical analysis
Statistical analysis was performed using SPSS software version 23.0. The median with lowest and the highest values in parentheses are used to represent the data, unless stated otherwise. The Mann–Whitney U test was used to compare GCK diabetes and control groups, and the Wilcoxon Signed Rank test was used to compare dynamics of beta-cell function during both MMTTs in the same MD group. A p-value <0.05 was considered statistically significant, all tests were two-tailed, unless stated otherwise.
2.6 Bioethics
The research project received regional and national ethical approvals (No. BE-2-5). All patients were included in the study after they and/or their parents or official guardians gave an informed consent. The study was conducted in accordance with the Declaration of Helsinki.
3 RESULTS
3.1 General characteristics of GCK patients and control group
All clinical characteristics comparing GCK diabetes group and healthy controls are presented in Table 1. Patients in GCK diabetes group were significantly younger, therefore, all subsequent comparisons between GCK diabetes and control groups were age-adjusted. No specific treatment was given to any of the patients with GCK diabetes. There were no other identified conditions that could influence glucose metabolism in the control group.
| GCK (n = 22) | Controls (n = 22) | p-value | ||
|---|---|---|---|---|
| Females, % (n) | 59.1 (13) | 72.7 (16) | 0.34 | |
| BMI, % (n) | Normal | 77.3 (17) | 86.4 (19) | 0.35 |
| Overweight | 13.6 (3) | 13.6 (3) | ||
| Underweight | 9.1 (2) | 0 | ||
| Age at MMTT, months | 164 (35; 291) | 261 (231; 279) | <0.01 | |
| Duration of diabetes, months | 44 (9; 146) | NA | NA | |
| HbA1c, % | 6.2 (5.4; 6.7) | NA | NA | |
| HbA1c, mmol/mol | 44.3 (35.5; 49.7) | |||
- Note: Data presented as median (min; max), unless stated otherwise.
- Abbreviations: BMI, body mass index; HbA1c, glycosylated hemoglobin; MMTT, mixed meal tolerance test; NA, not appropriate.
3.2 Beta-cell function in GCK patients versus control group
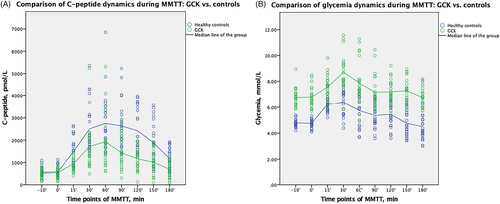
The dynamics of CP and glycemia during MMTT in GCK group versus control group are presented in Figure 2. The Mann–Whitney U test showed significantly lower CP indices in GCK group versus controls, comparing median of AUCCP 246435 versus 343,475 pmol/L/180 min, p < 0.001; CPmax 1963 (162; 913) versus 2935 (1430; 6850) pmol/L, p = 0.012, and CPAve 1102 (352; 2250) versus 1554 (1082; 3202) pmol/L, p = 0.001, and significant differences comparing glycemia indices, all data are provided in Table 2.

| GCK (n = 22) | Controls (n = 22) | p-value* | |
|---|---|---|---|
| AUCCP, pmol/L/180 min | 246,435 (69,615; 470,240) | 343,475 (234,225; 729,925) | <0.001 |
| CPBase, pmol/L | 601 (162; 913) | 510 (190; 1130) | 0.851 |
| CPmax, pmol/L | 1963 (854; 5307) | 2935 (1430; 6850) | 0.012 |
| CPAve, pmol/L | 1102 (352; 2250) | 1554 (1082; 3202) | 0.001 |
| AUCGlycemia, mmol/L/180 min | 1345 (1209; 1718) | 1002 (793; 1375) | <0.001 |
| Fasting glycemia, mmol/L | 6.6 (5.7; 8.5) | 4.7 (4.1; 5.5) | <0.001 |
| Max glycemia, mmol/L | 8.2 (7.6; 11.6) | 6.9 (5.5; 7.7) | <0.001 |
- Note: Data presented as median (min; max).
- Abbreviations: AUC, area under the curve; CP, C-peptide; CPBase, the baseline C-peptide; CPmax, the highest value of C-peptide; CPAve, the average level of C-peptide.
- * Data was age-adjusted.
3.3 Dynamics of beta-cell function in GCK patients
The median age at the 1st MMTT was 164 (35; 219) months, at the 2nd MMTT—187 (58; 245) months in GCK diabetes group (n = 14) with both MMTTs. The median of time interval between MMTTs was 24 (22; 26) months. No difference in HbA1c before the 1st and 2nd MMTTs was found, 6.2% (5.4; 6.7) versus 6.3% (5.6; 6.5), respectively, p = 0.723. The Wilcoxon test revealed that there were no statistically significant changes either in CP or in glycemia kinetics, the data is presented in Supplementary Table 1.
3.4 Dynamics of beta-cell function in MD patients with treatment switch
General characteristics of four HNF1A and two KCNJ11 patients are presented in Table 3, none of the patients were related.
| Affected gene | Subject ID and mutation | Gender | Age at diabetes diagnosis (months) | Age at molecular diabetes diagnosis and 1st MMTT (months) | Treatment at the time of 1st MMTT | Dose (U/kg/d) | Age at 2nd MMTT (months) | Targeted treatment (Dose, mg/d) |
|---|---|---|---|---|---|---|---|---|
| HNF1A | Subject A (c.814C>T (p.Arg272Cys)) | M | 178 | 182 | Insulin | 0.24 | 206 | Gliclazide (60) |
| Subject B (c.347C>T (p.Ala116Val)) | F | 234 | 246 | Insulin | 0.6 | 274 | Gliclazide (60) | |
| Subject C (c.872 dup (Gly292Argfs*25)) | F | 186 | 285 | Insulin | 0.6 | 309 | Gliclazide (30) | |
| Subject D (c.872 dup (Gly292Argfs*25) | M | 210 | 235 | Diet | – | 264 | Gliclazide (30) | |
| KCNJ11 | Subject E (c.149G>A (p.Arg50Gln)) | M | 5 | 183 | Insulin | 1.1 | 211 | Glibenclamide (30) |
| Subject F (c.602G>A (p.Arg201His)) | F | 5 | 288 | Insulin | 1.1 | 305 | Gliclazide (180) |
- Note: Data presented as median (min; max).
- Abbreviations: F, female; M, male; MMTT, mixed meal tolerance test.
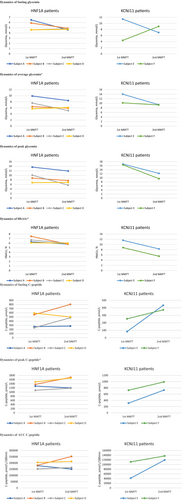
Wilcoxon Signed Rank test for repeated measurements before and after the treatment switch (in 4 HNF1A and 2 KCNJ11 patients) showed that the average glycemia was lower 7.3 mmol/L versus 8.8 mmol/L (p = 0.046), HbA1c was better 5.9% (41 mmol/mol) versus 7.1% (54.1 mmol/mol) (p = 0.028), and CPmax was slightly higher 1193 (729; 1707) versus 1186 (312; 1488) pmol/L, p = 0.046, after successful optimization of treatment. Comparisons of the data from the 1st and 2nd MMTTs for each subject, separately for HNF1A and KCNJ11 patients, are presented in Figure 3 with Spagetti plots.

4 DISCUSSION
This study presents relevant data about pancreatic beta-cell function in patients with GCK diabetes and patients with HNF1A and KCNJ11 diabetes after successful treatment optimization. GCK diabetes is considered to be a distinct type of genetically caused beta-cell disorders, as it presents with stable hyperglycaemia throughout life, the prevalence of vascular complications being similar to general population, and most importantly it does not need any treatment, except specific cases in pregnancy, depending on the fetal status.9, 13-15 However, HNF1A and KCNJ11 manifest with different clinical presentations from biochemical hyperglycaemia to severe diabetic ketoacidosis especially in neonates with KCNJ11 mutations.6, 13 Right molecular diagnosis guides to targeted individualized treatment in these patients, which not only improves the quality of life, but also diabetes control and HbA1c16, 17; however, there is still a gap in evidence about the real dynamics of pancreatic-beta cell function after treatment switch.
MMTT as a gold standard for non-invasive beta-cell function assessment revealed the kinetics of CP and glycemia in GCK patients; it confirmed the common phenotype: mild hyperglycaemia, often reported up to maximum of 8–9 mmol/L, with an increase up to 3 mmol/L after 2-h glucose load.2, 8, 9 However, our study showed not only glycemia dynamics, but also CP dynamics during MMTT which is superior to oral glucose tolerance test as stimulation of insulin secretion is closer to the physiological process of real-life nutrition.10, 18 Our analysis showed significant differences between GCK diabetic patients and healthy subjects, particularly in AUCCP, CPmax, CPAve, fasting, peak, and average glycemia indices. Overall, healthy control group showed better pancreatic beta-cell response during MMTT than GCK patients, suggesting a possible rationale for further follow-up of these patients regardless of the absence of significant glycemic fluctuations and necessity of immediate treatment.
Our study did not demonstrate any significant deterioration of beta-cell function in relatively short period of time in GCK patients. However, cross-sectional study of 99 patients with GCK diabetes in the United Kingdom (UK) showed slight increase in glycemia with age, with a slope of 0.17% per year, although it was concluded by glycemia and HbA1c changes without performing MMTT. We believe that these results differ from ours because of relatively young cohort (median age 13.7 years) in our study versus older UK's cohort with median age of 48.6 years.19 Although HbA1c was slightly higher in their cohort versus ours (6.9% vs. 6.2%, respectively), the fasting glycemia levels were very similar 6.5 mmol/L (7; 7.5) versus 6.6 mmol/L (5.7; 8.5), respectively. These findings prove that stable hyperglycaemia is one of the major characteristics of GCK diabetes throughout the life.
Various authors have presented improved diabetes control in HNF1A and KCNJ11 patients after successful transfer to sulfonylureas,6, 7, 17 this analysis confirms previous findings. Our patients reached HbA1c 5.9% after switch to sulfonylureas versus 7.1% while on insulin injections. HNF1A diabetes is described as progressive beta-cell dysfunction20 and successful treatment switch in KCNJ11 patients mainly depends on mutation and duration of diabetes.17 Some of our patients had long standing diabetes and were treated with multiple insulin injections until molecular diabetes diagnosis and treatment switch, for example, Subject C more than 8 years with HNF1A mutation (c.872 dup (Gly292Argfs*25)), Subject E almost 15 years and Subject F more than 23 years with KCNJ11 neonatal diabetes. Nevertheless, our MMTT analysis in 2 years after treatment switch showed better CPmax, lower average glycemia, decreased glycemia variations and tendencies to have higher fasting CP and average CP, emphasizing the advantages of genetic analysis and targeted treatment plan for these patients.
The main limitation of this study is small sample size, especially in HNF1A and KCNJ11 group. The main strength of the study is the assessment of beta-cell function with MMTT which is considered as the gold standard. However, MMTT procedure requires a lot of time and energy from medical staff and patients determination to perform MMTT more than once. Therefore, we believe that international cooperation would be important to increase the sample size and achieve more reliable results in the future.
To conclude, this study showed that, compared to healthy subjects, patients with GCK diabetes have decreased beta-cell function, with no deterioration in the short-term perspective. Patients with HNF1A and KCNJ11 benefit from treatment switch from multiple insulin injections to targeted treatment with oral sulfonylureas, as shown by improved beta-cell function during MMTT after the change of treatment.
AUTHOR CONTRIBUTIONS
Ingrida Stankute participated in subjects' enrolment, data collection, database creation, carried out statistical analyses and wrote the manuscript, takes responsibility for the integrity of the data and the accuracy of the data analysis. Rimante Dobrovolskiene coordinated pediatric patient's data collection. Evalda Danyte coordinated adult patients' enrolment and data collection. Rasa Steponaviciute performed C-peptide and glycemia lab analysis. Valerie M. Schwitzgebel participated in the conception and design of the study, edited and revised the manuscript. Rasa Verkauskiene participated in the conception, design and coordination of the study, reviewed the manuscript.
FUNDING INFORMATION
The study was supported by a grant from Lithuanian Research Council Lithuanian-Swiss program “Research and development” (CH-3-ŠMM-01/09) and the Federal Department of Foreign Affairs of Switzerland. Swiss National Science Foundation Grant No. CR33I3_140655 and CR33I3_1166591 to Schwitzgebel VM.
CONFLICT OF INTEREST
The authors declare that they have no conflict of interest.
PRIOR PRESENTATION
Abstract “Evaluation of β-cell Function in Young MODY Patients Using a Mixed Meal Tolerance Test” was presented at 58th Annual European Society for Pediatric Endocrinology (ESPE) Meeting: 19–21 September, 2019, Vienna, Austria.
Open Research
DATA AVAILABILITY STATEMENT
The data that support the findings of this study are available on request from the corresponding author. The data are not publicly available due to privacy or ethical restrictions.


