Volume 44, Issue 9 pp. 2811-2837
INVITED REVIEW
Open Access

Evolution of a biochemical model of steady-state photosynthesis

Xinyou Yin

Corresponding Author

Xinyou Yin

Centre for Crop Systems Analysis, Wageningen University & Research, Wageningen, The Netherlands

Correspondence

Xinyou Yin, Centre for Crop Systems Analysis, Wageningen University & Research, P.O. Box 430, 6700 AK Wageningen, The Netherlands.

Email: [email protected]

Search for more papers by this author
Florian A. Busch

Florian A. Busch

School of Biosciences and Birmingham Institute of Forest Research, University of Birmingham, Birmingham, UK

Search for more papers by this author
Paul C. Struik

Paul C. Struik

Centre for Crop Systems Analysis, Wageningen University & Research, Wageningen, The Netherlands

Search for more papers by this author
Thomas D. Sharkey

Thomas D. Sharkey

MSU-DOE Plant Research Laboratory, Plant Resilience Institute, Michigan State University, East Lansing, Michigan, USA

Search for more papers by this author
First published: 19 April 2021
Citations: 15

Abstract

On the occasion of the 40th anniversary of the publication of the landmark model by Farquhar, von Caemmerer & Berry on steady-state C3 photosynthesis (known as the “FvCB model”), we review three major further developments of the model. These include: (1) limitation by triose phosphate utilization, (2) alternative electron transport pathways, and (3) photorespiration-associated nitrogen and C1 metabolisms. We discussed the relation of the third extension with the two other extensions, and some equivalent extensions to model C4 photosynthesis. In addition, the FvCB model has been coupled with CO2-diffusion models. We review how these extensions and integration have broadened the use of the FvCB model in understanding photosynthesis, especially with regard to bioenergetic stoichiometries associated with photosynthetic quantum yields. Based on the new insights, we present caveats in applying the FvCB model. Further research needs are highlighted.

1 INTRODUCTION

The year of writing this paper marks the 40th anniversary of the widely used biochemical model of Farquhar, von Caemmerer, and Berry (1980) on C3 photosynthesis, known as the “FvCB model” (see Table 1 for all acronyms). The model is a mathematical representation of the biochemical processes in the chloroplast related to photosynthetic CO2 uptake of plants. The application of this model has gone far beyond the developers' expectations even 20 years ago (see the reflections by Farquhar, von Caemmerer, & Berry, 2001) and continues to rapidly rise today. It has become one of the most widely used models in plant science and beyond. For understanding leaf physiology, the model has been used to analyse gas exchange (sometimes combined with chlorophyll fluorescence) data (e.g., Long & Bernacchi, 2003; Sharkey, Bernacchi, Farquhar, & Singsaas, 2007; von Caemmerer & Farquhar, 1981; Yin et al., 2009), to understand photosynthetic control of electron transport (e.g., Foyer, Neukermans, Queval, Noctor, & Harbinson, 2012), and to quantify photosynthetic limitations (e.g., Busch & Sage, 2017; Deans, Farquhar, & Busch, 2019). When coupled to models of stomatal control, it contributes to understanding how water is traded for CO2 (Farquhar & Wong, 1984; Leuning, 1990) and how photosynthetic gas-exchange and water-relation traits are coordinated (Deans, Brodribb, Busch, & Farquhar, 2020). The FvCB model forms the basis of our understanding of photosynthetic isotope discrimination (Busch, Holloway-Phillips, Stuart-Williams, & Farquhar, 2020; Farquhar, 1983; Farquhar, O'Leary, & Berry, 1982; Ubierna et al., 2019). It has also been used to scale photosynthetic processes from the chloroplast and leaf level to higher levels (Bagley et al., 2015; Yin & Struik, 2008), and for assessing the impact of genetic engineering for identified photosynthetic targets on canopy productivity (e.g., Zhu, Portis Jr., & Long, 2004) and crop yield (Wu, Hammer, Doherty, von Caemmerer, & Farquhar, 2019; Yin & Struik, 2017a). The model is even used to inform climate models (Pitman, 2003) and describe plant carbon uptake on the global level as a component of Earth System Models (Rogers, Medlyn, & Dukes, 2014; Sellers et al., 1996). Here, we take a historical view of the original FvCB model and subsequently go into details of how this model has been extended since then.

TABLE 1. List of used acronyms
Acronym Definition
BS Bundle sheath
CCM CO2-concentrating mechanism
CET Cyclic electron transport around Photosystem I
CH2-THF 5,10-methylene-tetrahydrofolate
FvCB model The model of Farquhar, von Caemmerer, & Berry (1980)
GDC Glycine decarboxylase
H+ Proton
IAS Intercellular air spaces
LET Linear electron transport (i.e., the noncyclic electron transport for supporting the Calvin–Benson cycle and the photorespiratory cycle)
M Mesophyll
NAD-ME Nicotinamide adenine dinucleotide-malic enzyme
NADP-ME Nicotinamide adenine dinucleotide phosphate-malic enzyme
NDH NAD(P)H dehydrogenase
PEP Phosphoenolpyruvate
PEPc Phosphoenolpyruvate carboxylase
PEP-CK Phosphoenolpyruvate-carboxykinase
3-PGA 3-phosphoglycerate
Pi Phosphate
PPDK Pyruvate phosphate dikinase
PSI Photosystem I
PSII Photosystem II
RuBP Ribulose 1,5-bisphosphate
THF Tetrahydrofolate
TP Triose phosphate
TPU Triose phosphate utilization
The FvCB model represents a simplified view of the then available knowledge of major mechanisms, especially on the finding that O2 is an alternative substrate of Rubisco, leading to photorespiration. The model describes the net rate of CO2-assimilation (A; see Table 2 for definitions of all model symbols) as the difference between carboxylation rate (Vc) and loss through photorespiration (a consequence of the oxygenation rate; Vo) and respiratory activities other than photorespiration, called “day respiration” (Rd). Assuming the photorespiratory pathway is a closed cycle, 0.5 mol CO2 is released when Rubisco catalyses the reaction with one mol O2 (see discussion later) such that A is expressed as:
urn:x-wiley:01407791:media:pce14070:pce14070-math-0001(1)
where ϕ is the oxygenation to carboxylation ratio. Rd has also been called “mitochondrial respiration in the light”, but the term “day respiration” is preferred. This is to remain non-specific about where the respired CO2 comes from, as CO2 released is not necessarily mitochondrial in origin (Tcherkez et al., 2017). The model ignores any possible consumption of chloroplastic NADPH or ATP if Rd does not originate in mitochondria.
TABLE 2. List of model symbols
Symbol Definition Unit
a Fraction of oxaloacetate that is reduced in mesophyll cells to malate moving to drive bundle sheath mitochondrial electron transport to produce ATP
A Rate of CO2 assimilation μmol m−2 s−1
Ac Rate of CO2 assimilation limited by Rubisco activity μmol m−2 s−1
Aj Rate of CO2 assimilation limited by electron transport μmol m−2 s−1
Ap Rate of CO2 assimilation limited by triose phosphate utilization μmol m−2 s−1
Cc CO2 partial pressure at the carboxylating sites of Rubisco μbar
Ci CO2 partial pressure at intercellular-air spaces μbar
Cm CO2 partial pressure at mesophyll cytosol μbar
f Fraction of irradiance absorbed by photosynthetic pigments but unavailable for Calvin–Benson and photorespiratory cycles
F Rate of photorespiratory CO2 release μmol m−2 s−1
fcyc Fraction of Photosystem I electrons that follow cyclic electron transport
fNDH Fraction of cyclic electron transport that follow the NAD(P)H dehydrogenase-dependent pathway
fpseudo Fraction of the Photosystem I electrons that follow the pseudocyclic electron transport
frefix Fraction of respired and photorespired CO2 that is refixed
frefix,cell Fraction of respired and photorespired CO2 that is refixed within mesophyll cells
frefix,ias Fraction of respired and photorespired CO2 that is refixed via the intercellular air spaces
fQ Fraction of electrons at plastoquinone that follow the Q cycle
gbs Bundle-sheath conductance mol m−2 s−1 bar−1
gm Mesophyll conductance (inverse of mesophyll resistance), =1/rm mol m−2 s−1 bar−1
gmo Mesophyll conductance constant, applied to the constant mesophyll conductance mode mol m−2 s−1 bar−1
h Protons required per ATP synthesis (i.e., the H+:ATP ratio) mol mol−1
Iabs Irradiance absorbed by photosynthetic pigments μmol m−2 s−1
J Potential electron transport rate μmol m−2 s−1
J1 Potential electron transport rate through Photosystem I μmol m−2 s−1
J2 Potential electron transport rate through Photosystem II μmol m−2 s−1
Jatp Potential rate of chloroplastic ATP production μmol m−2 s−1
Jmax Light-saturated potential electron transport rate μmol m−2 s−1
J2max Light-saturated potential electron transport rate through Photosystem II μmol m−2 s−1
k Factor allowing for the effect of chloroplast gaps and the cytosol resistance such that the term defines as the fraction of (photo)respiratory CO2 in the inner cytosol (0 ≤  ≤ 1)
KmC Michaelis–Menten constant of Rubisco for CO2 μbar
KmO Michaelis–Menten constant of Rubisco for O2 mbar
Kp Michaelis–Menten constant of PEPc for CO2 μbar
L Rate of CO2 leakage from bundle-sheath to mesophyll cells μmol m−2 s−1
m Parameter lumping several mesophyll properties, = (1 − λk)rch/rm with 0 ≤ m ≤ 1
n ATP produced per NADH oxidation mol mol−1
Oc O2 partial pressure at the active sites of Rubisco mbar
Om O2 partial pressure at mesophyll cytosol mbar
rch Chloroplast envelope and stroma resistance mol−1 m2 s bar
rcx Carboxylation resistance mol−1 m2 s bar
rm Mesophyll resistance, =rwp + rch mol−1 m2 s bar
rsc Stomatal resistance to CO2 transfer mol−1 m2 s bar
rwp Cell-wall and plasma-membrane resistance mol−1 m2 s bar
Sc/o Relative CO2/O2 specificity of Rubisco mbar μbar−1
Tp Rate of triose phosphate utilization μmol m−2 s−1
uoc Coefficient that lumps diffusivities of O2 and CO2 in water and their respective Henry constants, = 0.047 at 25°C μmol μbar (μmol μbar)−1
Vc RuBP carboxylation rate μmol m−2 s−1
Vcmax CO2-saturated maximum carboxylation rate of Rubisco μmol m−2 s−1
Vo RuBP oxygenation rate μmol m−2 s−1
Vp PEP carboxylation rate μmol m−2 s−1
Vpmax Maximum carboxylation rate of PEPc μmol m−2 s−1
Rd Day respiration (CO2 release in the light by processes other than photorespiration) μmol m−2 s−1
Rm Day respiration in the mesophyll cells μmol m−2 s−1
Wc RuBP carboxylation rate limited by Rubisco activity μmol m−2 s−1
Wj RuBP carboxylation rate limited by electron transport μmol m−2 s−1
Wp RuBP carboxylation rate limited by triose phosphate utilization μmol m−2 s−1
x Fraction of the chloroplastic ATP that is used for the C4 cycle
z Factor for ATP production per Photosystem II electron when the cyclic electron transport runs simultaneously mol mol−1
α Fraction of glycolate carbon not returned to chloroplast
α2(LL) Quantum yield of Photosystem II electron transport (under limiting light) on the basis of light absorbed by both photosystems mol mol−1
αbs Fraction of Photosystem II that is in the bundle-sheath cells
αG Fraction of glycolate carbon taken out from the photorespiratory pathway as glycine
αS Fraction of glycolate carbon taken out from the photorespiratory pathway as serine
αT Fraction of glycolate carbon taken out from the photorespiratory pathway as CH2-THF
δ Factor defining a variable mesophyll conductance mode
ϕ RuBP oxygenation : RuBP carboxylation ratio, =Vo:Vc
ϕL Leakiness, =L/Vp
Φ1(LL) Quantum yield of Photosystem I electron transport (under limiting light) mol mol−1
Φ2(LL) Quantum yield of Photosystem II electron transport (under limiting light) mol mol−1
ΦCO2(LL) Quantum yield of CO2 uptake (under limiting light) mol mol−1
ΦO2(LL) Quantum yield of O2 evolution (under limiting light) mol mol−1
φ Chloroplastic ATP required per C4 cycle, = 2 for the NADP-ME and NAD-ME subtypes and = 2 − (n + 1)a for the PEP-CK subtype mol ATP (mol CO2)−1
γ* Half the inverse of Rubisco specificity, =0.5/Sc/o μbar mbar−1
Γ* CO2-compensation point in the absence of day respiration, =0.5Oc/Sc/o μbar
Γ*GT Modified Γ* as a result of glycolate carbon exit in the form of glycine and CH2-THF from the photorespiratory pathway, =(1 − αG + 2αT)Γ* μbar
λ Fraction of mitochondria that locate closely behind chloroplasts in the inner cytosol
θ Curvature factor of light response of electron transport
ρ2 Factor for excitation partitioning to Photosystem II, =α2(LL)/Φ2(LL)
The photosynthetic carbon-reduction cycle, the Calvin–Benson cycle, starts with the carboxylation of the CO2 acceptor ribulose 1,5-bisphosphate (RuBP), a five-carbon molecule. The reaction is catalysed by Rubisco, yielding two mol of the three-carbon molecule 3-phosphoglycerate (3-PGA) for every mol RuBP carboxylated. When CO2 supply is limiting (or when RuBP is saturating), Vc is limited by RuBP-saturated Rubisco kinetics and can be described as Wc by the Michaelis–Menten equation appropriate for the case where two substrates (CO2 and O2) compete for active sites of RuBP-bound Rubisco:
urn:x-wiley:01407791:media:pce14070:pce14070-math-0002(2a)
Likewise, Vo can be expressed as:
urn:x-wiley:01407791:media:pce14070:pce14070-math-0003(2b)
where Cc and Oc are the level of CO2 and O2 at the active sites of Rubisco, respectively; Vcmax and Vomax are the maximum rate of carboxylation and oxygenation of Rubisco, respectively; and KmC and KmO are the Michaelis–Menten constants of Rubisco for CO2 and O2, respectively. One can derive the expression for the Vc : Vo ratio from combining Equations (2a) and (2b) as: [VcmaxKmO/(VomaxKmC)]Cc/Oc, where the whole term within the [] has been defined as the relative CO2/O2 specificity of Rubisco, Sc/o (Laing, Ogren, & Hageman, 1974). If we use Γ* to denote the CO2 level at which the rate of CO2 uptake by carboxylation is balanced by the rate of photorespiratory CO2 release (i.e., Vc = 0.5Vo), also called the CO2-compensation point in the absence of day respiration, Γ* can be expressed as 0.5Oc/Sc/o (Farquhar et al., 1980). Furthermore, the Vo : Vc ratio, or ϕ can be expressed thereof as 2Γ*/Cc (Farquhar et al., 1980). Therefore, Equation (1) can be written as: A = (1 − Γ*/Cc)Vc − Rd.
Photosynthesis can also depend on the rate at which RuBP is regenerated. This usually occurs at high CO2 concentration and/or low light. The model assumes RuBP regeneration-limited photosynthesis is controlled by electron transport (Farquhar et al., 1980). Photosynthetic linear electron transport (LET) produces both NADPH and ATP; so, RuBP regeneration-limited or electron transport-limited carboxylation rate, Wj, can be formulated in terms of either NADPH supply or ATP supply from LET:
urn:x-wiley:01407791:media:pce14070:pce14070-math-0004(3a)
urn:x-wiley:01407791:media:pce14070:pce14070-math-0005(3b)
where J is the rate of potential LET.

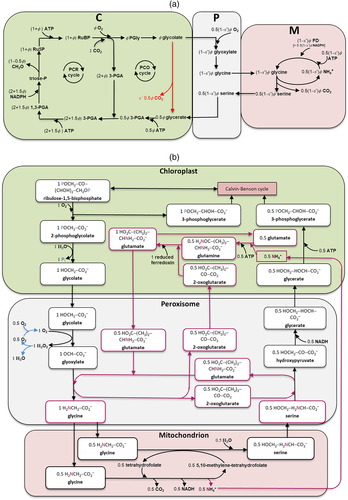
Equation (3a) is based on the stoichiometry of NADPH or electron requirement by the Calvin–Benson cycle and the photorespiratory cycle. First, carboxylation of one mol RuBP results in two mol 3-PGA, reduction of each 3-PGA to triose phosphate (TP) requires one mol NADPH (Figure 1a), and production of one mol NADPH requires two mol electrons; so, four electrons are required per carboxylation. The whole term in the numerator, (1/2)J, represents the rate of NADPH production from LET. Secondly, although oxygenation of one mol RuBP initially results in only one mol 3-PGA, it also results in one mol of the two-carbon molecule, 2-phosphoglycolate, which is dephosphorylated to glycolate in the chloroplast (Figure 1a,b). The glycolate is transported from the chloroplast into the peroxisome, where it is converted to glyoxylate and further to glycine (two carbons). The glycine is exported to the mitochondrion, where 0.5 mol glycine and tetrahydrofolate (THF) are converted by glycine decarboxylase (GDC) to 5,10-methylene-tetrahydrofolate (CH2-THF), releasing 0.5 mol ammonia and 0.5 mol CO2 in the process. CH2-THF reacts with the remaining 0.5 mol glycine to form 0.5 mol serine (three carbons). Serine moves to the peroxisome and is transformed to glycerate. The glycerate flows to the chloroplast and is converted to 0.5 mol 3-PGA. Its reduction before incorporation into the Calvin-Benson cycle consumes 0.5 mol NADPH. The 0.5 mol ammonia released by GDC is re-assimilated into glutamate requiring one mol reduced ferredoxin (equivalent to 0.5 mol NADPH). In sum, the photorespiratory cycle involving three organelles (chloroplast, peroxisome, and mitochondrion, Figure 1b) requires four electrons per oxygenation.
Details are in the caption following the image
The stoichiometry of the Calvin–Benson cycle or photosynthetic carbon reduction (PCR) cycle and the photorespiratory carbon oxidation (PCO) cycle. Panel (a) is redrawn with permission from von Caemmerer (2013), where ϕ denotes the oxygenation to carboxylation ratio. The complete photorespiratory cycle involves the chloroplast (C), the peroxisome (P), and the mitochondrion (M) where CO2 from glycine decarboxylation is released. The red line indicates a so-called photorespiratory bypass, enabling a fraction (x′) of the photorespiratory CO2 released in the chloroplast, which not only increases the chance for the photorespiratory CO2 being refixed by Rubisco in chloroplast, but may also decrease the energy (ATP and reduced ferredoxin) requirement associated with the recycling of ammonia released from glycine decarboxylation. No attempt is made here to calculate the exact change of energy requirement, because that depends on the type of bypass (Peterhansel, Blume, & Offermann, 2013). Abbreviations: 3-PGA, 3-phosphoglycerate; 1,3-PGA, 1,3-bisphosphoglycerate; FD, reduced ferredoxin; PGly, phosphoglycolate; Ru5P, ribulose 5-phosphate; RuBP, ribulose 1,5-bisphosphate; triose-P, triose phosphate. Panel (b) shows detailed reactions, and the carbon- and nitrogen-atoms in the metabolites, of the standard photorespiratory cycle (redrawn with permission from Taiz and Zeiger (2002), where the flow of carbon and nitrogen are indicated in black and pink, respectively [Colour figure can be viewed at wileyonlinelibrary.com]

In Equation (3b), the coefficient 2/3 stems from understandings of that time (in 1980) about the stoichiometry that each mol electron in LET translocates two mol protons (H+) across the thylakoid membrane into the lumen, and synthesis of one mol ATP requires three mol H+; so, the whole term in the numerator, (2/3)J, represents the rate of ATP production from LET. The coefficient 3 in the denominator refers to the requirement of three mol ATP per mol RuBP carboxylated by the Calvin–Benson cycle, consisting of two mol ATP for the phosphorylation of two mol 3-PGA to two mol 1,3-bisphosphoglycerate (before the reduction step consuming NADPH) and one mol ATP for the subsequent phosphorylation of one mol ribulose 5-phosphate to one mol RuBP (Figure 1a). The coefficient 3.5 refers to the ATP requirement per oxygenation by the photorespiratory cycle. This consists of: (1) one mol ATP for the phosphorylation of one mol 3-PGA to one mol 1,3-bisphosphoglycerate before its reduction, (2) one mol ATP for the phosphorylation of ribulose 5-phosphate to RuBP, (3) 0.5 mol ATP for the phosphorylation of glycerate to 3-PGA plus 0.5 mol ATP for the subsequent phosphorylation of this 0.5 mol 3-PGA, and (4) 0.5 mol ATP for the re-assimilation of 0.5 mol ammonia (Figure 1a).

There are several equation forms describing J in Equations (3a) and (3b) as a function of absorbed irradiance (Iabs), but a non-rectangular hyperbolic function as the smaller root to the quadratic equation of Farquhar and Wong (1984) is mostly used now:
urn:x-wiley:01407791:media:pce14070:pce14070-math-0006(4)
where Jmax is the maximum rate of LET under the saturating irradiance, f is the fraction of Iabs unavailable for Calvin–Benson and photorespiratory cycles, 0.5 refers to the partitioning factor of the light energy between the two photosystems, and θ is the curvature factor.
The carboxylation rate can be limited either by RuBP-saturated rate Wc or by RuBP-regeneration determined rate Wj; so, Equation (1) becomes:
urn:x-wiley:01407791:media:pce14070:pce14070-math-0007(5)
Equation (5), combined with Equation (2a) for Wc, Equation (3a) or (3b) for Wj and Equation (4) for J, forms the basic FvCB model. We shall call it the canonical FvCB model.

Since its first publication, the model has been developed further several times for C3 photosynthesis (Busch, 2020; Busch, Sage, & Farquhar, 2018; Harley & Sharkey, 1991; Sharkey, 1985a, 1985b; Yin, van Oijen, & Schapendonk, 2004) and extended for C4 photosynthesis (von Caemmerer & Furbank, 1999). Also, this model has been integrated with models for mesophyll CO2-diffusion for various applications. In this paper, we outline the major extensions and review how these extensions and integration have broadened the use of the model in exploring the underlying physiology of photosynthesis.

2 EXTENSION 1: INTRODUCING THE THIRD LIMITATION SET BY TRIOSE PHOSPHATE UTILIZATION

2.1 Accommodating photosynthetic insensitivity to CO2 and O2

The canonical FvCB model predicts that A will always increase with increasing CO2 level, despite a lower increase in the Wj-limited range than in the Wc-limited range. However, many (e.g., Sharkey, 1985a) showed that A can be insensitive to changes in the CO2 partial pressure within the high CO2 range, in particular in combination with high irradiance, or low O2 partial pressure, or at low temperature. Sharkey (1985b) hypothesized that this insensitivity was due to the limitation set by the rate at which TP are utilized in the synthesis of sucrose or starch. As the use of TP is stoichiometrically exchanged with the release of phosphate (Pi) during sucrose or starch synthesis, a limitation in TP utilization (TPU) could result in a limitation to photophosphorylation, and, thus, to RuBP regeneration. So, in addition to what has been assumed about the control of RuBP regeneration by electron transport in the canonical FvCB model, RuBP regeneration can be limited further by other components as in the Calvin–Benson cycle and beyond. If TPU limits, the equation for A, equivalent to Equation (5), in the FvCB model, should be extended as:
urn:x-wiley:01407791:media:pce14070:pce14070-math-0008(6a)
where Wp is the rate of carboxylation set by TPU limitation.
The carboxylation of one mol RuBP results in two mol TP but the Calvin–Benson cycle stoichiometry suggests that only one-sixth of the TP is used for sucrose or starch synthesis, whereas the remaining five-sixths of the TP are drawn back into the cycle to contribute to the regeneration of RuBP (Taiz & Zeiger, 2002). Thus, the Pi consumption by sucrose or starch synthesis is 2Vc/6 = Vc/3. Considering the carbon loss in the photorespiratory cycle, the net Pi consumption would be (1–0.5ϕ)Vc/3, and this must be equal to the release of Pi via TPU if Pi is limiting. Let Tp be the rate of TPU, then one can write:
urn:x-wiley:01407791:media:pce14070:pce14070-math-0009(6b)
Substituting Equation (6b) into Equation (6a) gives the net CO2-assimilation rate limited by TPU, Ap, as:
urn:x-wiley:01407791:media:pce14070:pce14070-math-0010(6c)
This is the simple equation given first by Sharkey (1985b), which suggests that if TPU is limiting, A is no longer sensitive to changes in CO2 or O2 partial pressure, or in irradiance. It sets an upper limit to net assimilation rate.

2.2 Accommodating the reversed sensitivity to CO2 and O2

It has been frequently observed that A even declines with increasing CO2 partial pressure within the high CO2 range, particularly under low O2 conditions (e.g., von Caemmerer & Farquhar, 1981). Similarly, increasing O2 has been observed to stimulate CO2 assimilation under high CO2 conditions (Harley and Sharkey (1991). These reversed sensitivities to CO2 and O2 cannot be explained by the simple model, Equation (6c).

Sharkey and Vassey (1989) proposed that the reverse sensitivity was caused by inhibition of starch synthesis capacity, and in turn caused reduced stromal phosphoglucoisomerase activity resulting from metabolites interfering with its activity. An alternative explanation was proposed by Harley and Sharkey (1991) that a fraction of the glycolate carbon, which leaves the chloroplast and is recycled to glycerate in the photorespiratory cycle, does not return to the chloroplast, but after converting to glycine, is diverted from the photorespiratory cycle and used elsewhere for amino acid synthesis. Thus, the Pi normally used in converting glycerate to 3-PGA is made available for phosphorylation instead, thereby, stimulating RuBP regeneration. Based on this hypothesis, Harley and Sharkey (1991) used three values for the fraction (0.0, 0.5, and 1.0) to fit data and showed how the curvature of photosynthetic CO2-response curves (ACi curves) had varying extents of the reversed CO2 and O2 sensitivity.

Based on the analysis by Harley and Sharkey (1991), von Caemmerer (2000) formalized the model by using α as the fraction of the glycolate carbon that is not returned to the chloroplast. As one oxygenation produces 0.5 glycerate, which consumes one Pi, the rate of Pi consumption, which usually is (1 − 0.5ϕ)Vc/3, should be decreased by αVo/2, or αϕVc/2. Thus, the net Pi consumption in this case would be [(1 − 0.5ϕ)/3 − αϕ/2]Vc. In analogy to Equation (6b), Wp as the rate of carboxylation set by TPU limitation becomes:
urn:x-wiley:01407791:media:pce14070:pce14070-math-0011(7a)
The model for the net CO2-assimilation rate, Ap, becomes:
urn:x-wiley:01407791:media:pce14070:pce14070-math-0012(7b)
where 0 ≤ α ≤ 1. If α = 0, Equation (7b) becomes Equation (6c), representing the case that glycolate carbon maximally returns to the chloroplast (i.e., ¾ of the glycolate carbon is recycled as glycerate; the other ¼ is lost as CO2 as the result of glycine decarboxylation). Harley and Sharkey (1991) showed that for the same value of α, TPU starts to limit A at a lowering CO2 level with increasing irradiance, with decreasing O2 level, and with decreasing temperature. The reverse sensitivity that can occur based on Equation (7b) is frequently observed but occasionally the reverse sensitivity is greater than what can be accounted for by Equation (7b). It is likely that both the incomplete photorespiratory cycle explanation and the starch inhibition explanation (Sharkey & Vassey, 1989) can be valid, although in our experience the incomplete photorespiratory cycle phenomenon is more common.

2.3 Implications of TPU limitation in modelling leaf photosynthesis

Ellsworth, Crous, Lambers, and Cooke (2015) showed that TPU limitations to photosynthetic capacity are common in woody species grown in the field. However, TPU might not be the most important limitation under current climatic growth conditions, as evidenced by Kumarathunge, Medlyn, Drake, Rogers, and Tjoelker (2019), who reported that only ca 30% of ACi curves showed an obvious TPU limitation in a global data representing 141 species. Irrespective of its uncertain importance under field conditions, the inclusion of TPU limitation in models is important for elucidating the basic principles of photosynthetic mechanisms. In cases where TPU is actually limiting, the canonical, two-limitation FvCB model would underestimate Jmax (when fitting to ACi curves) and Vcmax or Jmax (when fitting to light response curves) because the maximum photosynthetic rate would be wrongly attributed to being limited by electron transport or by Rubisco activity.

It is important to note that TPU limitation is a form of very short-term sink–source disequilibrium (McClain and Sharkey (2019). It concerns the ability to remove TP quickly from the Calvin–Benson cycle. The half-life time of the cycle intermediates can be shorter than 1 s, while some larger pools still have a half-life time of <1 min. This means that TPU limitation can build up and disappear quickly. As discussed by Sharkey (2019), when plants are put into TPU limited conditions for hours or days, the TPU limitation is observable at first; but then other components like electron transport are regulated to a level that TPU is no longer “apparently” limiting (e.g., Pammenter, Loreto, & Sharkey, 1993). Furthermore, over a longer time, a larger sink can remove short-term TPU limitation. Kaschuk et al. (2012) showed that nodulated soybean plants had 14%–31% higher rates of photosynthesis and accumulated less starch in the leaves than nitrogen-fertilized plants, supporting that rhizobial symbiosis could stimulate photosynthesis due to the removal of carbon sink limitation by nodule activities.

Conversely, a small sink, especially when combined with a large source, can cause TPU limitation. Fabre et al. (2019) reported the occurrence of TPU limitation in panicle-pruned rice plants, especially those grown under 800 μmol mol−1 CO2. This reduction was associated with sucrose accumulation in the flag leaf resulting from the sink limitation. The photosynthetic stimulation by the elevated-CO2 was lower in pruned plants compared with control plants, and this response to CO2 in relation to sink size was also found when comparing various rice genotypes having contrasting leaf:panicle size ratios or source:sink ratios (Fabre et al., 2020). A recent review by Dingkuhn et al. (2020) even found the evidence from broader ranges of genotypes that stronger elevated-CO2 responsiveness in wild relatives and old cultivars of crops is related to sink strength as a result of adaptive plasticity involving branching. Perhaps, the most important result in recent work of Fabre et al. is that TPU, thus net CO2 assimilation rate, declines increasingly with time after the midday in a diurnal cycle. These findings suggest that not only TPU limitation in regulating photosynthesis should be considered, but also a shorter time-step would be needed to account for diurnal variations in sink feedback limitation to photosynthesis, in dynamic crop models for projecting the CO2-fertilization effect on crop production.

3 EXTENSION 2: INTRODUCING ALTERNATIVE ELECTRON TRANSPORT PATHWAYS

3.1 Accommodating a balanced ATP:NADPH ratio

In the canonical FvCB model, there are two different equations, Equations (3a) and (3b), for the same electron transport-limited carboxylation rate, Wj. By comparison of the two equations, one can immediately recognize that the value of Wj determined by the ATP supply is more limiting than that determined by the NADPH supply. The two equations were used largely in a random manner in the literature before 2000. To eliminate the “random” application of the FvCB model, Yin et al. (2004) developed a generalized model that covers, among others, the two forms of the FvCB model for the electron transport-limited rate.

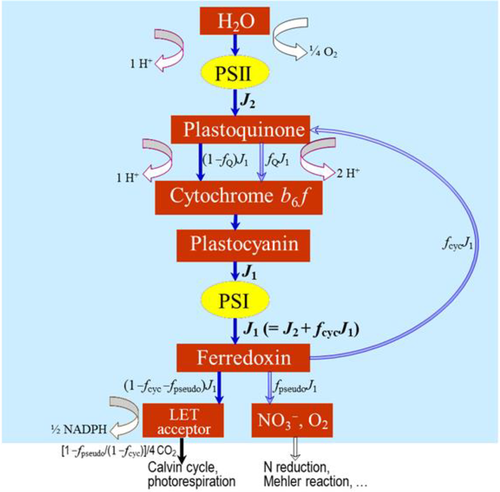
It is apparent that, according to the stoichiometric coefficients accepted in 1980, the LET produces an ATP:NADPH ratio of 1.333 [resulting from (2/3):(1/2), see Equation (3a) vs. Equation (3b)], well below 1.5 as required by the Calvin–Benson cycle, with ATP in deficit relative to NADPH. Chloroplasts engage several mechanisms that could remove the disparity in terms of requirement for the correct ATP:NADPH ratio (Allen, 2003; Baker, Harbinson, & Kramer, 2007; Farquhar & von Caemmerer, 1982). First, instead of going to the end electron acceptor NADP+, a fraction of electrons passing PSI may follow a cyclic electron pathway (fcyc) (Figure 2). The cyclic electron transport (CET) does not produce NADPH, but passes through the “coupling” sites of ATP synthase (Allen, 2003), thereby being able to increase the ATP:NADPH ratio. Second, part of the noncyclic electrons may be used to support processes like the Mehler ascorbate peroxidase reaction or nitrate reduction, where O2 directly or nitrate indirectly act as the electron acceptors, respectively (Figure 2). Every one mol O2 uptake in the Mehler ascorbate peroxidase reaction is accompanied by one mol O2 production from the splitting of water at PSII; so this reaction consumes four electrons per O2 but requires no ATP (Asada, 1999). The first step of the reduction of nitrate into nitrite takes place in the cytosol but may use reducing power generated in the chloroplast (e.g., via the malate shuttle) and the subsequent steps in converting nitrite to ammonia and to glutamate take place in the chloroplast stroma, using the reduced ferredoxin (Noctor & Foyer, 1998). One mol nitrate reduction requires 10 mol electrons and only one mol ATP (Noctor & Foyer, 1998). Thus, both the Mehler ascorbate peroxidase reaction and nitrate reduction can help to adjust the ATP:NADPH ratio as required by the Calvin–Benson and the photorespiratory cycles. There are some other minor processes like sulphur assimilation and fatty acid biosynthesis that might use chloroplastic electrons but these are quantitatively less significant. For the convenience of modelling, the noncyclic electron transport in support of the Mehler ascorbate peroxidase reaction, nitrate reduction and any other minor processes is collectively named as the pseudocyclic category, and this fraction is denoted as fpseudo (Yin et al., 2004). Therefore, the fraction for LET (i.e., the fraction of the total electron flux passing PSI that is to support the Calvin–Benson and the photorespiratory cycles) is (1 − fcyc − fpseudo) (Figure 2). Yin et al. (2004) derive a relationship for fractions of various electron transport pathways that must be met in order to ensure that the produced ATP:NADPH ratio is compatible with the required ratio by the Calvin–Benson and the photorespiratory cycles:
urn:x-wiley:01407791:media:pce14070:pce14070-math-0013(8)
where h is the number of H+ required per ATP synthesis and fQ is the fraction of electrons at the plastoquinone that follows the Q cycle (Figure 2).
Details are in the caption following the image
The scheme for pathways of linear, cyclic and pseudocyclic electron transport (blue arrows) as driven by light energy allocated to Photosystem II (PSII) and Photosystem I (PSI), in the light reactions (with light-blue background) of photosynthesis (redrawn with permission from Yin et al., 2004). Thick-curved arrows show O2 evolved, protons (H+) pumped or NADPH produced per electron transferred. H+ are required for ATP synthesis, and produced ATP and NADPH (or reductant equivalents) are used for various metabolic processes specified underneath in black phrases. The cyclic electron transport, the pseudocyclic electron transport, and the Q cycle introduced in Extension 2 are shown in thin double-lined arrows and their fluxes are all expressed in proportion to the total electron flux passing PSI (J1) as fcycJ1, fpseudoJ1 and fQJ1, respectively. The linear electron transport (LET) as the only pathway defined in the canonical model is shown in thick single-lined arrows and expressed as (1 − fcyc − fpseudo)J1. In the presence of the cyclic electron transport, the electron flux passing PSII (J2) is smaller than that passing PSI: J2 = (1 − fcyc)J1, instead of J2 = J1 as implied in the canonical model. In the presence of pseudocyclic electron transport for supporting processes like nitrate reduction, CO2 uptake is not in a 1:1 ratio to O2 evolution, but is [1 − fpseudo/(1 − fcyc)] mol CO2 per mol O2 evolved (assuming no Mehler reaction), which is the basis for Equation (13b) (see the text) [Colour figure can be viewed at wileyonlinelibrary.com]
In the presence of CET, the PSI electron flux (J1) is higher than the PSII electron flux (J2): J1 = J2/(1 − fcyc) (Yin et al., 2004). The LET in support of the Calvin–Benson and the photorespiratory cycle is (1 − fcyc − fpseudo)J1 (Figure 2). Combining these equations with Equation (3a) of the FvCB model gives:
urn:x-wiley:01407791:media:pce14070:pce14070-math-0014(9a)
Substituting Equation (8) to Equation (9a) gives:
urn:x-wiley:01407791:media:pce14070:pce14070-math-0015(9b)
The two forms of electron transport-limited part of the canonical FvCB model are special cases of this extended model. If fpseudo = 0, Equation (9a) becomes Equation (3a); in such a case, the whole PSII electron flux equals the LET (J2 = J). If fQ = 0, h = 3, and fcyc = 0, Equation (9b) becomes Equation (3b). So, the canonical FvCB model implies no operation of the Q cycle and a requirement of three H+ per ATP synthesis (the H+:ATP ratio h = 3).
However, the contemporary belief is that the Q cycle may operate obligatorily (fQ = 1; e.g., Sacksteder, Kanazawa, Jacoby, & Kramer, 2000), and this cycle will effectively double the stoichiometry of the H+ translocation through the cytochrome b6f complex from one H+ to two H+ per electron passed therein (Figure 2). So, plus one H+ pumped from splitting the water molecule through the PSII complex, a total of three H+ (instead of two) produced per electron are transferred along the whole-chain if the Q cycle operates (von Caemmerer, 2000; also see Figure 2). Also, the H+:ATP ratio is probably either 4 based on thermodynamic experiments (Petersen, Förster, Turina, & Gräber, 2012; Steigmiller, Turina, & Gräber, 2008) or 4.67 (=14/3) from the structural data for the c14 rotor ring of the H+ translocating chloroplast ATP synthase (Seelert et al., 2000; Hahn, Vonck, Mills, Meier, & Kühlbrandt, 2018), instead of 3 used in the FvCB model. If fQ = 1, h = 4, and fcyc = 0, then the produced ATP:NADPH ratio from the noncyclic electron pathway is 1.5, exactly matching the ratio required by the Calvin–Benson cycle and Equation (9b) becomes Equation (2.22) in the book of von Caemmerer (2000) for this scenario, that is,
urn:x-wiley:01407791:media:pce14070:pce14070-math-0016(9c)
If fQ = 1, h = 4.67, and fcyc = 0, the ATP:NADPH ratio from the noncyclic electron pathway is 1.286 (even lower than 1.333 assumed in the canonical FvCB model), and the value has often been cited in the recent literature to stress the surplus of the reducing power which might be exported to cytosol (e.g., Lim et al., 2020). For such a case, Equation (9b) becomes:
urn:x-wiley:01407791:media:pce14070:pce14070-math-0017(9d)
Clearly, the model of Extension 2 represents the generalized algorithm for various scenarios with regard to the H+:electron and the H+:ATP ratios. Equation (9b) actually contains the ATP production factor (z) per electron transferred through PSII when CET occurs simultaneously (also see Equation (B8b) in the Appendix B of Yin et al., 2004):
urn:x-wiley:01407791:media:pce14070:pce14070-math-0018(9e)
This ATP:electron ratio factor z is 2/3 in Equation (3b) of the canonical FvCB model, 3/4 in the case of Equation (9c), and 9/14 in the case of Equation (9d). The z factor also predicts that for a given set of fQ and h, the ATP:electron ratio increases expectedly with increasing fcyc (see later for C4 photosynthesis). Given that the Q cycle may not necessarily switch absolutely on (fQ = 1) and off (fQ = 0) but run partially (Cornic, Bukhov, Wiese, Bligny, & Heber, 2000), the model allows such scenarios with 0 ≤ fQ ≤ 1. As noted by Yin et al. (2004), the model assumes that the Q cycle, either obligatorily or partially operated, is impartial to cyclic and noncyclic electrons (Allen, 2003).

3.2 Quantum efficiency of electron transport when cyclic and noncyclic pathways co-occur

When CET and noncyclic (including linear and pseudocyclic) electron transport run simultaneously, a higher electron flux is expected in PSI than in PSII. This means that the fraction of light energy partitioned to PSI and PSII may not be 0.5 each as set by Equation (4) in the canonical FvCB model, but higher than 0.5 for PSI. On the other hand, the partitioning factor must also depend on the photochemical efficiency of the two photosystems, with partitioning in favour of the less efficient PSII in the absence of CET, given that the photochemical efficiency of PSII (Φ2) is lower than that of PSI (Φ1) (e.g., Hogewoning et al., 2012). Yin et al. (2004) developed an analytical equation for describing the parameter α2(LL), the quantum efficiency of PSII electron transport (under limiting light, LL) on the basis of absorbed photons by both photosystems:
urn:x-wiley:01407791:media:pce14070:pce14070-math-0019(10a)
The fraction of absorbed light partitioned to PSII, ρ2, can be formulated as:
urn:x-wiley:01407791:media:pce14070:pce14070-math-0020(10b)
Equations (10a) and (10b) both suit for limiting light conditions, as well as for nonlimiting light conditions (if the subscript (LL) is removed) as long as A is limited by electron transport. The model for describing J2 as a function of the full range of absorbed irradiance (Iabs) can be formulated in analogy to Equation (4) as:
urn:x-wiley:01407791:media:pce14070:pce14070-math-0021(11)
where J2max is the maximum value of the potential J2 under saturating irradiance, to differentiate it from Jmax in Equation (4) that stands for the maximum rate of the potential LET.

3.3 Quantum yield of CO2 uptake and of O2 evolution

It is convenient to derive the expression for quantum yield of CO2 uptake (ΦCO2(LL)), from Equations (5), (9a), (10a) and (11) in terms of NADPH supply:
urn:x-wiley:01407791:media:pce14070:pce14070-math-0022(12a)
Likewise, ΦCO2(LL) can also be expressed in terms of ATP supply:
urn:x-wiley:01407791:media:pce14070:pce14070-math-0023(12b)
Equivalent equations based on the canonical FvCB model are:
urn:x-wiley:01407791:media:pce14070:pce14070-math-0024(12c)
urn:x-wiley:01407791:media:pce14070:pce14070-math-0025(12d)
The FvCB model assumes that ρ2 = 0.5. Comparison of Equations (12a) and (12c) immediately identifies that the f factor in the FvCB model, representing the fraction of Iabs unavailable for Calvin–Benson and photorespiratory cycles, can be expressed as: f = 1 − Φ2LL[1 − fpseudo/(1 − fcyc)]. In other words, the factor f actually lumps multiple components, including the non-photochemical loss of PSII (Φ2LL known not to be higher than 0.85, Björkman & Demmig, 1987), cyclic electron transport (fcyc), and pseudocyclic electron components (fpseudo) that support alternative metabolic processes. Much literature after Farquhar et al. (1980) often only refers to f to correct for spectral quality of the light (e.g., von Caemmerer, 2000). While this definition of f reflects the often-reported wavelength dependent photosystems' photochemical efficiencies and absorption by carotenoids and nonphotosynthetic pigments (e.g., Evans, 1987; Hogewoning et al., 2012), it is more difficult to reconcile well with the insights from the extended model.

Photosynthetic quantum yield can also be expressed in terms of O2 evolution (ΦO2(LL)). The electron requirement in support of both Calvin–Benson and photorespiratory cycles leads to O2 evolution at PSII from the splitting of H2O; so, the total O2 evolved can be expressed as (1 + 2Γ*/Cc)Vc. The O2 uptake by photorespiration consists of (i) one mol O2 consumed per mol RuBP oxygenation, and (ii) a further one mol O2 consumed in the conversion of one mol glycolate to one mol glyoxylate by glycolate oxidase in the peroxisome, producing one mol hydrogen peroxide (H2O2) which is immediately destroyed by the action of catalase into one mol H2O and 0.5 mol O2 (Figure 1b). So the total O2 uptake associated with the photorespiratory pathway is 1.5 mol O2 per mol RuBP oxygenated, which can be expressed as 1.5Vo = (3Γ*/Cc)Vc. Taking these together, the Rubisco-linked net O2 evolution is (1 − Γ*/Cc)Vc, which is the same as for CO2 uptake (von Caemmerer, 2000).

The Mehler ascorbate peroxidase reaction consumes noncyclic electrons, but its stoichiometry is that for every mol O2 directly reduced in this reaction, 0.5 mol O2 is released by superoxide dismutase and 0.5 mol O2 is evolved through the splitting of H2O at PSII such that the reaction results in no net O2 exchange (Asada, 1999). In contrast, processes like nitrate reduction, also consuming noncyclic electrons, do result in O2 evolution. Thus, if photosynthetic quantum yield is expressed in terms of O2 evolution (ΦO2(LL)), we can break down fpseudo in Equation (12a) into two components: one for the Mehler ascorbate peroxidase reaction and one for other basal components, and the latter is no longer needed in the equation for ΦO2(LL). As the Mehler ascorbate peroxidase reaction acts as a photoprotection mechanism when absorbed light energy exceeds the enzymatic capacity of downstream metabolism (Ort & Baker, 2002), this reaction may be negligible under strictly limiting light conditions. Thus, quantum yield of O2 evolution for the limiting light conditions becomes:
urn:x-wiley:01407791:media:pce14070:pce14070-math-0026(12e)

3.4 Using the quantum yield model to infer hard-to-measure parameters

The unique feature of Equation (12e) based on the extended model for Wj is that fcyc is in the model for describing NADPH-dependent quantum yield, in contrast to the conventional belief that CET can generate additional ATP and must appear only in equations for the ATP-dependent quantum yield. Parameter fcyc does appear in Equation (12b) for the ATP-dependent quantum yield, but Equation (12b) includes uncertain parameters fQ and h in addition to fcyc. Relying on this unique feature and the generally conserved PSII:PSI efficiency ratio, Yin, Harbinson, and Struik (2006) showed that a hard-to-measure parameter fcyc can be calculated from Equation (12e), based on measurable parameters ΦO2LL and Φ2LL under nonphotorespiratory conditions:
urn:x-wiley:01407791:media:pce14070:pce14070-math-0027(13a)
A typical Φ2LL based on chlorophyll fluorescence measurements is 0.8 and a typical Φ1LL based on P700 absorption measurements is close to 1.0 or slightly lower (Genty & Harbinson, 1996); so, the Φ2LL:Φ1LL ratio is ca 0.85. ΦO2LL of C3 photosynthesis in the absence of photorespiration is ca 0.105 (Björkman & Demmig, 1987). The solved fcyc from Equation (13a) is then ca 0.06. This cannot be considered as an absolute estimate, but suggests that very little CET is needed for C3 photosynthesis, in line with previous reports (e.g., Avenson et al., 2005).

Once fcyc is known, one can calculate another hard-to-measure light-partitioning parameter ρ2 from Equation (10b). The obtained ρ2 is ca 0.53, close to the assumed value 0.5 in the canonical FvCB model. This indicates that the requirement for a higher partitioning to the less efficient PSII is to some extent balanced by the requirement for a higher partitioning to PSI to run CET. Equation (10b) suggests that ρ2 equals exactly 0.5 only if the fraction for the noncyclic electron flow, 1 − fcyc, is equal to the Φ2LL:Φ1LL ratio.

By dividing Equation (12a) by Equation (12e) that assumes no Mehler ascorbate peroxidase reaction for the limiting light condition, one can solve for basal fpseudo from the ΦCO2LL:ΦO2LL ratio:
urn:x-wiley:01407791:media:pce14070:pce14070-math-0028(13b)
Unlike Equation (13a), Equation (13b) applies to both nonphotorespiratory and photorespiratory conditions. A typical value of ΦCO2LL of C3 photosynthesis under limiting light in the absence of photorespiration is ca 0.093 (Long, Postl, & Bolhár-Nordenkampf, 1993). This gives an estimate of fpseudo being ca 0.10. The ΦCO2LL:ΦO2LL ratio is also known as the assimilatory quotient, and the value of its complement, (1 − the ratio), indicates the extent to which electrons are used in support of the processes like nitrogen assimilation (Bloom, Caldwell, Finazzo, Warner, & Weissbart, 1989; Skillman, 2008).

Once fcyc and fpseudo are known, likely combinations of fQ and h can be solved from Equation (8) for C3 photosynthesis. Using the above estimates of fcyc and fpseudo for the nonphotorespiratory conditions, the solved h is ca 3.1 if fQ = 0 and is ca 4.67 if fQ = 1. The latter combination is very close to the contemporary belief that the operation of the Q cycle is obligatory (Sacksteder et al., 2000) and the structural data that chloroplast ATP synthase requires 4.67 c subunits or protons to produce one ATP (Seelert et al., 2000; Hahn et al., 2018). However, like the canonical FvCB model, Equation (8) does not account for small amounts of ATP required for starch synthesis and nitrogen assimilation. As ATP for these processes most likely come from chloroplasts (Noctor & Foyer, 1998), then the calculated h would approach 4. Energy requirements for nitrogen assimilation will further be discussed next.

4 EXTENSION 3: INTRODUCING PHOTORESPIRATION-ASSOCIATED NITROGEN AND C1 METABOLISMS

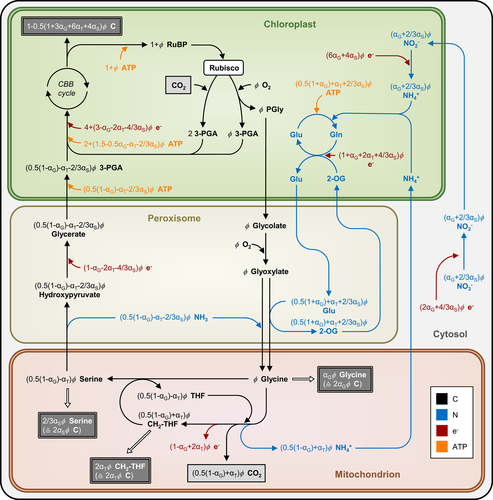
Nitrogen (N) assimilation can be intrinsically linked to the photorespiratory pathway (Bloom, 2015). While the electron and ATP requirement associated with re-cycling of the ammonia released by photorespiration is already accounted for (see Section 1), the energy requirement for reduction and assimilation of new nitrogen that enters the leaf is not accounted for in the canonical FvCB model. De novo assimilation of nitrogen in leaves of C3 plants can arise via the photorespiratory pathway because, as discussed earlier, the photorespiratory intermediate glycine can be diverted from the photorespiratory pathway and used elsewhere for amino acid synthesis, which explains the reversed photosynthetic sensitivity to CO2 and O2 (Harley & Sharkey, 1991). In addition, serine, a product of glycine decarboxylation in the photorespiratory pathway, can act as a precursor of several other amino acids (Ros, Muñoz-Bertomeu, & Krueger, 2014). The nitrogen molecules of both glycine and serine, if exported from the photorespiratory pathway for other uses or accumulated temporarily, have to be replenished by de novo assimilation of nitrogen; otherwise the pathway cannot be continued. Busch et al. (2018) extended both Wp- and Wj-limited rates of the FvCB model, by following the stoichiometry of energy requirement by both carbon and nitrogen assimilation as well as the stoichiometry for the amino-group balance. More recently, Busch (2020) further extended the model to account for the additional export of glycolate carbon as the photorespiratory pathway is also the main supply of the activated one-carbon units to the so-called C1 metabolism. This is because, as stated in Section 1, the glycine decarboxylation step can catalyse the conversion of the cofactor tetrahydrofolate (THF) to CH2-THF that acts as the leaf's currency for activated C1 units. Here, we collectively describe the extension involving both de novo nitrogen assimilation and C1 metabolisms (Figure 3).
Details are in the caption following the image
Stoichiometries of electron (red) and ATP (orange) requirements for the Calvin–Benson–Bassham (CBB) cycle, and for the photorespiratory pathway where there are fractions of glycolate carbon that exits in the form of either glycine (αG), or CH2-THF (αT), or serine (αS). The RuBP oxygenation to RuBP carboxylation ratio is denoted as ϕ. All these fluxes, also including carbon (in black) and nitrogen (in blue), are scaled in relation to the rate of RuBP carboxylation. The difference between CO2 taken up by carboxylation and CO2 released from photorespiration, shown in light grey boxes, equals the sum of individual sinks for assimilated carbon indicated by double-bordered grey boxes (redrawn with permission from Busch, 2020). The amount of NO3 entering the leaf via de novo nitrogen assimilation equals the total flux of nitrogen leaving the pathway in the form of glycine and serine (αG + 2/3αS)ϕ. The stoichiometric coefficients for nitrogen assimilation are formulated from the understanding that (i) one mol nitrogen assimilation from nitrate (NO3) into glutamate requires 10 mol electrons, including one mol NADH (equivalent to two electrons) for reducing NO3 to nitrite (NO2), six electrons in the form of reduced ferredoxin for reducing NO2 to ammonia (NH4+), and two electrons again in the form of reduced ferredoxin for the glutamate synthesis from glutamine, and (ii) the formation step of one mol glutamine from NH4+ and glutamate also requires one mol ATP, which is the only ATP required for the whole process of NO3 reduction (Noctor & Foyer, 1998). Note that NADH released from the glycine decarboxylation in the mitochondrion, NADH used for transforming hydroxypyruvate into glycerate in the peroxisome, and NADH used for reducing NO3 to NO2 in the cytosol are all shown in the electron equivalents. Abbreviations: 2-OG, 2-oxoglutarate; 3-PGA, 3-phosphoglycerate; CH2-THF, 5,10-methylene-tetrahydrofolate; Gln, glutamine; Glu, glutamate; PGly, phosphoglycolate; RuBP, ribulose 1,5-bisphosphate; THF, tetrahydrofolate [Colour figure can be viewed at wileyonlinelibrary.com]

4.1 The general model of extension 3 integrating nitrogen and C1 metabolisms

Busch et al. (2018) used αG and αS to denote the fractions of glycolate carbon taken out from the photorespiratory pathway as glycine and serine, respectively. Likewise, Busch (2020) used αT to denote the fraction of glycolate carbon taken out from the photorespiratory pathway as CH2-THF. As shown in Figure 3, the glycolate carbon exported in the form of the three-carbon molecule serine has to be less than or equal to the remaining carbon after the glycine export, glycine decarboxylation, and CH2-THF export: urn:x-wiley:01407791:media:pce14070:pce14070-math-0029αSurn:x-wiley:01407791:media:pce14070:pce14070-math-0030(1 − αG) − αT, where urn:x-wiley:01407791:media:pce14070:pce14070-math-0031 refers to the glycolate: serine carbon ratio (Figure 1b), and urn:x-wiley:01407791:media:pce14070:pce14070-math-0032 refers to half of glycine carbon lost during its decarboxylation. This relation can be converted into αG + 2αT + urn:x-wiley:01407791:media:pce14070:pce14070-math-0033αS ≤ 1, thereby reflecting that the total proportion of glycolate carbon exports cannot exceed 1. Of course, none of αG, αT and αS can be lower than 0. In analogy to the derivation of Equation (7a) by Harley and Sharkey (1991), the rate of Pi consumption, which usually is (1 − 0.5ϕ)Vc/3, should be decreased by (αG + 2αT + urn:x-wiley:01407791:media:pce14070:pce14070-math-0034αS)ϕVc/2, and the net Pi consumption would be [(1 − 0.5ϕ)/3 − (αG + 2αT + urn:x-wiley:01407791:media:pce14070:pce14070-math-0035αS)ϕ/2]Vc. Thus, Wp as the rate of carboxylation set by TPU limitation in this case becomes:
urn:x-wiley:01407791:media:pce14070:pce14070-math-0036(14)
Equation (14) becomes Equation (7a) if αS = 0 and αT = 0.
While Wc remains unchanged as Equation (2a), the rate of carboxylation as determined by electron transport, Wj, will be affected as the potential electron transport rate J now has to support both carbon and nitrogen assimilation. Photorespiratory carbon entering the C1 metabolism, in contrast, causes a net release of electrons, as the reaction catalysed by GDC releases electrons and the exit of carbon from the photorespiratory pathway saves electrons downstream that would otherwise be consumed for converting serine to glycerate in the peroxisome and for reducing this glycerate-derived 3-PGA in the chloroplast (Figures 1b and 3). These together bring the equation for electron transport-determined carboxylation rate in terms of NADPH supply to:
urn:x-wiley:01407791:media:pce14070:pce14070-math-0037(15a)
The denominator can be obtained by summing up all the electron requirements for individual steps, deducted by electron equivalents of the NADH release as a result of glycine decarboxylation, indicated in Figure 3. Likewise, photorespiratory carbon export via the C1 metabolism saves ATP that would otherwise be used for the phosphorylation of glycerate to 3-PGA and for the subsequent phosphorylation of this 3-PGA (Figures 1b and 3); thus, one can formulate the equation for Wj in terms of ATP supply:
urn:x-wiley:01407791:media:pce14070:pce14070-math-0038(15b)
where Jatp in the numerator is the total ATP production rate from chloroplastic electron transport (which is not expressed in J like Equation (15a), given the uncertainties discussed earlier in Extension 2). The denominator in Equation (15b) can also be obtained by summing up all the ATP requirements indicated in Figure 3.

Traditionally, the proportion of glycolate carbon that does not return to chloroplasts (α) is relevant only for the TPU-limited carboxylation rate Wp (see Equations (7a) and (7b)). Equations (15a) and (15b) suggest that the proportion parameters (αG, αT and αS) affect not only Wp but also Wj. The export of carbon as CH2-THF always increases Wj. Glycine and serine export associated with de novo N assimilation decreases Wj in terms of NADPH requirement whereas it increases Wj in terms of ATP requirement. This suggests that photorespiration-associated N assimilation can help alleviate the deficit of ATP relative to NADPH (see earlier discussions).

In the case of glycine being diverted from the photorespiratory pathway, the amount of CO2 released per oxygenation should be decreased by αG (Busch et al., 2018). In contrast, as shown in Figure 3, every carbon exported as CH2-THF from the pathway results in one carbon lost from glycine decarboxylation (Busch, 2020). Therefore, it is necessary to revise Equation (1) to:
urn:x-wiley:01407791:media:pce14070:pce14070-math-0039(16a)
And Equation (6a) becomes:
urn:x-wiley:01407791:media:pce14070:pce14070-math-0040(16b)
where Γ *GT = [0.5(1 − αG) + αT]O/Sc/o, or Γ*GT = (1 − αG + 2αT)Γ*. It follows that the CO2 compensation point in the absence of day respiration is no longer constant at given temperature and O2 partial pressure, but decreases with increasing the fraction of glycine and increases with increasing the fraction of CH2-THF diverted from the photorespiratory pathway. Therefore, equations for the net CO2-assimilation rate corresponding to the three limitations become:
urn:x-wiley:01407791:media:pce14070:pce14070-math-0041(16c)
urn:x-wiley:01407791:media:pce14070:pce14070-math-0042(16d)
urn:x-wiley:01407791:media:pce14070:pce14070-math-0043(16e)
Applying quantitative isotopic techniques to sunflower leaves, Abadie, Boex-Fontvieille, Carroll, and Tcherkez (2016) showed that the stoichiometric ratio of O2 fixation by Rubisco to CO2 production by GDC increased from 2.0 (the theoretical value used in the canonical FvCB model) at very low-photorespiration gas mixtures, to 2.05 for the normal ambient condition, and to 2.09 to high-photorespiration gas mixtures. As the export of carbon in the form of CH2-THF would make this ratio lower than 2.0, the observed ratio being ≥2.0 suggests that the export of carbon from the photorespiratory pathway via this form may be less important than the export via glycine. If the value of >2.0 is due to glycine export alone, then αG can be estimated to be 0.0 for the conditions with little photorespiration, 0.024 for the ambient condition, and a maximum value of 0.043 for the conditions of high-photorespiration gas mixture. Using modelling to fit Equations (16c)–(16e) to ACi curves, Busch et al. (2018) estimated αG of the ambient condition to be 0.026 for plants fed with NH4+-N, 0.103 for plants fed with NO3-N, and 0.077 for control plants. These all indicate that αG is not zero as implicitly assumed in the canonical FvCB model. This means that even under Rubisco limitation where Wc is not changed by any amino acid export, A could still be increased due to a slight decrease in the CO2-compensation point if glycine is removed from the photorespiratory pathway (see Equation (16c)). Under the TPU limitation where carbon uptake is limited by the rate at which carbohydrates can be metabolized, A could be further increased by short-circuiting carbon flux to glycine, serine, and CH2-THF via the photorespiratory pathway (Figure 4). Only the NADPH-dependent electron transport-limited rate is decreased due to the electron consumption by the de novo nitrogen assimilation (if the potential electron transport rate J remains the same; but see later discussion).

In addition to exploring the ratio of O2 fixation by Rubisco to CO2 production by GDC to estimate αG, Busch et al. (2018) showed that αG and αS could be roughly estimated from model fitting to A–Ci curves. There is currently no information available about the possible value for the fraction of glycolate carbon diverted via the C1 metabolism (Busch, 2020). Therefore, hereafter we mainly discuss the relations with regard to the amino-acid exports.

4.2 Relationships with the previous two extensions

It is clear, based on the model of Busch et al. (2018), that the parameter α in the model of Harley and Sharkey (1991) deals with the carbon side of the amino acid export but not the electron requirement for NO3 assimilation. In addition, the energy associated with the changed RuBP regeneration and NH4+-recycling as a result of amino acid export was not considered in Harley & Sharkey's model. Also, the decrease of CO2-compensation point in the absence of Rd as a result of the glycine exit is not explicitly included in the model although this was discussed by Harley and Sharkey (1991). Busch et al. (2018) treated amino acid exit from the photorespiratory pathway differently, depending on whether it is glycine or serine that is exited, whereas Harley and Sharkey (1991) only assumed the glycine exit. It is clear from Equation (16e) that if it is only glycine that exits, the model under a TPU-limitation is:
urn:x-wiley:01407791:media:pce14070:pce14070-math-0044(17a)
If the CO2-compensation point is to be maintained as in the canonical FvCB model, it would be internally consistent to assume that it is only serine, instead of glycine, being exported. Then, based on Equation (16e), the model for A under a TPU-limitation should become:
urn:x-wiley:01407791:media:pce14070:pce14070-math-0045(17b)
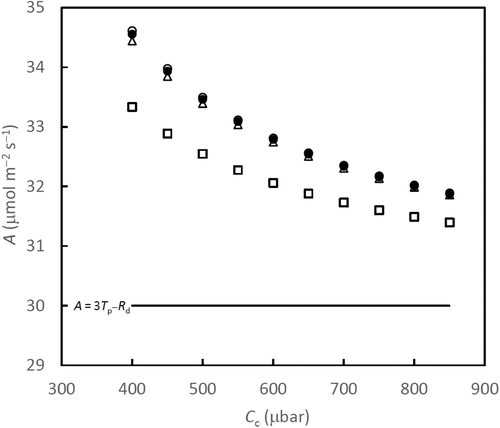
with the bound that 0 ≤ αS ≤ 0.75. This model is supported by the above calculation that αG was maximally only 0.043 based on isotopic measurements of Abadie et al. (2016) as well as by the modelling result of Busch et al. (2018) and measurements of Abadie, Bathellier, and Tcherkez (2018) that αS was often much higher than αG, reflecting high demands for serine due to its important role in the one-carbon metabolism and as precursor for several other amino acids and phospholipids (Ros et al., 2014). Previous parameterization of Equation (7b) from fitting to ACi curves with a moderate reverse sensitivity to Ci increases showed that the estimated α was as high as 0.77 (Busch et al., 2018), partly being the artefact of ignoring the decrease of CO2-compensation point by Equation (7b), thereby exaggerating the actual fraction of glycolate carbon not returned to the chloroplast. This fraction would decrease by 25% if Equation (17b) is used. In fact, using the same total fraction of glycolate carbon not returned to the chloroplast, Equations (17a) and (17b) generates nearly identical curves as the full TPU-limitation model Equation (16e) without the αT terms (Figure 4), whereas Equation (7b) generates much lower values. As Figure 4 demonstrates, there is little signal to differentiate αG and αS by conventional gas exchange (McClain & Sharkey, 2019), but only the sum of the two can be reliably estimated. Therefore, if αG and αS are to be estimated one cannot rely on Equation (16e) alone, but needs to consider at the very minimum the full range of ACi response fitted with Equation (16b) and include measurements of the compensation point, which is affected by αG but not by αS.
Details are in the caption following the image
ACc curves within the range of TPU limitation, generated by Equation (16e) (with αT assumed to be zero) assuming both glycine and serine exit with αG = 0.1 and αS = 0.2 (filled circles), by Equation (17a) assuming only glycine exit with αG = 0.3 (open triangles), by Equation (17b) assuming only serine exit with αS = 0.3 (open circles; but note that “open circles” are largely invisible because most of them overlap “filled circles”), and by Equation (7b) with α = 0.3 (open squares). Other parameter values for this illustration: Tp = 10 μmol m−2 s−1, Γ* = 40 μbar, and Rd = 0 μmol m−2 s−1. Not shown is that if the model Equation (17a) or Equation (17b) is used to fit the curve of the filled circles, the obtained αG or αS was 0.305 or 0.298, respectively (both still ca 0.3) while maintaining Tp the same. If Equation (7b) is used to fit the curve of the filled circles, the obtained α was 0.397 with the same Tp, suggesting Equation (7b) over-estimates the fraction of glycolate carbon not returned to the chloroplast by a factor of 4/3, which is due to not accounting for that exported glycine does not contribute to the 1 in 4 carbons lost by photorespiration. Gaps between points and the line suggest increases of A by amino acid exits
It is also possible to connect the model of Busch et al. (2018) with the model of Yin et al. (2004). As stated earlier, parameter fpseudo in the model of Yin et al. (2004) can largely reflect the proportion of electrons for supporting nitrogen assimilation, especially under electron transport-limited conditions. Thus, one can equate Equation (16d) without the αT terms to Aj formulated from Equation (9a):
urn:x-wiley:01407791:media:pce14070:pce14070-math-0046(18a)
Note that J on the left side of the equation must be equal to J2 on the right side, as they both represent the rate of whole-chain electron transport in support of the Calvin–Benson cycle, the photorespiratory pathway and nitrogen assimilation (in this context, J in the model of Busch et al., 2018 actually differs from J in the canonical FvCB model). Solving for fpseudo gives:
urn:x-wiley:01407791:media:pce14070:pce14070-math-0047(18b)
As stated earlier, fcyc for C3 photosynthesis is negligible (set to nil here). The modelling by Busch et al. (2018) showed that for the ambient-air condition, αG was ca 0.10 and αS was ca 0.15 for plants fed with NO3-N. Assuming ϕ = 0.3 for the ambient condition, then 0.058 for fpseudo can be calculated from Equation (18b). This value would become even lower if there are small amounts of CET. For nonphotorespiratory conditions (ϕ = 0), Equation (18b) gives that fpseudo = 0.

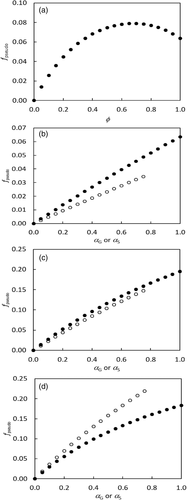
Equation (18b) also reveals that surprisingly fpseudo does not increase monotonically with increasing ϕ if ϕ goes to a very high value (Figure 5a). The decline of fpseudo beyond a threshold ϕ occurs only in the presence of αG; and the higher is αG, the lower is the threshold ϕ. However, fpseudo always increases monotonically with increasing ϕ in the absence of αG, regardless of values of αS. All these responses are because αG, not αS, causes a decrease in CO2-compensation point, and this positive impact on A becomes increasingly important under high photorespiratory states (high ϕ values) that mathematically require a low fpseudo to enable the left and right sides of Equation (18a) in balance. For the same reason, although fpseudo generally increases with increasing αG or αS, its response to αG is stronger than to αS at a low ϕ (Figure 5b), is comparable at an intermediate ϕ corresponding to ambient-air conditions (Figure 5c), and is weaker than to αS at a high ϕ (Figure 5d).
Details are in the caption following the image
Equation (18b) calculated fraction of the total PSI electron flux as pseudocyclic electron transport (fpseudo) for supporting nitrogen assimilation associated with the photorespiratory pathway (assuming a negligible cyclic electron transport), (a) as a function of the oxygenation to carboxylation ratio ϕ when αG (fraction of glycolate carbon leaving the pathway as glycine) = 0.1 and αS (fraction of glycolate carbon leaving the pathway as serine) = 0.15, and (b–d) as a function of αG when αS is set to 0 (filled symbols) or of αS when αG is set to 0 (open symbols) when ϕ is fixed at 0.05, 0.30 and 0.60, respectively

It is noteworthy that fpseudo calculated from Equation (18b) refers to the electron fraction responsible for supporting N assimilation only as result of amino acid export from the photorespiratory pathway. Therefore, the calculated fpseudo depends on the amount of photorespiration as shown in Figure 5. In contrast, fpseudo as one parameter in the model of Yin et al. (2004) for electron-transport-limited conditions lumps electron requirements for: (i) N assimilation of both via the photorespiratory pathway and not via this pathway and (ii) metabolic processes other than N assimilation that utilize chloroplastic electrons. As stated earlier, fpseudo of ca 0.10 was estimated from the assimilatory quotient for nonphotorespiratory conditions. The higher fpseudo estimated from the assimilatory quotient suggests that either not all nitrogen is assimilated via the photorespiratory pathway or/and processes other than N assimilation consumes chloroplastic electrons. Furthermore, the model of Busch et al. (2018) only applies to the case where it is NO3-N that enters the leaf. However, it cannot be ruled out that nitrogen enters the leaf in the form of NH4+-N (Eichelmann, Oja, Peterson, & Laisk, 2011), and for such a case the stoichiometric coefficients of Equation (15a) has to be re-formulated whereas the model of Yin et al. (2004) remains the same but with a lower value of fpseudo.

5 COUPLING WITH THE MESOPHYLL CO2-DIFFUSION MODEL

While Ci (intercellular CO2 partial pressure) was used in the FvCB model at the time when this model was initially published, it is increasingly recognized that Cc should be used because the resistance of CO2 diffusion from intercellular-air spaces (IAS) to the chloroplast stroma of mesophyll cells cannot be ignored. This resistance is called mesophyll resistance (rm), while its inverse is called mesophyll conductance (gm), and has long been defined as such that the Ci-to-Cc gradient can be expressed (von Caemmerer & Evans, 1991):
urn:x-wiley:01407791:media:pce14070:pce14070-math-0048(19a)
Because A is the difference between carboxylation rate (Vc) and the rate of CO2 release from photorespiration (F = 0.5Vo or [0.5(1 − αG) + αT]Vo) and respiration (Rd), Equation (19a) implicitly assumes that the CO2 coming from IAS and the CO2 released from (photo)respiration experience the same resistance rm. To diffuse to Rubisco, the CO2 coming from IAS has to experience the resistance across mesophyll cell wall and plasma membrane (rwp) as well as the resistance across the chloroplast envelope and inside the chloroplast stroma (rch). In contrast, the (photo)respiratory CO2 first enters the cytosol after being released by the mitochondria and therefore, if to be re-fixed by Rubisco, may experience rch only. For this reason, Tholen, Ethier, Genty, Pepin, and Zhu (2012) presented a resistance model that explicitly differentiates the resistances faced by the two different sources of CO2:
urn:x-wiley:01407791:media:pce14070:pce14070-math-0049(19b)
where rm = rwp + rch. If the chloroplast resistance is negligible (rch → 0), then Equation (19b) becomes Equation (19a). Clearly, the earlier model, Equation (19a), also assumes that the chloroplast resistance is negligible so that only rwp forms the mesophyll resistance as if RuBP carboxylation and (photo)respiratory CO2 production occur in the same compartment.
Equations (19a) and (19b) have been considered as two basic scenarios for CO2 diffusion path in C3 leaves (von Caemmerer, 2013). However, the delivery of CO2 to Rubisco depends not only on simple physical resistance components but also on the intracellular arrangement of organelles that consume and produce CO2. Yin and Struik (2017b) considered six scenarios of the arrangement of mitochondria and chloroplasts, and came up with a generic model:
urn:x-wiley:01407791:media:pce14070:pce14070-math-0050(19c)
where λ is the fraction of mitochondria that locate closely behind chloroplasts in the inner cytosol (i.e., the area between chloroplasts and vacuole; then 1 − λ is the fraction of mitochondria that locate in the outer cytosol, the area between the plasma membrane and chloroplasts), and k is a factor allowing the fraction of (photo)respiratory CO2 in the inner cytosol dependent not only on λ but also on chloroplast gaps and the cytosol resistance. So, the term can be regarded as the fraction of (photo)respiratory CO2 in the inner cytosol. If  = 1, Equation (19c) becomes Equation (19a), meaning that Equation (19a) also implicitly assumes that mitochondria exclusively lie behind chloroplasts that form a continuum without a gap as observed for rice (Sage & Sage, 2009). If  = 0, Equation (19c) becomes Equation (19b), meaning that Equation (19b) applies to the case where mitochondria exclusively lie in the outer cytosol (λ = 0) with chloroplasts that form a continuum without a gap (k = 1) or to the case where there are chloroplast gaps but little cytosol resistance (k = 0), and thus photorespiratory CO2 anywhere in the cytosol is completely mixed, independent of where the mitochondria are located. Equations (19a) and (19b) represent two extremes, and the reality should be somewhere in-between (0 <  < 1). Equation (19c) can be further simplified to:
urn:x-wiley:01407791:media:pce14070:pce14070-math-0051(19d)
where parameter m lumps several parameters: m = (1 − λk)rch/rm and 0 ≤ m ≤ 1 (also see Ubierna et al., 2019).
Combining the above forms of equations for rm or gm with the (extended) FvCB model and solving for A can lead to an expression that models A as a function of Ci (Ethier & Livingston, 2004; von Caemmerer, 2013; von Caemmerer, Evans, Hudson, & Andrews, 1994; Yin & Struik, 2017b). Here, based on the model of Yin, van der Putten, Belay, and Struik (2020), we present a form that covers all possibilities:
urn:x-wiley:01407791:media:pce14070:pce14070-math-0052(20)
where
urn:x-wiley:01407791:media:pce14070:pce14070-math-0053
urn:x-wiley:01407791:media:pce14070:pce14070-math-0054
urn:x-wiley:01407791:media:pce14070:pce14070-math-0055
urn:x-wiley:01407791:media:pce14070:pce14070-math-0056
and
urn:x-wiley:01407791:media:pce14070:pce14070-math-0057
urn:x-wiley:01407791:media:pce14070:pce14070-math-0058
Whether or not gm is variable is still under debate (Evans, 2021); in particular, Gu and Sun (2014) showed that the variable gm pattern could be an artefactual response to uncertainties in measurements or in estimating parameters of the FvCB model. But Equation (20) suits for either a constant or a variable gm mode. Setting δ = 0 would make Equation (20) appropriate the constant gm mode (= gmo of Equation (20)). Setting gmo = 0, then a positive value of δ, which defines the carboxylation resistance: mesophyll resistance ratio (Yin et al., 2020), allows the possibility that gm is variable, responding to Ci, irradiance, temperature, and O2 as reported by, for example, Bernacchi, Portis, Nakano, von Caemmerer, and Long (2002), Flexas et al. (2007) and Yin et al. (2020). In Equation (20), Γ*GT is used in several places, instead of the usual Γ*, to account for the earlier discussed possible change in CO2 compensation point due to the carbon exit via glycine and CH2-THF from the photorespiratory pathway. It is worthy to note that while the complete form of the equations for x2 in case of the Wj-limitation is given, usually only x2 = 2Γ* is applied, especially if the model is used to estimate gm.

The solution to Equation (20) in case of Wc or Wj limitations is straightforward (the urn:x-wiley:01407791:media:pce14070:pce14070-math-0059 term always taking the − sign). Gu, Pallardy, Tu, Law, and Wullschleger (2010) highlighted the mathematical complication arisen from a negative x2 in the case that Wp limits if the fraction of glycolate carbon not returned to chloroplasts is >0 and suggested a solution to that.

The coupled gm-FvCB model offers a method to estimate gm (and other parameters) by fitting to gas exchange data only from exploring the curvature of ACi curves (Ethier & Livingston, 2004). When the coupled model is fitted to combined gas exchange and chlorophyll fluorescence data (Yin & Struik, 2009), it can improve the reliability of the estimates compared with the value of gm calculated from the conventional variable J method of Harley, Loreto, Di Marco, and Sharkey (1992). An alternative is using the stable 13C-isotope discrimination method (Farquhar et al., 1982), which was applied by Evans, Sharkey, Berry, and Farquhar (1986); Evans, von Caemmerer, Setchell, and Hudson (1994) to estimate gm (see review by Pons et al., 2009, and the most current model by Busch et al., 2020). But the chlorophyll fluorescence-based methods are more widely used because of the wider availability of the required device, despite the limitations (Evans, 2021). To minimize the influence of these limitations and of basal alternative transport pathways on estimating gm, van der Putten, Yin, and Struik (2018) demonstrated the importance of calibration using the measurements under nonphotorespiratory conditions. Any calibration method assumes that the fractions for alternative electron pathways are constant between photorespiratory and nonphotorespiratory conditions. However, recent reports by Abadie et al. (2016, 2018), Abadie and Tcherkez (2019) and Tcherkez and Limami (2019) suggest that the values of αG and αS, as well as the percentage of phosphoenolpyruvate (PEP) carboxylation and malate production (if any), and N-assimilation relative to CO2-assimilation may not be constant across various CO2/O2 gas mixtures. Chlorophyll-fluorescence-based methods to estimate gm require data that include the measurements under photorespiratory conditions such as at ambient CO2/O2 levels (Yin et al., 2020), whereas the 13C isotopic method has no such a requirement. On the other hand, estimates of gm by the 13C isotopic method are affected by assumptions made regarding the values of the fractionation factors (Busch et al., 2020; Gu & Sun, 2014; Pons et al., 2009). Thus, chlorophyll-fluorescence and 13C isotopic methods should be compared, whenever possible, for estimating gm.

As the chlorophyll-fluorescence-based method relies on the coupled gm-FvCB model and the re-assimilation of photorespired CO2 to estimate gm, this coupled model should account for the amount of (photo)respired CO2 that are re-assimilated by Rubisco. For example, let us assume two hypothetical leaves where all parameters are the same except Rd which is nil for one leaf versus 3 μmol m−2 s−1 for the other. One would expect from the Cc-based model, for example, Equations (16c)–(16e), that A also differs by 3 μmol m−2 s−1 between the two leaves. However, the calculation using the coupled model shows that the difference in A was smaller than the difference in Rd of 3 μmol m−2 s−1 (Figure 6a) because part of CO2 released by day respiration in the second leaf is re-assimilated by Rubisco, demonstrating that the refixation is implicitly accounted for by the coupled model. The lower is gm, the harder it is for the (photo)respired CO2 to escape, and the higher is the proportion of refixation (Figure 6a). The calculated refixation proportion varies little with the assumed Rd values of the two leaves. In fact, the fraction of (photo)respired CO2 being refixed (frefix) can be calculated directly using the resistance components (Tholen et al., 2012). They proposed an equation for the scenario which Equation (19b) represents. Yin and Struik (2017b) extended the approach to a general equation:
urn:x-wiley:01407791:media:pce14070:pce14070-math-0060(21a)
where rsc is the stomatal resistance to CO2 diffusion, and rcx is the resistance from the carboxylation reaction itself, which can be defined as: (Cc + x2)/x1 (von Caemmerer, 2000, 2013) and was similarly as high as rm (=rwp + rch) in rice leaves and ca 40% higher than rm in tomato leaves (Yin et al., 2020). If λk = 1, Equation (21a) is simplified to:
urn:x-wiley:01407791:media:pce14070:pce14070-math-0061(21b)
If λk = 0, Equation (21a) becomes Equation (14) of Tholen et al. (2012):
urn:x-wiley:01407791:media:pce14070:pce14070-math-0062(21c)
It becomes obvious from Equations (21b) and (21c) that leaves having the anatomical structure close to what Equation (19a) describes have a higher frefix than leaves having the structure that Equation (19b) describes, and this difference in frefix leads to different CO2 compensation points (von Caemmerer, 2013; Yin & Struik, 2017b). As rsc and rcx vary in response to CO2, irradiance and other environmental conditions, it follows that the proportion of (photo)respired CO2 being refixed varies with these variables. For example, with an increase of CO2, rcx [=(Cc + x2)/x1)] will increase, and Equations (21b) and (21c) will predict a decrease of frefix, in line with the expectation that refixation contributes decreasingly to total assimilation with increasing CO2 (Busch, Sage, Cousins, & Sage, 2013). This appears to agree with the result in Figure 6a that with increasing Ci, calculated differences in A approach to the preset difference in Rd.
Details are in the caption following the image
(a) The calculated difference in net photosynthesis A, using the coupled gm-FvCB model, Equation (20), for two hypothetical leaves whose day respiration (Rd) is preset as 0 μmol m−2 s−1 (Rd1) and 3 μmol m−2 s−1 (Rd2), respectively. The difference in Rd of the two leaves is indicated by the horizontal line. The calculation used the algorithm assuming an electron transport limitation for the simplest situation of Equation (20), that is, αG = αS = αT = 0, m = 0, δ = 0 (for the constant gm scenario). The values used for gm were 0.25 (filled symbols) or 0.15 (open symbols) mol m−2 s−1 bar−1. (b) The calculated fractions of refixation within the mesophyll cell (frefix,cell) using Equation (21b) without the term rsc (open symbols) or using the formula that frefix,cell = 1 − [A(Rd1) − A(Rd2)]/(Rd2 − Rd1) (filled symbols). The calculation in (b) assumed that gm = 0.25 mol m−2 s−1 bar−1. Other parameter values used for both panels (a) and (b): J = 150 μmol m−2 s−1, and Γ* = 40 μbar [Colour figure can be viewed at wileyonlinelibrary.com]

Refixation can occur both within the mesophyll cell (frefix,cell) and via the IAS (frefix,ias), which together constitute the total refixation (frefix = frefix,cell + frefix,ias) (Busch et al., 2013). In fact, the refixation of Rd illustrated in the above example using the coupled model with Ci as input (Figure 6a) actually refers to frefix,cell. frefix,cell and frefix,ias can also be directly calculated from resistance components and Yin et al. (2020) showed that if the term rsc is removed, Equations (21a)–(21c) become equivalent equations to calculate frefix,cell. They showed that frefix,cell generally dominates and leaves having the anatomical structure that Equation (19a) describes have a higher frefix,cell and thus a higher frefix than leaves having the structure that Equation (19b) describes despite the latter leaves having a higher frefix,ias. They quantitatively showed that for rice leaves where λk = 1, the estimated frefix was often high (≥0.5). These ideas of refixation have been exploited by synthetic biology approaches that engineer photorespiratory bypasses to relocate the photorespiratory CO2 release from mitochondria to chloroplasts (Kebeish et al., 2007; Shen et al., 2019; South, Cavanagh, Liu, & Ort, 2019; Figure 1a). The bypasses may be effective in increasing CO2 assimilation for leaves described by Equation (19b) under low CO2 conditions. However, values calculated based on resistance components represent the gross refixation of (photo)respired CO2, which is higher than the refixation reflected by results of the coupled model (Figure 6b). This suggests (photo)respired CO2 or bypassed CO2 decrease the chance of CO2 coming from IAS being assimilated; so, the net benefit of refixation must be smaller than what Equations (21a)–(21c) predict. But the bypass-associated saving of electrons and ATP that otherwise are consumed by the ammonia recycling (Figure 1a) provides more advantages (von Caemmerer, 2013).

6 THE C4 FORM OF THE MODEL

CO2 diffusion is also important for C4 photosynthesis because its CO2-concentrating mechanism (CCM) relies on the effective coordination of a series of diffusional processes and biochemical reactions. In the vast majority of terrestrial C4 species, this mechanism is achieved through the coordinated functioning via the Kranz structure involving mesophyll (M) and bundle-sheath (BS) cells (Hatch, 1987). CO2 initially diffuses to the M cytosol and is converted to HCO3, which is fixed by PEP carboxylase (PEPc) into C4 acids. The C4 acids travel to the BS cells, where they are decarboxylated and the released CO2 is re-fixed by Rubisco exclusively localized in BS chloroplasts. The Km of PEPc is lower, and its maximum carboxylation rate is generally higher, than that of Rubisco. This will elevate the CO2 partial pressure in the BS compartment, despite some leakage of CO2 from BS back to M cells, which effectively suppresses photorespiration. Because Rubisco is operated in high-CO2 compartments, kinetic constants of C4 Rubisco differ from those of C3 Rubisco (Boyd, Gandin, & Cousins, 2015; Cousins, Ghannoum, von Caemmerer, & Badger, 2010; Sharwood, Ghannoum, Kapralov, Gunn, & Whitney, 2016), which together with the CCM per se, underlies the high photosynthetic nitrogen use efficiency of C4 plants (Ghannoum et al., 2005). C4 species are traditionally classified into three subtypes according to the decarboxylation enzymes, thus also decarboxylation sites: NADP-malic enzyme (ME) in chloroplasts, NAD-ME in mitochondria, and PEP-carboxykinase (CK) in the cytosol (Hatch, 1987). However, more recent opinions (e.g., Furbank, 2011; Wang, Brautigam, Weber, & Zhu, 2014; Yin & Struik, 2018) suggest that C4 species often have a mixed decarboxylation pathway, where one enzyme acts as the main decarboxylating enzyme alongside the others.

6.1 The standard model for C4 photosynthesis

Berry and Farquhar (1978) presented a first model for C4 photosynthesis, which covered the CCM and the basis of high nitrogen use efficiency. The leakiness (ϕL) as the ratio of the CO2 retro-leakage (L) to the rate of PEP carboxylation (Vp), was introduced in a model that included carbon isotope discrimination (Farquhar, 1983). Based on these earlier models, von Caemmerer and Furbank (1999) described a model, which is now considered as the standard C4 model that predicts net CO2-assimilation rate (A) as a function of mesophyll cytosol CO2 partial pressure (Cm). Several equations relevant to the C4 photosynthesis are:
urn:x-wiley:01407791:media:pce14070:pce14070-math-0063(22a)
urn:x-wiley:01407791:media:pce14070:pce14070-math-0064(22b)
urn:x-wiley:01407791:media:pce14070:pce14070-math-0065(22c)
urn:x-wiley:01407791:media:pce14070:pce14070-math-0066(22d)
where Rm is the respiration in the M cell (usually assumed to be 0.5Rd), gbs is bundle-sheath conductance, Cc and Oc are the partial pressure of CO2 and O2 at the active sites of Rubisco, respectively, αbs is the fraction of O2 evolution (or of PSII) in the BS cells, uoc is the coefficient that lumps diffusivities of O2 and CO2 in water and their respective Henry constants, Om is the partial pressure of O2 at the mesophyll cytosol, Kp and Vpmax are the Michaelis–Menten constant and the maximum carboxylation rate of PEPc, respectively, x is the fraction of ATP consumed by the CCM cycle, φ is the mol chloroplastic ATP required for the CCM cycle, and Jatp is the rate of ATP production by chloroplastic electron transport. The original model of von Caemmerer and Furbank (1999) did not use Jatp, but the rate of electron transport (J). Because it is ATP, not electrons, that are allocated between the CCM cycle and the Calvin–Benson cycle, according to the predefined stoichiometric fraction x, it is more appropriate to use Jatp in Equation (22d) (Yin et al., 2011) and Jatp can be linked with electron transport rate via the ATP production factor z (see Equation (9e)). Equation (22d) for Vp contains either the PEPc activity-limited rate or the electron transport-limited rate, in analogy to the equations for Vc. The rate of CO2-assimilation (A) based on Vc is the same for C3 photosynthesis and can be collectively expressed as:
urn:x-wiley:01407791:media:pce14070:pce14070-math-0067(22e)
where γ* = 0.5/Sc/o, and x1 = Vcmax, x2 = KmC/KmO, and x3 = KmC for the Rubisco-limited rate. For the RuBP regeneration-limited rate, x1 = (1 − x)Jatp/3, x2 = 7γ*/3, and x3 = 0 if ATP supply is limiting. von Caemmerer and Furbank (1999) provided a solution to the combined Equations (22a)–(22e) that expresses A as a quadratic function of Cm. As Cm is unknown generally, one may add an equation (Cm = Ci − A/gm) in order to express A as a function of Ci. Yin et al. (2011) provided the analytical solution to these, which became cubic if PEPc activity limits Vp.

Unlike in C3 leaves, the initial carbon fixation in C4 leaves is catalysed by PEPc in the cytosol and therefore gm does not involve CO2 diffusion from the cytosol to the chloroplast. Accordingly, estimates of gm in C4 leaves are somewhat higher than those in C3 leaves (e.g. Barbour, Evans, Simonin, & von Caemmerer, 2016), meaning gm appears to be less limiting to C4 photosynthesis as it is to C3 photosynthesis. However, gbs, which determines the amount of CO2 leakage (see Equation (22b)), is fundamentally important for the CCM, and thus, for determining C4 photosynthesis. So far there is no method that can directly estimate gbs. Its indirect estimate, mostly based on model fitting to gas exchange data (He & Edwards, 1996) and sometimes combined with chlorophyll fluorescence or 13C discrimination measurements, suggests a value between 1.0 and 10.0 mmol m−2 s−1 bar-1 (Yin et al., 2011), ca two- or three-order of magnitude smaller than gm. Like gm, gbs varies with leaf age or N content (Yin et al., 2011), temperature (Alonso-Cantabrana et al., 2018; Kiirats, Lea, Franceschi, & Edwards, 2002; Yin, van der Putten, Driever, & Struik, 2016), and growth light conditions (Bellasio & Griffiths, 2014; Kromdijk, Griffiths, & Schepers, 2010; Ubierna, Sun, Kramer, & Cousins, 2013). Danila et al. (2021) showed that suberization of the BS lamellae is required for a low gbs to minimize leakage. As gbs is a lumped model parameter, its value may also depend on other anatomical characteristics (like BS cell wall thickness, plasmodesmata density, bundle sheath surface area-to-leaf area ratio, intervein spacing, sheath layers) as well as biochemical characteristics (like the location of decarboxylation). Further research is needed to clarify how these characteristics influence gbs.

6.2 Energetic aspects of C4 photosynthesis

Although energy production or consumption can be cell-type specific (Yin & Struik, 2018, 2021), the model of von Caemmerer and Furbank (1999) for C4 photosynthesis assumed that energy is shared between M and BS cells, and used x to allocate Jatp to the CCM cycle (see Equation (22d)) and thus, 1 − x to the Calvin–Benson cycle (see Equation (22e)). The default value for x is 0.4, arising from φ/(φ + 3), where φ and 3 are ATP required for the CCM cycle and the Calvin–Benson cycle, respectively. For most C4 species, φ = 2; so x = 0.4 (von Caemmerer & Furbank, 1999; but see discussion later). Thus, the RuBP regeneration-limited form of Equation (22e) is expressed in terms of ATP supply. As with the C3 model, it is metabolically important to keep ATP and NADPH in balance (Foyer et al., 2012; Kramer & Evans, 2011); so, one may argue that ATP and NADPH co-determine the RuBP regeneration. For Equation (22e) if NADPH supply is limiting, one can write, according to Equation (9a), that x1 = [1 − fpseudo/(1 − fcyc)]J2/4, x2 = 2γ*, and x3 = 0. Based on this NADPH-determined model, Yin and Struik (2012) stated that the photosynthetic quantum yield models for C4 photosynthesis are the same as for C3 photosynthesis, that is, Equation (12a) or Equation (12e), reflecting that there is no net NADPH requirement for the C4 cycle (but again, see discussion later). Similarly, Equations (13a), (13b) and (10b) for calculating fcyc, fpseudo and ρ2, respectively, also suit for C4 photosynthesis.

As discussed earlier for C3 photosynthesis, one can rely on the unique feature of the NADPH-dependent equation for quantum yield to infer possible values of fcyc from measurements on quantum yields. ΦO2LL of C4 photosynthesis (virtually without photorespiration) is ca 0.069 (Björkman & Demmig1987), considerably lower than its counterpart value of C3 photosynthesis in the absence of photorespiration. Using Equation (13a), Yin and Struik (2012) solved fcyc, which was ca 0.45, considerably higher than the fcyc of C3 photosynthesis. This suggests that CET is essential for C4 photosynthesis, required for generating ATP required for the operation of the CCM cycle.

Once fcyc is known, ρ2 can be calculated from Equation (10b). The obtained ρ2 is ca 0.4 (Yin & Struik, 2012). This differs from Equation (4), where the energy partitioning factor of 0.5 is also used for C4 photosynthesis (von Caemmerer, 2000, 2013; von Caemmerer & Furbank, 1999). When fcyc is known, fpseudo can also be estimated from the assimilatory quotient (see Equation (13b)) and is ca 0.07 (Yin & Struik, 2012).

The equation equivalent to Equation (8) for C3 photosynthesis, for the fraction of LET that keeps NADPH and ATP balance as required by C4 metabolism, can be formulated as (see Yin & Struik, 2012 for its derivation):
urn:x-wiley:01407791:media:pce14070:pce14070-math-0068(23a)
where ϕL is leakiness (0 ≤ ϕL ≤ 1). Compared with Equation (8), Equation (23a) has an extra factor (1 − x)/(1 + L). This suggests that compared with C3 photosynthesis, the LET of C4 photosynthesis is decreased at least by this factor to accommodate the required increase in CET. One can solve Equation (23a) for leakiness:
urn:x-wiley:01407791:media:pce14070:pce14070-math-0069(23b)
Given the above indicative values of fcyc and fpseudo based on quantum yield data, one can use Equation (23b) to explore likely values of uncertain parameters fQ and h that can give a realistic estimate of leakiness. Using either obligatory or no operation of the Q cycle (fQ = 1 or 0) and three likely values of h (3, 4 and 4.67, see earlier), Yin and Struik (2012) showed that only the combination that fQ = 1 and h = 4 can give a realistic value of ϕL (Figure 7). The obligatory Q cycle has long been recognized for C4 photosynthesis (Furbank, Jenkins, & Hatch, 1990). But whether the H+:ATP ratio (h) is 3, 4 or 4.67 is uncertain. The model results shown in Figure 7 support thermodynamic experiments (Petersen et al., 2012; Steigmiller et al., 2008) showing that h is 4.
Details are in the caption following the image
The CO2 leakiness ϕL calculated by Equation (23b) as a function of oxygenation to carboxylation ratio (Vo:Vc), using different values for the H+:ATP ratio (h) combined either with or without the Q cycle (fQ). The results without the Q cycle (fQ = 0) combined with h = 4 or 4.67 are not shown because these combinations gave very negative estimates of leakiness (redrawn with permission from Yin & Struik, 2012). The scenario for possible involvement of the NAD(P)H dehydrogenase-dependent pathway (fNDH) in the cyclic electron transport is not given in this figure, but see the discussion in the text
The model discussed so far, for both C3 and C4 photosynthesis, assumes that CET, when combined with the Q cycle, generates two H+ per electron (Figure 2). However, CET may follow the NAD(P)H dehydrogenase (NDH)-dependent pathway (Ishikawa et al., 2016; Strand, Fisher, & Kramer, 2017; Yamori, Sakata, Suzuki, Shikanai, & Makino, 2011). When this pathway is operating, CET generates four H+ per electron and Kramer and Evans (2011) indicated that very likely this pathway is active in C4 plants. Let fNDH be the fraction of CET that follows the NDH-dependent pathway. Then, the ATP production factor z as in Equation (9e) for such a case is (Yin & Struik, 2021):
urn:x-wiley:01407791:media:pce14070:pce14070-math-0070(24a)
Equation (24a) becomes Equation (9e) if fNDH = 0. Again, the uncertainty with regard to the value of fNDH has no impact on the model for the NADPH-dependent quantum yield, so the above estimation of fcyc using the NADPH-dependent quantum yield model is still valid. Yin and Struik (2012) showed that this highly efficient H+-translocating pathway of CET cannot be obligatory as this would result in unrealistic high estimates of leakiness. Here we try to assess the extent to which CET should be this highly efficient pathway if h is 4.67 (=14/3, Seelert et al., 2000; again recently, Hahn et al., 2018). This can be achieved by equating Equation (24a) with h = 14/3 to Equation (9e) with h = 4, and then solving for fNDH:
urn:x-wiley:01407791:media:pce14070:pce14070-math-0071(24b)
This gives that fNDH is ca 0.47 if fQ = 1 and fcyc = 0.45, meaning that about half of the total CET have to follow this highly efficient pathway in order to meet the high ATP requirement in C4 photosynthesis, if the H+ requirement per ATP synthesis is as high as 4.67. This suggests a method to estimate fNDH, as this parameter has been estimated only by trial and error (Bellasio & Farquhar, 2019).

Combining h = 4 and fNDH = 0 or h = 4.67 and fNDH = 0.47 suggests that the ATP production factor per PSII electron transport (z) is ca 1.16. This differs from the standard C4 model of von Caemmerer and Furbank (1999), in which Jatp is set to equal PSII electron transport rate. The standard model assumes: (i) the absence of CET and (ii) and h = 3. Equation (9e) suggests that these assumptions combined with an obligatory Q cycle make z = 1.

6.3 Accommodating the C4 species mixed with PEP-CK

It is important to point out that the above results of energetics are valid only for NADP-ME or NAD-ME subtypes of C4 photosynthesis, although the standard model has been wrongly applied in some reports to the PEP-CK subtype. As stated earlier, the value of 0.4 for x stems from that the parameter φ in Equation (22d) is 2, referring to two mol ATP required per CCM cycle for regenerating PEP by pyruvate phosphate dikinase (PPDK) in the M cell (Hatch, 1987; Kanai & Edwards, 1999). This high ATP requirement is reflected in measured quantum yields in species of the malic-enzyme subtypes, from which the model derived fcyc was high (ca 0.45). In the PEP-CK subtype, however, part of the oxaloacetates produced by the initial PEP carboxylation step move to and are decarboxylated in the BS cytosol by PEP-CK (Hatch, 1987). This decarboxylation reaction also generates PEP (requiring only one molecule of ATP per reaction), thereby partly bypassing the expensive step of PEP regeneration by PPDK. The remaining oxaloacetates are reduced to malate in the M cells, which move to and are decarboxylated in BS mitochondria. This decarboxylation also releases NADH, which drives mitochondrial electron transport to provide ATP for fuelling PEP-CK possibly (Kanai & Edwards, 1999), thereby further decreasing the chloroplastic ATP requirement. Given that the pure PEP-CK type hardly exists in nature and species having PEP-CK are often mixed with other decarboxylation types (Furbank, 2011; Wang et al., 2014), Yin and Struik (2021) presented a model for the electron transport-limited rate in all C4 subtypes including their mixed types.

In this model, Equations (22a)–(22e) still apply, but with:
urn:x-wiley:01407791:media:pce14070:pce14070-math-0072(25a)
and x2 and x3 are as defined earlier (i.e., x2 = 2γ*, and x3 = 0). In Equation (25a), parameter a is the fraction of oxaloacetates that are reduced, using NADPH (equivalent to 2 electrons) from M chloroplasts, to malate moving to the BS mitochondria. To accommodate various C4 types, two further adjustments are needed. Firstly, the chloroplastic ATP requirement for the CCM cycle (φ) should be changed from 2 for the malic-enzyme subtypes to:
urn:x-wiley:01407791:media:pce14070:pce14070-math-0073(25b)
where n is the number of ATP produced per NADH oxidation from mitochondrial electron transport (n = 2.5 ~ 3.0; Taiz & Zeiger, 2002), the coefficient 1 represents one molecule ATP fewer required for per PEP regenerated by PEP-CK than by PPDK, and so, the term (n + 1)a represents ATP saved from engaging the PEP-CK mechanism, relative to the malic-enzyme mechanisms (Yin & Struik, 2021). Secondly, for the types involving PEP-CK, x for Equation (22d) is changed to:
urn:x-wiley:01407791:media:pce14070:pce14070-math-0074(25c)
These equations have taken into account the required balance of NH2-groups between M and BS cells. The analysis of Yin and Struik (2021) suggested that 0 ≤ a ≤ 0.36 ~ 0.40, and if a = 0, the model returns to the equations discussed earlier for the malic-enzyme subtypes. The model predicts that the additional cost with a mol NADPH requirement per mol CO2 assimilated is overcompensated by the decreased chloroplastic ATP requirement for the CCM cycle, thereby predicting a higher ΦCO2 in species involving the PEP-CK activity. However, the observed little advantage in ΦCO2 of the PEP-CK over the NADP-ME species (Ehleringer & Pearcy, 1983) suggests the need of more studies to understand whether the energetic advantages are cancelled out by leakiness in the PEP-CK types.

7 CONCLUSIONS AND REMARKS

The FvCB model has been proven successful in most cases in fitting response curves for predicting photosynthetic rates (e.g., Kumarathunge et al., 2019). The model extensions reviewed here are hardly meant to replace the canonical FvCB model for that, but more to provide tools for analysing uncertainties and better understanding underlying physiology of photosynthesis. From our review in this context, we can make the following summary points:
  1. Relative to the ATP-determined form, the extended NADPH-determined form for electron transport-limited rate has fewer uncertain parameters and is yet related to the fraction for CET (fcyc). This singular feature of the model allows fcyc to be first estimated from easily measured quantum yield for photosynthesis and quantum yield for photosystem electron transport. The estimated fcyc is negligible (ca 0.06) for C3 photosynthesis vs ca 0.45–0.50 for malic-enzyme subtypes of C4 photosynthesis. The NADPH-determined form also has an advantage in modelling C4 photosynthesis involving decarboxylation by PEP-CK, which requires additional NADPH, a lower ATP:NADPH ratio and probably a lower fcyc, than the malic-enzyme subtypes.
  2. Because of such a difference in fcyc, the factor for excitation partitioning to PSII (ρ2) was ca 0.5 or slightly higher for C3 photosynthesis, but ca 0.4 for malic-enzyme subtypes of C4 photosynthesis. This differs from the canonical FvCB model, where 0.5 is always set for both C3 and C4 photosynthesis models.
  3. If fcyc is known, one can also estimate fpseuso based on the assimilatory quotient (see Equation (13b)), and further infer values for uncertain parameters fQ and h in view of the ATP:NADPH ratio as required by metabolism. The most likely values are: fQ = 1 combined with h = 4 for C4 plants, and with h = 4.00 or 4.67 for C3 plants. If h is 4.67 for C4 plants, then ca 50% of CET must follow the NDH-dependent pathway in the malic-enzyme subtypes of C4 plants. The stoichiometric coefficients (fQ = 0 and h = 3) assumed in the ATP-limited form of the canonical C3 model (Equation (3b)) and of the standard C4 model are obsolete.
  4. The TPU limitation is commonly ignored in modelling C4 photosynthesis probably because it is hard to identify this limitation from its ACi curves. While the extension of the canonical FvCB model to account for this limitation to C3 photosynthesis in relation to the glycine export from the photorespiratory pathway has long been made, it appears now that assuming serine (rather than glycine) to exit from the pathway is more likely and internally consistent with regard to the CO2 compensation point. However, this notion may change as we find out more about the nature of carbon export as CH2-THF.
  5. Under TPU limited conditions plants can increase CO2 uptake, by serine, glycine, or CH2-THF exit from the photorespiratory pathway and associated de novo nitrogen assimilation or C1 metabolism in leaves of C3 plants. However, there exists nitrogen assimilation not associated with the photorespiratory pathway, especially for low-photorespiration situations as occurring in C4 plants or in C3 plants under high CO2/low O2 conditions.
  6. Loss as a result of photorespiration in C3 plants is lower than the commonly suggested value, owing to: (i) glycine, serine and CH2-THF exports, and (ii) significant refixation of (photo)respired CO2 both within mesophyll cells and via IAS. On the other hand, (photo)respired CO2 release decreases the chance of CO2 coming from IAS being assimilated. It is this net refixation of the (photo)respired CO2 that is taken into account by the coupled CO2-diffusion and FvCB model.

This review did not discuss the C3–C4 intermediate photosynthesis, for which von Caemmerer (2000) outlined a modelling framework. We also hardly discussed modelling photosynthetic temperature response (see Bernacchi et al., 2013), but focused on photosynthetic CO2- and light-responses. One may be surprised to notice that Equations (4) and (11) for modelling the light-response of electron transport are still empirical. However, Farquhar and von Caemmerer (1981) presented some mechanistic basis for using these simple equations. Harbinson and Yin (2017) reported a mechanistic but more complex equation for the irradiance response of PSI electron transport rate. The essence of the FvCB model is its simplicity while capturing the most important contributing mechanisms of photosynthesis (Farquhar et al., 2001). This feature is maintained in the extended models as all the equations we reviewed are analytical, and users can easily implement them for thought experiments to explore changes of photosynthetic pathways. The simplicity means that the models are for steady-state photosynthesis. Excellent, more detailed models for photosynthesis under either steady-state or fluctuating conditions and for the photosynthetic acclimation to growth environment are all omitted in this review, despite their high relevance for photosynthesis in field environments.

CONFLICT OF INTEREST

The authors declare no conflict of interest.

DATA AVAILABILITY STATEMENT

Data sharing is not applicable as no datasets were generated during writing this review article.

    The full text of this article hosted at iucr.org is unavailable due to technical difficulties.