Wheat morpho-physiological traits and radiation use efficiency under interactive effects of warming and tillage management
Funding information: National Natural Science Foundation of China, Grant/Award Numbers: 31761143006, 41571493; National Key Research & Development Program of China, Grant/Award Numbers: 2016YFD0300201, 2017YFD0300301
Abstract
Understanding the interactive effects of different warming levels and tillage managements on crop morphological and physiological traits and radiation use efficiency (RUE) is essential for breeding climate-resilient cultivars. Here, we conducted temperature free-air controlled enhancement (T-FACE) experiments on winter wheat during two growth seasons in the North China Plain. The experiments consisted of three warming treatments and two tillage treatments (CT: conventional tillage and NT: no-tillage). In the normal season, warming had significant positive effects on major morphological and physiological traits and increased significantly RUE of yield (RUEY) and biomass (RUEDM) by 13.3 and 11.3%, 19.3 and 12.4%, 42.3 and 43.7%, respectively, under the treatments of CTT1, CTT2 and NTT1 relative to the control (CTN, NTN). By contrast, in the warmer season, warming had negative effects on leaf width, light extinction coefficient, light-saturated net photosynthetic rate, aboveground, stems and spike biomass and RUE from anthesis to maturity, and consequently grain yield under conventional tillage, but positive effects under no-tillage. Our findings bring new insights into the mechanisms on the interactive effects of warming and tillage treatments on wheat growth and productivity; provide valuable information on crop ideotypic traits for breeding climate-resilient crop cultivars.
1 INTRODUCTION
As one of the staple crops, wheat (Triticum aestivum L.) supplies approximately 20% of the total calorific input of the world's population (FAO, 2012); playing a vital role in global food security and social-economic development (Slafer, 2003; Zhao et al., 2017). The global demand for wheat continues to increase rapidly with the growing world population (Ortiz et al., 2008). However, climate change may negatively affect wheat productivity in some major wheat production regions (Asseng et al., 2015; Lobell, Sibley, & Ortiz-Monasterio, 2012; Reynolds et al., 2009; Tao, Xiao, Zhang, Zhang, & Rötter, 2017). Wheat yield has stagnated in some essential production regions of the world in the last decade (Brisson et al., 2010; Chen, Zhang, Tao, Wang, & Wei, 2017; Ray et al., 2019). A substantial increase in crop stress-resistance, genetic gain and yield potential are required to ensure food security in future decades (Cassman, Dobermann, Walters, & Yang, 2003).
Past increases in wheat potential yield have largely been obtained from the improvements in harvest index (HI) rather than biomass. Further large increases in HI are hard, but an opportunity exists for increasing productive biomass and harvestable grain (Parry et al., 2011). The crop biomass production depends on the interception of photosynthetically active radiation (PAR) and the efficiency of conversion into the dry matter, that is, radiation use efficiency (RUE) (Beer et al., 2010; Idinoba, Idinoba, & Gbadegesin, 2002; Wu, Hammer, Doherty, von Caemmerer, & Farquhar, 2019). Light interception of crop canopy is determined by the leaf area index (LAI) and light extinction coefficient (k) (Hikosaka et al., 2016). The amount of light interception and use of intercepted light for photosynthesis is affected by crop morphological traits or crop architecture such as the spatial and temporal arrangement of leaf area (Sarlikioti, De Visser, & Marcelis, 2011; Song, Zhang, & Zhu, 2013).
Using leaf characteristics to investigate plants' adaptation mechanisms to the environment is a breakthrough in physiological ecology (Reich et al., 1999; Rumman, Atkin, Bloomfield, & Eamus, 2018; Wright et al., 2004). Leaf photosynthesis capacity is mainly determined by the photosynthesis process per se and the arrangement of leaves within the canopy (Mantilla-Perez & Salas Fernandez, 2017). The flag leaf's photosynthesis plays a major role as a source of grain saccharides (Sanchez-Bragado et al., 2014; Thorne, 1973; Zhu, Zhu, Cao, et al., 2020; Zhu, Zhu, Zhang, et al., 2020). Changes in leaf morphological traits, including specific leaf area (SLA), leaf angle and leaf area, can have a major impact on photosynthesis rate, k and its distribution within the canopy (Mantilla-Perez & Salas Fernandez, 2017; Valladares, Skillman, & Pearcy, 2002). Besides, more evidence suggests sink strength is still a critical limiting factor for wheat yield (Miralles & Slafer, 2007; Zhang, Turner, & Poole, 2010), therefore, optimizing the source-sink ratio is a promising way to increase RUE, biomass and grain yield (Bustos, Hasan, Reynolds, & Calderini, 2013; Shearman, Sylvester-Bradley, Scott, & Foulkes, 2005). In turn, a larger RUE will increase the total assimilates available for spike growth, thereby increase the potential for grain number and thousand-grain weight (Bustos et al., 2013; Lynch et al., 2017; Rivera-Amado et al., 2019). Photosynthesis rate is sensitive to light intensity, which varies spatially and temporally within crop canopy (Farquhar, Buckley, & Miller, 2002). Recently, the introduction of morphological changes in the flag leaf and canopy structure has been a top priority in crop breeding programmes (Ort et al., 2015; Shearman et al., 2005). Several aspects need to be considered in breeding for increasing yield under climate change conditions, such as improved crop canopy architecture for the optimum light interception, adaptations of reproductive processes for better grain filling and modification of RUE to increase crop biomass (Reynolds et al., 2012). Crop light absorption directly affects photosynthetic efficiency and RUE (Evers et al., 2010; Townsend, Ware, & Ruban, 2018). In addition, RUE could be altered by different tillage systems. For example, no-tillage (NT) can help to improve soil aggregates in the root zone, increase soil moisture and soil organic matter and reduce soil erosion and runoff, compared to the conventional tillage (CT) system (Nielsen, Lyon, Hergert, Higgins, & Holman, 2015). The impacts of warming on RUE and total assimilates may be complicated in different tillage systems (Busari, Kukal, Kaur, Bhatt, & Dulazi, 2015; Kandel, Gowda, Northup, & Rocateli, 2019). Therefore, understanding the underlying mechanisms on how crop canopy structure and morphological traits will be changed and how the changes will affect light interception and RUE under different climate warming levels and tillage managements are essential for breeding climate resilient cultivars, but they have rarely been investigated.
In order to breed high-yielding cultivars, design of ideotypes, that is, “model plants”, for different crops and cultivation environments has become a research priority, because it is valuable for breeding climate-resilient cultivars with high RUE and stress-resilience (Dingkuhn et al., 2015; Paleari, Movedi, Cappelli, Wilson, & Confalonieri, 2017; Rötter, Tao, Höhn, & Palosuo, 2015; Semenov & Stratonovitch, 2013; Tao et al., 2017). Therefore, identifying crop ideotypic traits and breeding climate-resilient crop cultivars has become a growing research priority in recent years (Bodner et al., 2018; Dingkuhn et al., 2015; Paleari et al., 2017; Rötter et al., 2015; Semenov & Stratonovitch, 2013; Senapati, Brown, & Semenov, 2019; Tao et al., 2017). The plant morphological plasticity could be affected by the interactions of genotype, environment and agronomic management (Bustos et al., 2013; Cartelle, Pedró, Savin, & Slafer, 2006; Hikosaka et al., 2016; Parry et al., 2011). Crops also have considerable capacity to adjust and acclimate their photosynthetic characteristics to changes in seasonal temperature under future climate conditions (Cai et al., 2016; Cai, Li, Di, Ding, & Yin, 2020). However, the changes in crop morphological and physiological traits, and their impacts on canopy light distribution and RUE, have rarely been investigated, especially under high temperature conditions and different tillage managements. Thus, in this study, we tried to investigate the changes in wheat morphological traits and RUE under the interactive effects of different warming levels and tillage managements. We aimed to bring new insights into the interactive effects of warming and tillage management on wheat morphological and physiological traits and RUE, and to identify a wheat ideotype that will accelerate RUE, and consequently biomass and grain yield under future climate warming conditions.
2 MATERIALS AND METHODS
2.1 Study area
The temperature free-air controlled enhancement (T-FACE) experiments were conducted on the long-term (since 2003) conservation tillage fields at the Yucheng Comprehensive Experiment Station of Chinese Academy of Sciences (36°50′ N, 116°34′ E, the elevation is 20 m), Shandong Province, in the North China Plain (NCP). The NCP is a major wheat-producing region of China. The region has a temperate semihumid monsoon climate (Liu, Chen, & Pan, 2019). During the past 31 years (1985–2016), the mean annual temperature was about 13.1°C, and the mean annual precipitation was 561 mm, with about 70% of precipitation from June to September. The soil type is calcaric fluvisols according to the Food and Agriculture Organization of the United Nations-Unesco system (Batjes, 1997), with a mean soil bulk density of 1.38 g/cm3 and pH of 8.6. Wilting coefficient and mean water-saturated content at 0–150 cm were 11.5 and 36.1%, respectively (Chen, Wang, & Yu, 2010). The wheat-maize rotation system dominates in this region. Wheat is usually irrigated when necessary using water pumped from groundwater.
2.2 Experimental design
The experiment was a split-plot design in randomized complete blocks with two tillage treatments as main plots and three warming treatments as subplots with a 5 m buffer zone between contiguous main plots. The main plots (7.5 m × 40 m) were randomly allocated to each block with four replications, twenty 2 m × 2 m plots. The two tillage treatments include CT and NT. The three warming treatments include no warming (N), warming level 1 (T1) and warming level 2 (T2). The resultant five treatments for 2018/19 were CT with T1, T2 and N (CTT1, CTT2 and CTN, respectively), and NT with T1 and N (NTT1 and NTN). However, in the 2019/20 growth season, the straw was not returned in the NT treatment, and the infrared heater was not repaired in time for T2 treatment, because of the Coronavirus Disease-19 pandemic. There were four treatments for 2019/20, including CT with T1 and N (CTT1 and CTN, respectively), and NT with T1 and N (NTT1 and NTN). The heated plots were warmed using MSR-2420 infrared heater (Kalglo Electronics Inc., Bethlehem, PA), suspended 3 m above ground, without influence on crop canopy (Sherry et al., 2007). The control treatment (i.e., no-warming) had the same “dummy” infrared heater to simulate shading effects of the infrared heater. An average radiation of the infrared heater was 92 W m−2 and the effective area of warming was 4m2. Detailed information on the experimental scheme was elaborated in a previous study (Hou, Ouyang, Li, Wilson, & Li, 2012). The cultivar in the present experiment was Denghai 502, widely used in the NCP. The canopy (air) temperature was recorded using a digital thermometer (Model 51, John Fluke Manufacturing Co., Everett, Wash.). Soil temperature at 5-cm depth was monitored by PT 100 thermocouples sensor (Unism Technologies Incorporated, Beijing, China). The infrared heater increased soil temperature by approximately 1.3–2.3°C compared with the control treatment. The daily maximum and minimum air temperature, daily precipitation and total daily radiation at the experimental site during two growth seasons are illustrated in Figure S1. Based on the long-term daily meteorological data, the mean temperature during the growth season (November–May) over 1981–2016 was 8.75°C. The mean temperature in T2 (10.7°C) and T1 (9.4°C) treatment in 2018/19 growth season was near the 99th percentile and 95th percentile, respectively. The mean temperature in T1 (11.6°C) treatment in 2019/20 growth season exceeded the 95th percentile of historical mean temperature (Figure S2). The mean temperature in 2018/19 growth season (8.4°C) was close to the long-term mean, and that of 2019/20 growth season (10.2°C) was higher than the long-term mean. Thus 2018/19 is considered a normal season, and 2019/20 a warmer season.
2.3 Measurements of wheat morphological traits
 (1)
(1) (2)
(2) (3)
(3)2.4 Measurements of canopy light interception and light extinction coefficients
 (4)
(4) (5)
(5) (6)
(6) (7)
(7)2.5 Measurements of chlorophyll content and photosynthetic parameters
The Leaf chlorophyll content (SPAD)-502 (Minolta Camera Co., Osaka, Japan) was used as a tool to assess the relative chlorophyll contents and nitrogen status. Each leaf was measured six times at the 1/3 ~ 1/2 of leaves from the stem and then averaged at heading (GS55), anthesis (GS65) and grain-filling (GS75) stages. Then, leaf gas exchange parameters, including light-saturated net photosynthetic rate (Amax) and stomatal conductance (gs) were measured using an Infrared Gas Analyser (LI-6400XT; Li-Cor, Lincoln, NE). Its leaf chamber was maintained in a controlled condition with a reference CO2 concentration of 380–400 μmol/mol, a leaf temperature of 25°C, a saturated photosynthetic photon flux density (PPFD) of 1,200 μmol m−2 s−1 with a 90:10 red: blue light and relative air humidity of 60–70%. Air incoming system was drawn from 2 m height after passing through a 15 L buffer. Airflow was maintained at 500 μmol/s. Gas exchange was measured four times in the middle of the latest fully developed flag leaf in each plot in the morning (08:30–11:30).
CO2 response curve (A/Ci) was constructed by adjusting the reference CO2 concentration by a CO2 injector to 400, 300, 200, 125, 90, 60, 400, 500, 600, 800, 1,000, 1,250 and 1,600 μmol/mol, respectively, in order to obtain carboxylation efficiency (CE) (von Caemmerer, 2000). In addition, light response curve was set at 2000, 1500, 1,200, 1,000, 800, 600, 500, 400, 300, 200, 100, 50 and 0 μmol m−2 s−1, respectively. The apparent quantum efficiency (AQE) and dark respiration rate (Rd) were calculated. Each curve for a plot was measured three times between 08:30 and 16:00 in the same controlled environments mentioned above. The CO2 response curve and light response curves were fitted by a modified rectangular hyperbolic model (Ye, 2007).
2.6 Measurements of wheat phenology, aboveground biomass and grain yield
Wheat phenology dates, including sowing, re-greening (GS29), jointing (GS31), flag completed (GS47), heading (GS55), anthesis (GS65) and maturity (GS92), were recorded when 50% of plants had reached the corresponding growth stages. The biomass, including stems, leaves and spikes, were clipped at different growing stages, then weighted for the corresponding biomass after drying at least 48 hrs at 70°C in an oven to a consistent weight. After physiological maturity, spikes per square metre (spike/m2), kernels per spike (kernel/spike), fertile spikelet per panicle (fertile spikelet panicle−1) and sterile spikelet per panicle (sterile spikelet panicle−1) were investigated per m2. At maturity 1 m2 of wheat was harvested for each plot. Aboveground biomass and grain yield (GY) were measured after air-dried. HI was calculated by GY weight divided by aboveground biomass. Thousand kernel weight (TKW) was measured after drying at least 48 hrs at 70°C in an oven to a consistent weight.
2.7 Analysis
Analysis of variance (ANOVA) was conducted with the package “LSD” in R 3.5.1 (R Core Team) to examine the effects of treatments at different growing periods. The differences between the mean values were tested using the least significant difference (LSD) multiple comparison test (p < .05). Repeated measures analysis of variation (RM-ANOVA) with LSD multiple range tests were conducted to test the effects of year, warming, tillage treatments and their interactions on the morphological and physiological traits. Means and standard errors of all data were processed with the Excel 2010 software (Microsoft, Redmond, WA). The standardized major axis (SMA) was conducted to identify the leaf trait relationships using the “smart” package in R. The structural equation model (SEM) analysis was performed using AMOS 21.0 (Amos Development Co., Greene, ME, USA) to test the variations associated with light interception. The Chi-square (χ2) test, the goodness of fit index (GFI), Bollen's relative fit index (RFI), root mean square error of approximation (RMSEA) and Akaike information criterion (AIC) were conducted and calculated to evaluate the model fitness. A general rule applied that χ2 test probability level > 0.05, GFI > 0.9, RFI > 0.9 and RMSEA < 0.08 correspond to a good fitness when the sample was relatively small (Ogasawara 2001). Principal Component Analysis (PCA) analysis was conducted using the “FactoMineR” and “factoextra” packages in R to explore the associations among different traits, and the effects of warming and tillage conditions (v.3.4.1, R Core Team 2017). All of the Figures were plotted using Sigmaplot 12.5 (Systat Software Inc.).
3 RESULTS
3.1 Interactive effects of different warming levels and tillage managements on wheat morphological traits
Warming, tillage and year had significant effects on LL, LW, LA and flag leaf biomass based on RM-ANOVA (Table 1). There were strong interactive effects between warming and tillage on LL and SPAD. Leaf width generally decreased with leaf sequence from top to bottom of canopy. Leaf width was larger under CT than NT. Warming significantly increased LW at anthesis stage in 2018/19 but not in 2019/20 (Figure 1c,d). Likewise, there were also significant differences in LL and subsequently LA among the leaves at different layers of canopy at anthesis stage (Figure 1a,b,e,f). Elevated temperature increased LA significantly for the leaves in top layers of canopy but not in bottom layers of canopy.
| Factors | W | T | Y | W × T | W × Y | T × Y | W × T × Y | |||||||
|---|---|---|---|---|---|---|---|---|---|---|---|---|---|---|
| F | p | F | p | F | p | F | p | F | p | F | p | F | p | |
| Amax | 17.56 | <.001 | 16.96 | <.001 | 7.57 | <.05 | 5.27 | <.05 | 0.27 | .61 | 3.16 | .09 | 1.44 | .25 |
| gs | 1.07 | .32 | 3.06 | .10 | 0.08 | .78 | 0.05 | .83 | 0.05 | .82 | 0.56 | .46 | 0.62 | .44 |
| Rd | 15.40 | <.001 | 0.00 | .97 | 9.22 | <.001 | 0.14 | .72 | 0.65 | .43 | 2.64 | .12 | 0.41 | .53 |
| AQE | 10.57 | <.001 | 6.63 | <.05 | 0.46 | .51 | 0.04 | .84 | 0.26 | .62 | 0.20 | .66 | 2.27 | .15 |
| CE | 0.46 | .51 | 1.20 | .29 | 13.09 | <.001 | 0.01 | .93 | 2.64 | .12 | 0.09 | .77 | 0.00 | .97 |
| Leaf length | 32.87 | <.001 | 137.47 | <.001 | 17.12 | <.001 | 5.09 | <.001 | 0.00 | 1.00 | 29.93 | <.001 | 1.30 | .26 |
| Leaf width | 35.26 | <.001 | 42.84 | <.001 | 60.75 | <.001 | 2.66 | .11 | 1.12 | .30 | 7.63 | <.01 | 1.27 | .27 |
| Leaf area | 45.17 | <.001 | 99.58 | <.001 | 47.95 | <.001 | 1.97 | .17 | 2.50 | .12 | 15.31 | <.001 | 0.88 | .35 |
| Leaf angle | 3.12 | .09 | 4.67 | <.05 | 11.76 | <.01 | 1.30 | .26 | 0.36 | .56 | 1.30 | .26 | 0.09 | .76 |
| SPAD | 3.64 | .07 | 3.13 | .09 | 1.26 | .27 | 6.94 | <.05 | 3.20 | .08 | 5.04 | <.05 | 0.00 | .99 |
| Flag leaf biomass | 27.51 | <.001 | 52.68 | <.001 | 33.26 | <.001 | 0.63 | .43 | 0.76 | .39 | 6.66 | <.05 | 0.50 | .48 |
| SLA | 0.05 | .82 | 0.24 | .63 | 2.61 | .12 | 0.02 | .90 | 0.59 | .45 | 0.01 | .91 | 0.91 | .54 |
| Plant height | 6.90 | <.05 | 6.33 | <.05 | 2.21 | .14 | 0.29 | .59 | 0.18 | .68 | 0.70 | .41 | 0.22 | .64 |
| Leaf biomass | 13.71 | <.001 | 39.54 | <.001 | 26.48 | <.001 | 8.07 | <.01 | 2.38 | .13 | 0.56 | .46 | 0.13 | .72 |
| Stem biomass | 4.08 | <.05 | 13.55 | <.001 | 0.84 | .36 | 5.09 | <.05 | 0.33 | .57 | 0.01 | .91 | 0.61 | .44 |
| Spike biomass | 5.10 | <.05 | 8.24 | <.01 | 1.37 | .25 | 1.29 | .26 | 0.41 | .53 | 0.00 | .97 | 0.84 | .36 |
| Total biomass | 16.01 | <.001 | 27.19 | <.001 | 6.84 | <.05 | 5.85 | <.05 | 0.54 | .46 | 0.04 | .85 | 0.86 | .36 |
| RUE | 2.42 | .14 | 13.10 | <.01 | 6.90 | <.05 | 1.37 | .26 | 0.33 | .57 | 0.46 | .51 | 0.94 | .35 |
- Abbreviations: F, F-ratio value; p value, significance level.
- The significance is statistically significant with p < 0.05, and highly significant with p < 0.001
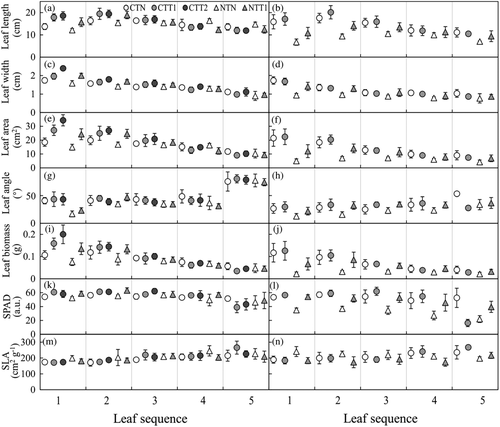
Morphological traits results obtained from heading (GS55), anthesis (GS65) and grain filling (GS75) stages were similar; thus, the anthesis stage results, key growth stage, were mainly reported. Warming and tillage treatments changed significantly leaf angle in some cases at anthesis stage (Figure 1g,h). In the control treatment, leaf angle generally increased with leaf sequence or leaf layer (flag leaf is the leaf at the top layer). Warming increased leaf angles significantly, especially for flag leaves, under the two tillage managements. The effects of warming and tillage on leaf biomass were the same as those on LA (Figure 1i,j). Leaf chlorophyll content (SPAD) generally decreased with leaf layer (Figure 1k,l). Warming increased leaf chlorophyll content in the top leaves significantly at the anthesis stage, and for each leaf under NT. There were significant differences in SLA among the leaves at different layers of canopy (Figure 1m,n). SLA increased gradually with leaf layer. Warming reduced SLA for each leaf under NT but not under CT.
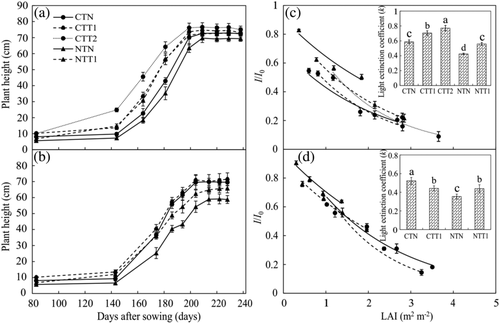
Compared with the control treatments (CTN, NTN), warming significantly increased PH, especially in vegetative growth stage (Figure 2a,b). The increase by warming was more pronounced under NT than CT. Light extinction coefficient (k) was derived from the exponential regression between I/I0 and LAI for all treatments (Figure 2c,d). Compared with the control treatments (CTN, NTN), warming significantly increased k in 2018/2019 with k under CTT2 being the highest at the anthesis stage. In 2019/20, warming increased k notably under NT, but reduced it under CT.
3.2 Interactive effects of different warming levels and tillage managements on leaf photosynthetic parameters
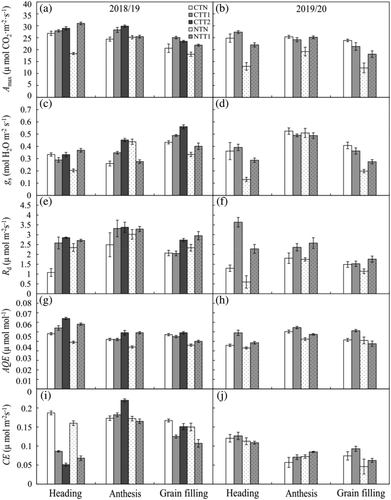
Warming, tillage and their interactions had significant effects on the light-saturated gross photosynthetic rate (Amax). However, there were no significant interactive effects between warming and tillage on gs, Rd, AQE and CE based on RM-ANOVA (Table 1). Under CT, elevated temperature increased Amax during the entire growth cycle in 2018/19, but increased it only at vegetative growth stage in 2019/20 (Figure 3). Under NT treatments, elevated temperature increased Amax significantly during the entire growth cycle in the both years (Figure 3a,b). The effects of warming and tillage on gs of wheat leaves were the same as those on Amax, except for anthesis stage under NT (Figure 3c,d). Moreover, elevated temperature raised leaves Rd notably during the entire growth cycle for the both tillage managements and years. And the enhancement ratio of Rd in 2019/20 was higher than that in 2018/19 (Figure 3e,f). In general, elevated temperature raised leaves AQE notably before grain filling stage (Figure 3g,h). Warming, tillage and their interactions had nonsignificant effects on CE, however, the effects were significantly different (Figure 3i,j).
3.3 Interactive effects of different warming levels and tillage managements on wheat development, biomass accumulation, yield components and RUE
Overall, artificial warming affected significantly wheat growth duration under different treatments (Table S1). In 2018/19, the anthesis date was advanced by 7, 15 and 11 days under the treatment of CTT1, CTT2 and NTT1 compared with control treatment (CTN, NTT), respectively. In 2019/20, the duration from sowing to anthesis was shortened on average by 4 days for CTT1 and NTT1; warming had little effect on the duration from anthesis to maturity.
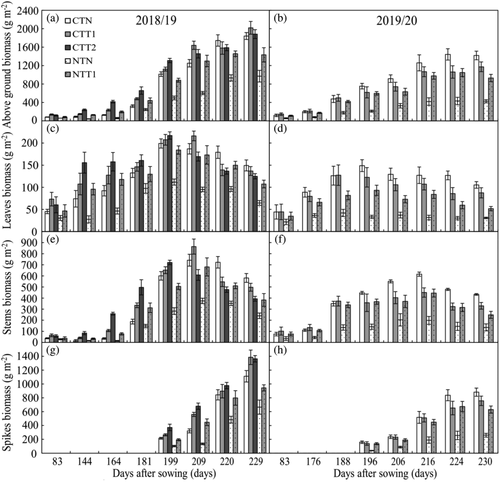
In 2018/19, warming increased aboveground and spikes biomass under different tillage managements, and accelerated leaf growth and senescence (Figure 4). The interactive effects of warming and tillage on leaf, stem and total biomass were significant in the both years based on RM-ANOVA (Table 1). Warming increased the maximum leaf biomass and grain filling rate. In 2019/20, warming gradually reduced the biomass of aboveground, leaves, stems and spikes with wheat development under CT. In contrast, it increased the biomass of aboveground, leaves, stems and spikes under NT (Figure 4).
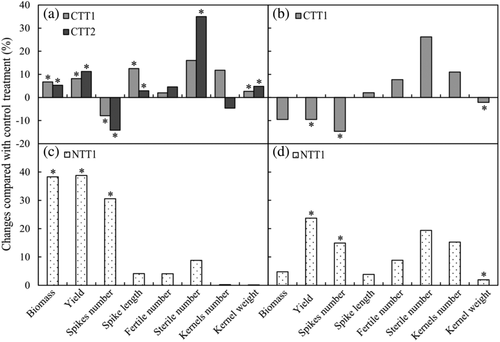
Warming increased wheat biomass and yield significantly in 2018/19 (Figure 5), however, reduced wheat yield under CTT1 in 2019/20. Warming increased spikes number by 30.58 and 14.93% under NTT1 treatment in 2018/19 and 2019/20, respectively. However, it reduced spikes number by 7.92, 14.16 and 14.68%, respectively, under the treatments of CTT1 and CTT2 in 2018/19 and CTT1 in 2019/20. Warming increased SL, fertile and sterile spikelet slightly. Thousand kernel weights were increased by warming except under CT in the warmer season.
There were notable differences in RUE among different warming levels and tillage treatments (Table 2). Tillage and year had significant effects on RUE based on RM-ANOVA. However, there was no interactive effect between warming and tillage on RUE (Table 1). RUE in NT treatments was significantly lower than that in CT treatments. The RUE in CTT2 treatment remained the largest except for the stage from jointing to anthesis in 2018/19. Warming increased RUE gradually with wheat development, reaching the maximum value during anthesis to maturity stage. The results suggested that RUE from anthesis to maturity stage should play a key role in accumulating biomass and increasing GY. Warming enhanced RUE notably at the stage from sowing to jointing in the both years. In 2018/19, experimental warming increased RUEY and RUEDM notably by 13.3 and 11.3, 19.3 and 12.4%, 42.3 and 43.7%, respectively, under the treatments of CTT1, CTT2 and NTT1, relative to the control treatment (CTN, NTN) (Table 2). In 2019/20, experimental warming increased RUEY and RUEDM by 35.3 and 7.5% under NTT1 relative to the control treatment (NTN); however, decreased RUEY and RUEDM slightly by 7.1 and 5.01% under CTT1 relative to the control treatment (CTN). The relationships between RUE of crucial developmental stages and yield and biomass are shown in Figure S3. The RUE at jointing-anthesis stage was significantly correlated with yield and biomass.
| Year | Treatments | RUE of different growth stages, yield and biomass | ||||
|---|---|---|---|---|---|---|
| Sowing-jointing | Jointing-anthesis | Anthesis-maturity | Yield | Biomass | ||
| 2018–2019 | CTN | 0.04 ± 0.01c | 0.84 ± 0.02bc | 1.15 ± 0.09ab | 1.81 ± 0.02b | 3.80 ± 0.05b |
| CTT1 | 0.08 ± 0.01b | 0.96 ± 0.03a | 1.27 ± 0.10a | 2.05 ± 0.08a | 4.23 ± 0.16a | |
| CTT2 | 0.12 ± 0.01a | 0.90 ± 0.03ab | 1.29 ± 0.05a | 2.16 ± 0.07a | 4.27 ± 0.14a | |
| NTN | 0.08 ± 0.01b | 0.52 ± 0.03d | 0.80 ± 0.13c | 1.23 ± 0.04c | 2.54 ± 0.09c | |
| NTT1 | 0.07 ± 0.01b | 0.81 ± 0.03c | 0.91 ± 0.15bc | 1.75 ± 0.05b | 3.65 ± 0.11b | |
| 2019–2020 | CTN | 0.10 ± 0.01b | 0.66 ± 0.02a | 1.19 ± 0.08a | 1.56 ± 0.01a | 3.39 ± 0.09a |
| CTT1 | 0.14 ± 0.01a | 0.54 ± 0.05a | 0.88 ± 0.09b | 1.45 ± 0.06a | 3.22 ± 0.23a | |
| NTN | 0.05 ± 0.01c | 0.26 ± 0.03b | 0.26 ± 0.07c | 0.68 ± 0.01b | 2.01 ± 0.06b | |
| NTT1 | 0.08 ± 0.01b | 0.29 ± 0.06b | 0.77 ± 0.03b | 0.92 ± 0.02b | 2.16 ± 0.04b | |
- Note: Different lowercase is significantly different at .05 level under same growth stage (M ± SE).
- Abbreviation: RUE, radiation use efficiency.
3.4 Relationships among the multiple traits under different warming levels and tillage managements
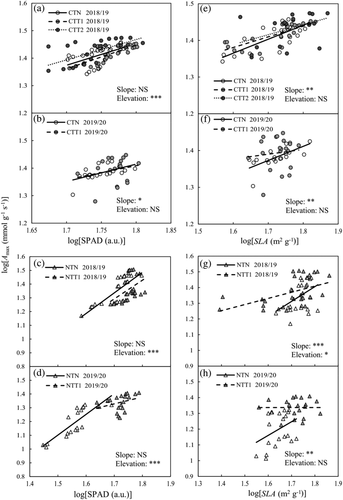
As shown by the SMA regression in Figure 6, the SMA slopes of SPAD and Amax kept stable under warming and tillage conditions except for CT in 2019/20. However, experimental warming could significantly affect the SMA elevations of SPAD and Amax (Figure 6a–d). In addition, the slopes for SLA and Amax were significantly altered by experimental warming (Figure 6e–h). Elevated temperature had no significant effect on the elevations for SLA and Amax, except for NT in 2018/19.
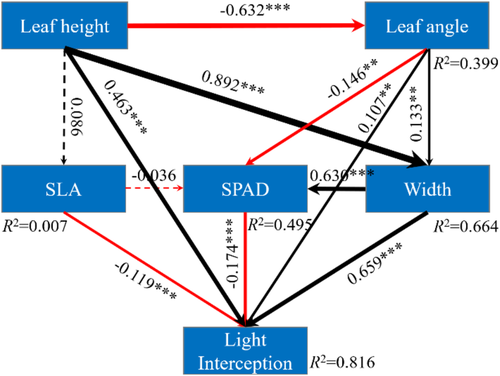
A structural equation modelling was well fitted with the factors related to light interception at anthesis stage (χ2 = 5.409; df = 3; p = .144; GFI = 0.993; RFI = 0.974; RMSEA = 0.055; AIC = 41.409). The factors explained 81.6% of the total variations in light interception (Figure 7). Leaf angle decreased significantly with leaf height (or leaf sequence) with a negative path coefficient (estimate = −0.63, p < .001). Leaf angle had significantly positive relationships with light interception (estimate = 0.11, p < .05). Leaf width (or LA) was also significantly correlated with light interception (estimate = 0.66, p < .001). In the meantime, leaf height had significantly positive relationships with LW (estimate = 0.892, p < .001) and light interception (estimate =0.46, p < .001). Leaf angle and LW (LA) in the canopy showed a vertical distribution. Leaf angle had a negative effect on SPAD (estimate = −0.146, p < .01). Standardized direct, indirect and total effects of leaf traits and covariates explaining light interception were illustrated in Tables S2–S4. Overall, the model showed that the upper leaves with a large LW and leaf angle could increase light interception.
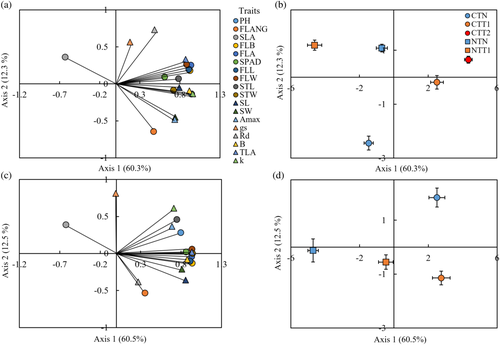
The PCA biplot was further employed to test the combined effects of different warming levels and tillage managements on the photosynthetic parameters, morphological and growth traits at the anthesis stage (Figure 8), including trait loadings biplot and treatments distribution in the trait space. The patterns of PC scores represented well the effects of different warming levels and tillage managements. The first two principal components (PCs) accounted for 60.3 and 12.3% of total variations in 2018/19 (Figure 8a), and 60.5 and 12.5% in 2019/20 (Figure 8b), respectively. The PCA results explained well the major changes in all the variables. The leaf-related traits (e.g., flag leaf biomass, flag LA) and plant characteristics (e.g., k, aboveground biomass and PH) had high scoring on the first axis. The leaf physiological traits (e.g., Rd, gs, Amax) and flag leaf angle had high scoring on the second axis in the both years (Figure S4 & S5). The distribution of the factor scores showed that the factor scores for warming under CT were mostly located in the right part of the chart, while those for NTN were located in the left part (Figure 8). The treatments distribution in the trait space showed that CTT1 and CTT2 in 2018/19 and CTN in 2019/20 had a high scoring in the first axis. This suggested the warming and tillage treatments could have distinct effects on these variables.
4 DISCUSSION
4.1 Changes in wheat morphological traits and RUE with different warming levels
This present study provided new insights into the mechanisms underlying wheat GY changes under different warming levels and tillage managements. Wheat morphological traits affect light interception and attenuation within the canopy, and consequently, biomass and GY (Liu et al., 2017). Warming could increase RUE by affecting morphological traits (Figures 1 & 2). Experimental warming could significantly increase LA and leaf biomass, especially for top leaves at anthesis stage. Larger LA and biomass lead to larger LAI and extinction coefficient, which is conducive to light interception (Hikosaka et al., 2016; Mantilla-Perez & Salas Fernandez, 2017; Parry et al., 2011). Moreover, the flag leaves' morphological traits, as one of the most essential traits, determine plant architecture and yield potential (Sharma, Sain, & Sharma, 2003). One of the mechanisms to narrow the gap between theoretical and actual energy conversion is to optimize the entire plant (Zhu, Long, & Ort, 2008). Several studies have indicated that upright leaves in the upper canopy, less erect leaves in the medium canopy and more horizontal leaves in the lower canopy, canopy provide the best plant architecture (Long, Zhu, Naidu, & Ort, 2006; Ort et al., 2015; Zhu et al., 2010). This study suggested that leaf angle gradually increased within the canopy from top to bottom, which means more planar leaves in the lower part of the canopy. Warming decreased the entire leaf angle and slightly increased leaf angle of the top leaves, especially in a normal season, which is beneficial for flag leaves and entire canopy to utilize light after anthesis stage. Besides, improving the canopy architecture such as erect canopies could decrease the PPFD in the upper leaves, resulting in a more even distribution of light within canopy and avoiding exceeding light saturation of upper leaves, could improve photosynthetic efficiency and crop productivity (Long et al., 2006; Murchie & Niyogi, 2011; Zhu et al., 2010).
On the other hand, light interception of the crop is mainly determined by LAI and k (Hikosaka et al., 2016). The results of PCA revealed that k was also related to PH, aboveground biomass and LA (Figure 8). The positive correlation between PH and biomass may be because higher plants can have more leaves, larger light interception and better distribution within canopy, which increase photosynthesis and RUE (Song et al., 2013). Previous studies showed that leaf angle and LAI were critical parameters to optimize light interception and a high rate of dry matter production (Mantilla-Perez & Salas Fernandez, 2017; Parry et al., 2011). In the current study, a structural equation modelling was well fitted with the relationships among factors related to light interception. The model indicated that the upper leaves with large LW and leaf angle contribute to light interception, especially for grain filling stage when lower leaves senesced (Thorne, 1973). Larger LAI and earlier reaching its maximum under warming and tillage treatments resulted in a higher light interception, leading to a higher k in CTT2 and CTT1 than CTN in a normal season. Leaf area was notably increased by warming for the upper leaves but decreased for the bottom leaves, which suggests that warming could accelerate leaf senescence after anthesis. Maintaining green LA longer (stay-green trait) and slowing down the leaf senescence after anthesis could maintain higher photosynthetic activity in the canopy and resultant GY (Hörtensteiner, 2006). Grain yield and grain protein concentration are strongly affected by the length of the post-anthesis period and maintenance of green LA for photosynthetic activity. The onset and rate of senescence of the flag LA are expected to be involved in both N uptake and C remobilization, and consequently, grain protein concentration and GY (Distelfeld, Avni, & Fischer, 2014; Hirel, Le Gouis, Ney, & Gallais, 2007; Nehe et al., 2020). Positive relationships between stay-green phenotypes and GY have been demonstrated by previous studies especially under water stress (Bogard et al., 2011; Lopes & Reynolds, 2012; Ullah & Chenu, 2019). Kipp, Mistele, and Schmidhalter (2014) suggested that stay-green phenotypes could maintain a higher N uptake during grain filling due to a prolonged green flag LA.
4.2 Changes in wheat physiological traits and RUE with different warming levels
Biomass accumulation and GY formation depend on both the plant's capacity to capture light energy and utilize it to fix CO2 into complex organic compounds (Beer et al., 2010; Wu et al., 2019). In a leaf canopy, leaf nitrogen content per unit LA (Narea) is the highest at the top of the canopy and decreases with depth (Hirose & Werger, 1987). The development of vertical canopy gradients of leaf N has been regarded as an adaptation to the light gradient that helps to maximize canopy photosynthesis (Niinemets, 2010). The interactive effects between warming and tillage had significant impacts on Amax and SPAD in this study. Foliage chlorophyll content determines the proportion of light absorbed by any given incident light (Niinemets, 2010). SPAD-502 chlorophyll metre could be used to obtain a non-destructive and rapid estimation of foliar N status (Chang & Robison, 2003). The current study showed that the SMA slopes of SPAD and Amax kept stable under warming and tillage management except for CT in 2019/20. The relatively high elevation for Amax-SPAD revealed an increase in photosynthetic rate at a given unit of SPAD under warming treatment. It suggested that warming should make the plants more efficient in N use efficiency (Yang, Wang, Klanderud, & Yang, 2011). SLA has been regarded as an indicator of plant resource-use strategy (Drewry, Kumar, & Long, 2014). The relatively high slope for Amax-SLA revealed a high SLA at a given unit of photosynthetic rate under warming condition. It appeared that warming may shift the plants to quick investment-return strategy with short leaf lifespan (Zhu, Zhu, Cao, et al., 2020; Zhu, Zhu, Zhang, et al., 2020).
Crop biomass and GY are the results of photosynthesis and respiration, which both are affected by temperature (Peng et al., 2004; Sánchez, Rasmussen, & Porter, 2014). The current study indicated that warming affected Amax, Rd and AQE, especially in 2018/19. Rd is also related to leaf-nitrogen content and indicated to increase by elevated temperature (Archontoulis, Yin, Vos, Danalatos, & Struik, 2011). Such effects were extended to the integrated trait RUE. Warming enhanced RUE before anthesis while also increasing Amax in the 2 years. The low temperature in winter inhibits photosynthesis in wheat, and elevated temperature may be able to relieve the adverse effects of low temperature in the NCP (Tao et al., 2017; Tao & Zhang, 2013). The high activities of enzymes associated with photosynthesis and enlarged LA under warming condition could lead to enhanced photosynthetic capacity (Kumar, Kumar, Vats, & Ahuja, 2006). RUE was higher under warming than under control treatments (CTN, NTN) from sowing to re-greening stage (Table 2). In 2019/20, high temperature had nonsignificant effects on Amax after anthesis, but increased Rd notably under CT. The enhancement ratio of Rd in 2019/20 was higher than in 2018/19. This finding indicated that warming-induced high crop respiration surpassed photosynthesis, leading to a decrease in RUE (Cai et al., 2016). In addition, the results showed that SPAD had a vertical distribution and decreased with leaf layer height. High AQE may be beneficial for the bottom leaves to absorb the lower light available under warming conditions (Ye, 2007). The interactive effects between warming and tillage on Amax and SPAD were significant in the two years (Table 1), which might be ascribed to the increase of optimum temperature for photosynthesis under different tillage managements. This also suggests that photosynthetic characteristics of a crop could have an increased maximum capacity under future (Cai et al., 2020). In contrast to the normal season (2018/19), in the warmer season (2019/20), warming had negative effects on LW, k, Amax, aboveground stems and spike biomass, RUE from anthesis to maturity, and consequently GY under CT. The findings suggest the optimal temperature threshold for wheat growth and productivity could be exceeded in a warmer season in the NCP (Tao et al., 2017).
4.3 Changes in biomass and yield components under different warming levels and tillage managements
There is a potential to improve cumulative radiation interception over the crop cycle by promoting fast early-LA growth to more rapidly reach maximum radiation interception (Reynolds et al., 2009). Our results showed that warming could increase RUE of all treatments (Table S3) at the early stages, leading to larger biomass. This finding is consistent with Zerner, Gill, and Vandeleur (2008) who noted that the cultivars with higher early vigour are generally capable of extracting more soil moisture, which in turn enables them to maintain lower canopy temperatures on warm days, essential in dryland farming (Zerner et al., 2008). Warming also positively affected wheat growth and development as shown by Figure 4 in the normal season. Leaf biomass was higher than the control treatments, which suggests that larger LAs could achieve more light interception and conversion into biomass earlier (Fang, Cammarano, Zhou, Tan, & Ren, 2015).
Previous warming experiments have shown that increase in temperature could increase or decrease yields depending on growth season temperature (Fang, Su, Liu, Tan, & Ren, 2013; Hou et al., 2012; Lele, 2010). The current study showed that yield for CT was significantly increased by more than 7.92% by warming in the normal season (i.e., 2018/19). However, it was reduced by 9.53% under CTT1 in the warmer season (i.e., 2019/20). Warming reduced spike number and increased sterile spikelet number under CT, which caused significant decreases in kernel weight and gain yield in the warmer season (Figures 5a,b). These results reflect those of Jagadish, Craufurd, and Wheeler (2007) who also found that high temperature would reduce spikelet fertility and increase sterile spikelet at a critical stage (meiosis or anthesis stages). Previous studies suggested that climate warming might be beneficial for wheat crops in the NCP because it may reduce frost/chilling, increase LAI, enhance photosynthesis, lead to earlier flowering and subsequently shift the post-anthesis period to a cooler period to avoid heat stress (Tao et al., 2017; Tao & Zhang, 2013). However, our results showed that the warmer season temperature had been approaching or exceeded the optimal temperature for winter wheat and caused negative effects on spikelet fertility, Amax, gs and GY, from anthesis stage under CT. Experimental warming reduced green LA and kernel weight (Prasad, Pisipati, Ristic, Bukovnik, & Fritz, 2008). Thousand kernel weights were increased under warming conditions compared with the control treatment, except for CT in 2019/20 under higher temperature. The changes in yield were mainly due to high sensitivity of TKWs to temperature increase. The responses of wheat yield to climate change can be regulated by varietal replacement (Xiao & Tao, 2014). Our results indicated that crop varieties with large TKWs could effectively adapt to future warming scenarios. Surprisingly, no significant yield decrease was found under NT in the warmer season (i.e., 2019/20). Our results also suggest that NT could mitigate the negative impacts of high temperature on yield. Warming significantly increased yield under NT by 38.80% in 2018/19 and 23.73% in 2019/20. Conservation agriculture (NT) could increase soil organic matter, improve water-holding capacity and prevent soil erosion (Lal, 2009), and consequently help wheat systems in adapting to climate change (Huang et al., 2018; Ortiz et al., 2008; Triboi & Triboi-Blondel, 2002). Our results suggested that tillage system had a significant effect on physiological traits (Amax, AQE), morphological traits (LL, LW and leaf angle) and thus on biomass accumulation. Warming under NT treatment could increase Amax, LA and LAI, and consequently increase biomass and GY. No-tillage system has a certain buffer effect to climate change (Ortiz et al., 2008).
4.4 Source-sink ratio should be optimized to increase GY
Theoretically, the current HI is close to the limit of about 60% in modern wheat cultivars (Foulkes et al., 2011). Higher biomass and the optimized source-sink ratio will drive the next quantum leap in wheat GYs (Bustos et al., 2013; Miralles & Slafer, 2007). Moreover, larger SL and width can increase sink strength and result in a large RUEy (Bustos et al., 2013; Cartelle et al., 2006). Environmental changes, including elevated temperature and CO2 concentration, have multiple effects on the availability of the assimilates through photosynthesis (source strength) and the grains' demand for assimilates (sink strength) (Uddling, Gelang-Alfredsson, Karlsson, Selldén, & Pleijel, 2008). In this study, the source refers to photosynthesis capacity of the flag leaf, chlorophyll content and LAI. The sink refers to the ability of organs to accumulate assimilates, such as grain number and size (SL and SW). The PCA biplot results indicated that sink and source showed high correlation (Figure 8). Flag and total green leaves contribute to the primary sources of carbohydrates for grain-filling, resulting in accumulating more than half of carbohydrates in grain (Thorne, 1973; Yang, Peng, Dionisio-Sese, Laza, & Visperas, 2008).
Another important finding was that warming enlarged LA and LAI (Figures 1 & 2) in a normal season, resulting in large source strength. Warming increased chlorophyll contents per LA (Figure 1), which is related to photosynthetic capacity (Chang & Robison, 2003), especially for NT, leading to larger photosynthesis rate and biomass. In 2018/19, warming promoted wheat growth, which implied that warming might positively affect wheat production by increasing the sink-source balance of wheat (Zhang et al., 2010). The biomass after anthesis could be increased by the increased sink strength through positive feedback to photosynthesis (Reynolds, Pellegrineschi, & Skovmand, 2015). Our PCA results indicated that biomass showed positive correlation with Amax and LA at anthesis. For sink strength, warming significantly increase SL under CTT2 treatment. These may enhance RUE of GY by altering the balance of source and sink. The PCA biplot results indicated that Amax showed positive dependence relationships with SL and SW at the anthesis stage. These results are supported by some previous studies, which suggested that source restriction and source-sink co-limited were the main factors for GY at the post-anthesis stage (Cartelle et al., 2006; Serrago, Alzueta, Savin, & Slafer, 2013).
5 CONCLUSIONS
- Warming and tillage management had significant interactive effects on major morphological and physiological traits and RUE of winter wheat.
- The changes in the morphological and physiological traits could lead to changes in canopy light interception, RUE, leaf trade-offs and the balance of wheat source and sink, and eventually GY.
- High temperature in a warmer season had more negative effects on wheat growth, photosynthesis and productivity, particularly at post-anthesis stage under CT. No-tillage mitigated the negative impacts of high temperature.
- The interactive effects of different warming levels and tillage treatments on wheat morphological and physiological traits, growth and productivity provide valuable information for breeding climate-resilient cultivars to cope with future climate change.
- For trait-based physiological breeding under future climate change conditions, some ideotypic traits are promising, such as larger LW and LA, more horizontal flag leaves to maximize light interception during the grain-filling stage, high leaf chlorophyll content and stay-green trait.
- Warming impacts on morphological and physiological traits and RUE for other varieties in various growth environments are worthy of further studies, including the environments where growth season temperature has exceeded the optimal temperature thresholds for wheat growth and productivity.
ACKNOWLEDGMENTS
This study was supported by the National Natural Science Foundation of China (Project Nos. 31761143006, 41571493), and the National Key Research & Development Programme of China (Project No. 2016YFD0300201, 2017YFD0300301). We thank Yi Chen, Yue Xin, Ran Zhai, Quanhui Ma, Xiaodi Liu, Shibo Li, Cunli Li and Yinxia Zhu for their great help during this study.
AUTHORS' CONTRIBUTIONS
Fulu Tao designed the study; Yibo Li and Ruixing Hou conducted the field work. Yibo Li performed the data analyses. Yibo Li and Fulu Tao drafted the manuscript. All authors discussed the results and revised the manuscript. The authors declared that they have no conflict of interest to this work.


