Identification and Validation of Novel Quantitative Trait Loci for Grain Hardness in Bread Wheat (Triticum aestivum L.)
Funding: This research was funded by the National Natural Science Foundation of China (32341037), Zhong Shan Laboratory (ZSBBL-KY2023-02-2), the National Key Research and Development Program of Jiangsu (BE2021335), the Earmarked Fund for CARS (CARS-03-8), Core Provenance Project in Jiangsu (JBGS [2021] 047), and Seed Industry Revitalization Project of Jiangsu Province (JBGS2021006).
Wenjing Hu and Zunjie Wang contributed equally to this work
ABSTRACT
Grain hardness (GH) plays an important role in wheat quality evaluation. Identification of new genes or quantitative trait loci (QTL) for GH is an effective strategy for wheat quality breeding. Here, we used a recombinant inbred line (RIL) population derived from a cross between two hard wheat Yangmai 4 (YM4) and Yanzhan 1 (YZ1) to identify QTL for GH. No QTL was detected on 5D chromosome, as parents YM4 and YZ1 possessed the two hard alleles Pinb-D1b and Pinb-D1p at the Hardness-5D (Ha-5D) locus, respectively. A total of three GH QTL were identified, among which QGh.yaas-4B and QGh.yaas-7D could be detected in all experiments and for mean value, explaining 8.69%–15.07% of the phenotypic variances. QGh.yaas-4D, co-located with Rht-D1, was detected in one experiment and for mean value, explaining 9.94%–11.39% of the phenotypic variances. We were not able to precisely validate QGh.yaas-4B due to its large mapping interval. Kompetitive allele-specific PCR (KASP) markers for QGh.yaas-7D were successfully developed, and then QGh.yaas-4D and QGh.yaas-7D were validated in a panel of 101 wheat cultivars/lines (all carrying Pina-D1a and Pinb-D1a alleles). Cultivars/lines harbouring the positive alleles of QGh.yaas-4D and QGh.yaas-7D increased GH by 85.16% relative to the ones without any positive allele. These results provide new loci and resources in molecular breeding for wheat hardness.
1 Introduction
Grain hardness (GH) is related to end-use quality of wheat. Hard wheat is suitable for making bread and high-quality noodles, with large flour granularity, high damaged starch content and strong water absorption ability. Soft wheat is suitable for making cookies and pastries, with small flour granularity, low damaged starch content and poor water absorption ability (Chen et al. 2006). With the rapid development of wheat genomics and molecular breeding technology, it is of great significance to explore GH-related markers to assist breeding of different types of special high-quality wheat varieties.
Puroindoline a (Pina) and Puroindoline b (Pinb), controlling wheat GH trait, are located in close physical positions on short arm of wheat chromosome 5D (Chen, Li, and Cui 2013). Mutation of the Pinb gene and the deletion of the Pina gene can cause the texture of wheat endosperm to harden (Chen et al. 2006; Bhave and Morris 2008; Morris and Bhave 2008; Wilkinson et al. 2008; Chen et al. 2012). Pinb-D1b is more favourable for processing qualities of steamed bread, noodles, bread relative to the wild type and Pina-D1b (Chen et al. 2006). Chen, Li, and Cui (2013) found that amongst hard cultivars from different countries, Chinese landraces possessed 11 types of Pin-D1 alleles in hard wheat landraces. Pina-null and Pinb-D1c genotypes showed significantly higher hardness than Pinb-D1b or Pinb-D1d genotypes, which showed the significantly lowest hardness amongst seven different hard genotypes (Chen, Li, and Cui 2013). Wilkinson et al. (2008) reported three new Pinb-like genes in hexaploid wheat, which were named puroindoline b-2 (Pinb-2) genes. Pinb-2 genes can be expressed in various organs and were located on different homologous groups of chromosome 7 of common wheat, with Pinb-2v2 and Pinb-2v3 were confirmed to be pair alleles through multiple genetic populations (Geng et al. 2012). However, there is still insufficient evidence to show that the Pinb-2 gene has a close relationship with wheat GH. Other minor quantitative trait loci (QTL) controlling wheat GH were mainly located on chromosomes 1A, 2A, 2D, 3B, 3A, 5A, 5B, and 6D (Sourdille et al. 1996; Igrejas et al. 2002; Morris 2002; Bhave and Morris 2008). Additionally, two dwarfing loci Rht-B1 and Rht-D1 were found to be associated with GH (Wang et al. 2012). So far, most loci/genes have not been effectively applied in wheat quality breeding except Pina-D1 and Pinb-D1.
Yangmai 4 (YM4) and Yanzhan 1 (YZ1) are two high-quality hard wheat cultivars with high yield in the Middle and Lower Reaches of the Yangtze River (MLRYR) and the Huang-Huai Wheat Region (HHWR), respectively. YM4 harbours wild alleles of Rht-B1 and Rht-D1 (Rht-B1a and Rht-D1a), while YZ1 harbours wild allele of Rht-B1 and dwarfing allele of Rht-D1 (Rht-B1a and Rht-D1b). The genetic basis of heading date, spikelet number, spikelet compactness, plant height and Fusarium head blight resistance for YM4 and YZ1 was identified in our previous studies (Hu et al. 2023; Zhao et al. 2023). In this study, we use this recombinant inbred line (RIL) population to (1) explore the genetic basis of GH in YM4 and YZ1; (2) quantify the additive effect of the GH QTL in the mapping population; (3) develop breeder-friendly molecular markers closely linked to the novel target region and (4) assess the effect of the target QTL in various backgrounds and define its potential for wheat breeding.
2 Materials and Methods
2.1 Plant Materials
A F2:10 population comprising 151 RILs, derived from a cross between YM4 and YZ1, was developed by a single seed descent approach at the Institute of Crop Sciences, Chinese Academy of Agricultural Sciences (CAAS). One hundred and one wheat cultivars/lines with Pina-D1a (soft allele) and Pinb-D1a (soft allele) at Ha locus were collected as the validation population in our laboratory. Among the 101 wheat cultivars/lines, 66 ones were detected to harbour negative alleles of QGh.yaas-4D and QGh.yaas-7D (Table S1). The list of the validation population was shown in Table S1. Fifteen additional hard wheat cultivars with negative alleles of QGh.yaas-4D and QGh.yaas-7D were collected from CAAS (Table S2). Among them, seven hard wheat cultivars carrying Pina-D1b (hard allele) and Pinb-D1a, and eight hard wheat cultivars carrying Pina-D1a and Pinb-D1b (hard allele) (Table S2). Therefore, 66 wheat cultivars/lines in the natural population and 15 additional hard wheat cultivars were used to analysis the effect of Pina-D1b and Pinb-D1b in the background of negative alleles of QGh.yaas-4D and QGh.yaas-7D (Tables S1 and S2).
2.2 Field Trials
The RILs, validation populations, and 15 additional wheat cultivars were planted in the same yield evaluation nursery in wheat-growing seasons 2017–2018 (2018) and 2018–2019 (2019) at the Yangzhou (YZ) experimental station (altitude 10–20 m, latitude 32.24°N, longitude 119.26°E and annual rainfall 1020 mm). Field experiments were conducted in randomized complete blocks with two replications. For each RIL and cultivar/line, an average of 60 seeds were sown in 150 cm double rows separated 30 cm apart. The management of field trials and disease control followed local standard practices. For fertilization, only base fertilizer was applied. The hardness was measured using a Perten Single Kernel Characterization System (SKCS) 4100 (Perten Instruments North America Inc., Springfield IL) according to Liu et al. (2017).
2.3 Statistical Analysis
Analysis of variance (ANOVA) was conducted in Inclusive Composite Interval Mapping (ICIM) software version 4.1 (Meng et al. 2015). Broad-sense heritability (hb2) was calculated using the formula hb2 = 𝜎2𝐺/(𝜎2𝐺 + 𝜎2𝐺×𝐸/E + 𝜎2e/ER) (Nyquist and Baker 1991; Yan et al. 2021), where E and R represent the number of environments and replicates, respectively, 𝜎2𝐺 is the genotypic variance, 𝜎2𝐺×𝐸 is the variance of genotype by the environment and 𝜎2e is the residual error. hb2 was calculated using ICIM v4.1 software (Meng et al. 2015). Pearson's correlation coefficients and t-test were calculated in EXCEL 2010.
2.4 Genotyping, Linkage Map Construction and QTL Analysis
Genomic DNA of RILs and cultivars/lines were extracted from the fresh leaves of seedlings according to the method of Doyle and Doyle (1987). The parental cultivars and RILs were genotyped using the wheat 55K single-nucleotide polymorphism (SNP) array containing 53,063 SNPs at China Golden Marker (Beijing, China) Biotech Co., Ltd. Kompetitive allele-specific PCR (KASP) and simple sequence repeat (SSR) markers associated with known genes/loci including Rht-B1, Rht-D1, Pina-D1 and Pinb-D1 were used for genotyping the parents and RILs to detect polymorphisms (Somers, Fedak, and Savard 2003; Rasheed et al. 2016; Xu et al. 2020; Zhang et al. 2020; Zhu et al. 2021). The physical positions of polymorphic SNPs were obtained by blasting the flanking sequences against the International Wheat Genome Sequencing Consortium (IWGSC) reference sequence v2.1 (Ref v2.1), and an expectation value (E) of 1E−10 was used as the significance threshold (Zhu et al. 2021). In ICIM v4.1, ‘BIN’ and ‘MAP’ functions were used to discard the redundant markers and sort the markers into groups with a threshold of LOD = 10, respectively (Li, Ye, and Wang 2007; Li et al. 2008). After grouping, the genetic distance between each group was calculated using the Kosambi mapping function in JoinMap 4.0. Previously, the whole-genome genetic map of YM4/YZ1 population was built by Hu et al. (2023). YM4/YZ1 map includes 1440 bin markers, with a total length of 3574.10 cm, and contains 26 linkage groups distributed on 21 chromosomes with a mean distance of 2.58 cm between markers (Hu et al. 2023). The QTL analysis was conducted using the ICIM algorithm implemented in ICIM v4.1 (Kosambi 1944). MapChart v2.32 (Voorrips 2002) was used to draw genetic maps for target QTL regions. QTL mapped within the overlapping confidence intervals were deemed identical. The physical positions of the linked markers were used to compare the GH QTL identified in the current study with genes or QTL previously reported (Ma et al. 2021) (WheatOmics 1.0, http://202.194.139.32/blast/blast.html).
PCR products of YM4 and YZ1 amplified with Pina-D1 (forward primer: CATCTATTCATCTCCACCTGC; reverse primer: GTGACAGTTTATTAGCTAGTC) and Pinb-D1 (forward primer: GAGCCTCAACCCATCTATTCATC; reverse primer: CAAGGGTGATTTTATTCATAG) primer sets were sequenced as described by Chen, Li, and Cui (2013).
2.5 Marker Development and QTL Validation in Different Genetic Backgrounds
The flanking markers of the target QTL were converted into KASP markers following Xu et al. (2020) method. PCR cycling and KASP assays were performed following Rasheed et al. (2016). Additionally, a panel of 101 wheat cultivars/lines were screened using the corresponding KASP markers to validate effects of the target QTL on GH. The list of the validation population and their phenotypes was shown in Table S1.
3 Results
3.1 Phenotypic Analyses
The phenotype values of hardness for the RIL population based on the dataset in each environment and for mean value showed a continuous distribution (Figure 1). The average hardness of the RIL population ranged between 65.09 and 68.98. GH showed obvious transgressive segregation (Table 1; Figure 1). According to variance analysis, the hb2 was 0.76, indicating that genetic factor played a major role in determining hardness in the YM4/YZ1 RIL population (Table 2).

| Trait | Enva | Yangmai 4 | Yanzhan 1 | Population | ||
|---|---|---|---|---|---|---|
| Valuesb | Maximum | Minimum | Mean | |||
| Grain hardness | 2018 | 58.58 ± 3.02* | 77.45 ± 3.94 | 88.97 | 49.05 | 65.09 |
| 2019 | 63.88 ± 2.62* | 75.27 ± 3.51 | 93.48 | 51.06 | 68.98 | |
| Mean | 61.23* | 75.88 | 91.23 | 50.74 | 67.03 | |
- a Env represents the environment.
- b Values are represented as the means ± SD.
- * The significant levels at p < 0.05, compared with Yanzhan 1.
| Source of variance | Population | Mean square | F-value | Broad-sense heritability (hb2) |
|---|---|---|---|---|
| df | ||||
| Grain hardness | 0.76 | |||
| Block/Env | 2 | 253.32 | 24.34 | |
| Environment | 1 | 2289.83 | 220.05 | |
| Genotype | 150 | 176.87 | 16.99 | |
| Genotype × Environment | 150 | 22.77 | 2.19 | |
| Error | 300 | 10.41 |
3.2 Mapping QTL for GH
KASP markers for Pina-D1 and Pinb-D1 were used to screen the parents and RILs. PCR products of YM4 and YZ1 amplified with Pina-D1 and Pinb-D1 primer sets were directly sequenced. Both YM4 and YZ1 had the wild-genotype Pina-D1 (Pina-D1a) allele, and results of alignment with reported sequences of Puroindoline-D1 alleles showed that YM4 possed the Pinb-D1b allele with one mutation (G to A) at position 223 of Pinb-D1, and YZ1 showed a deletion at position 210 of Pinb-D1 (Figure 2). However, no QTL was detected on the 5D chromosome.

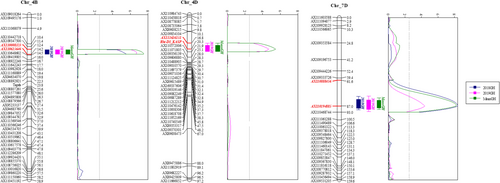
Three QTL for GH were identified on chromosomes 4B, 4D and 7D. QGh.yaas-4B explained 8.69%–12.00% of the phenotypic variances, with the LOD values ranging between 5.53 and 7.52 (Table 3; Figure 3). QGh.yaas-4B was mapped to the interval between 89.05 and 187.53 Mb on chromosome 4B (Table 3). QGh.yaas-4D explained 9.94%–11.39% of the phenotypic variances, with the LOD values ranging between 4.69 and 5.45 (Table 3; Figure 3). QGh.yaas-4D was mapped to the interval between 15.67 and 16.58 Mb on chromosome 4D, which co-located with Rht-D1 (Table 3). QGh.yaas-7D explained 9.27%–15.07% of the phenotypic variances, with the LOD values ranging between 4.39 and 8.38 (Table 3; Figure 3). QGh.yaas-7D was mapped to the interval between 42.81 and 57.78 Mb on chromosome 7D (Table 3). QGh.yaas-4B and QGh.yaas-7D were detected in all experiments and for mean value, while QGh.yaas-4D was detected in one trial and for mean value (Table 3). The positive alleles of QGh.yaas-4B and QGh.yaas-4D were from YZ1, while the positive allele of QGh.yaas-7D was from YM4 (Table 3).
| QTL | Enva | Position (cm) | Physical intervalb (Mb) | Flanking markers | LODc | PVEd (%) | Adde |
|---|---|---|---|---|---|---|---|
| QGh.yaas-4B | 2018 | 14.10 | 89.05–187.53 | AX110008323–AX110615646 | 5.53 | 8.69 | −2.33 |
| 2019 | 13.70 | 89.05–187.53 | AX110008323–AX110615646 | 6.71 | 10.21 | −3.01 | |
| Mean | 14.10 | 89.05–187.53 | AX110008323–AX110615646 | 7.52 | 12.00 | −2.62 | |
| QGh.yaas-4D | 2019 | 20.30 | 15.67–16.58 | AX111616151–Rht-D1_KASP | 4.69 | 9.94 | −2.95 |
| Mean | 20.30 | 15.67–16.58 | AX111616151–Rht-D1_KASP | 5.45 | 11.39 | −2.66 | |
| QGh.yaas-7D | 2018 | 86.80 | 42.81–57.78 | AX110888456–AX110194885 | 8.38 | 14.11 | 2.95 |
| 2019 | 87.00 | 42.81–57.78 | AX110888456–AX110194885 | 4.39 | 9.27 | 2.33 | |
| Mean | 86.20 | 42.81–57.78 | AX110888456–AX110194885 | 8.20 | 15.07 | 2.91 |
- a Env represents the environment. Mean indicated the mean value for two trials.
- b Physical interval was based on the Chinese Spring v2.1 reference genome.
- c LOD represents the logarithm of odds.
- d PVE represents phenotypic variation explained.
- e Add: Positive value indicates Yangmai 4 contributed increasing effect, and negative value indicates Yanzhan1 contributed increasing effect.

3.3 Effects of GH QTL on GH in YM4/YZ1 RIL Population
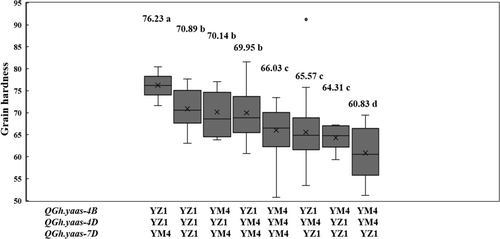
Then we evaluated the effects of the detected QTL on hardness in the RIL population based on the mean value of two environments. Three lines harboured unknown alleles at QGh.yaas-4B, QGh.yaas-4D, and QGh.yaas-7D, with an average GH of 71.15 (Table S3; Figure 4). The lines without any positive allele have an average GH of 60.83 (Table S3; Figure 4). Relative to the lines without any positive allele, lines harbouring all three positive alleles increased GH by 25.31% (p < 0.01) and have an average GH of 76.23, and lines harbouring two positive alleles increased GH by 14.99%–16.54% (p < 0.01) and have a GH ranging between 69.95 to 70.89. Lines harbouring only one positive allele increased GH by 5.72%–8.55% (p < 0.01) relative to the ones without any positive allele and have a GH ranging between 64.31 to 66.03 (Table S3; Figure 4).

3.4 Validation of the Effects of QGh.yaas-4D and QGh.yaas-7D on GH
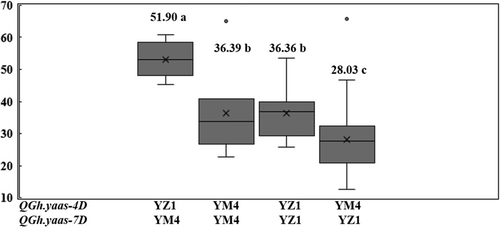
We did not validate QGh.yaas-4B because of the large mapping physical interval (Table 3). The SNP marker AX110194885 flanking the peak interval of QGh.yaas-7D was converted into QGh.yaas-7D_KASP. The forward primers of QGh.yaas-7D_KASP are 5′-GAAGGTGACCAAGTTCATGCTGTCGTTTAGGGTCTTACCACGG-3′ and 5′-GAAGGTCGGAGTCAACGGATTGTCGTTTAGGGTCTTACCACGA-3′, respectively. The reverse primer of QGh.yaas-7D_KASP is 5′-TGGAGACATATCAACAGTCGGG-3′. Then the KASP markers QGh.yaas-7D_KASP and Rht-D1_KASP were used to verify their allelic effects in the 101 wheat cultivars/lines (Table S1). All cultivars/lines in the population were divided into four groups based on their alleles (Figure 5). 65.35% of cultivars/lines harboured neither the positive alleles of QGh.yaas-4D nor QGh.yaas-7D. 19.80% of cultivars/lines harboured the positive allele of QGh.yaas-4D and the negative allele of QGh.yaas-7D. 6.93% of cultivars/lines harboured the positive allele of QGh.yaas-7D and the negative allele of QGh.yaas-4D. 7.92% of cultivars/lines harboured the positive alleles of QGh.yaas-4D and QGh.yaas-7D. Cultivars/lines harbouring positive alleles of QGh.yaas-4D and QGh.yaas-7D increased GH by 29.72% and 29.83% relative to those without any positive allele, respectively. Cultivars/lines harbouring these two positive alleles increased GH by 85.16% relative to the ones without any positive allele (Figure 5, Table S1).

We used 66 wheat cultivars in the validation population harbouring Pina-D1a, Pinb-D1a, negative alleles of QGh.yaas-4D and QGh.yaas-7D and 15 additional hard wheat cultivars harbouring negative alleles of QGh.yaas-4D and QGh.yaas-7D to compare the effects of Pina-D1b and Pinb-D1b (Table S1; Table S2). These 81 wheat cultivars were divided into three groups (Table S4). Cultivars/lines harbouring Pina-D1a and Pinb-D1a have an average GH of 28.03. Cultivars/lines carrying Pina-D1b and Pinb-D1a have an average GH of 67.03 (Tables S2 and S4). Cultivars/lines carrying Pina-D1a and Pinb-D1b have an average GH of 53.04 (Tables S2 and S4). Relative to soft alleles of Pina-D1 and Pinb-D1, Pinb-D1b and Pina-D1b increased GH by 89.23% and 139.14%, respectively (p < 0.01) (Tables S2 and S4).
4 Discussion
4.1 Comparison of QTL Identified for GH With Previous Studies
YZ1 is a hard wheat, which has an average GH of 75.88. Chen, Li, and Cui (2013) reported that Pinb-D1 had several types of mutants to produce a hard endosperm and Pinb-D1b was predominant with a high percentage. The Pinb-D1 type of YZ1 detected in the present study was reported to be another type of mutant for Pinb-D1 (Pinb-D1p) (Chen, Li, and Cui 2013; Liu et al. 2017). A previous study indicated that Pinb-D1b and Pinb-D1p were two mutants for Pinb-D1, and the two alleles have a similar effect on GH (Chen, Li, and Cui 2013). Therefore, we did not detect Pinb-D1 as a GH QTL using QTL mapping. Several previously reported QTL for GH were located on 4DS and 4BS (Zanetti et al. 2001; Li et al. 2009). Qkha.orr-4B and Qkha.orr-4D were two QTL related to kernel hardness detected in the intervals of Rht-B1 and Rht-D1, and explained 8.0%–20.2% and 14.7%–33.8% of the phenotypic variances, respectively (Wang et al. 2012). In addition, Qkha.orr-4B and Qkha.orr-4D were also associated with bran-recovered flour and break flour yield (Wang et al. 2012). QGh.yaas-4D detected in the current study was co-located with Qkha.orr-4D (Rht-D1). However, QGh.yaas-4B was mapped to the interval between 89.05 and 192.93 Mb of 4B, which is not at the genomic interval of Rht-B1 (33.61–33.62 Mb). Additionally, YM4 and YZ1 harbour the same allele for Rht-B1 (Rht-B1a), so it could be ruled out as a candidate for QGh.yaas-4B. Narrowing down the confidence interval of QGh.yaas-4B could promote its diagnostic molecular marker development. Several types of Pinb-2 were identified to be new Pinb variants (Chen, Beecher, and Morris 2010; Chen et al. 2011; Chen, Li, and Cui 2013; Ramalingam, Palombo, and Bhave 2012). Pinb-2v1, Pinb2v2, Pinb-2v3 and Pinb-2v4 were found to be located on 7DL, 7BL, 7B and 7AL, respectively. A new Pinb-2 variant, designated Pinb-2v5, was identified at the Pinb-2 locus of durum wheat cultivar Langdon (Chen et al. 2011; Chen et al. 2013). This type is only found in small amounts of durum wheat but has not been detected in most common wheat varieties (Chen et al. 2011). QGh.yaas-7D was located at the short arm of chromosome 7D, which is different from Pinb-2v1, Pinb2v2, Pinb-2v3 and Pinb-2v4. And the positive allele of QGh.yaas-7D is from YM4, which is derived from common wheat. Therefore, QGh.yaas-7D is probably a novel QTL for GH.
4.2 Analysis of the Effect of GH QTL in Mapping Population and Validation Population
In the mapping population, lines carrying two positive alleles increased GH by 7.70% relative to those harbouring only one positive allele (p < 0.01). Lines pyramiding three positive alleles increased GH by 8.39% or 16.74% relative to those harbouring two or only one positive allele (p < 0.01). Hence, significantly additive effect on GH for QGh.yaas-4B, QGh.yaas-4D and QGh.yaas-7D was observed in the mapping population.
In the validation population, breeder-friendly PCR markers QGh.yaas-7D_KASP and Rht-D1_KASP could be used in the wheat hardness breeding programs, and cultivars/lines pyramiding positive alleles of QGh.yaas-4D and QGh.yaas-7D increased GH by 42.62%–42.74% and showed a larger effect than those carrying only one positive allele (p < 0.01). The result indicated that significantly additive effect of QGh.yaas-4D and QGh.yaas-7D was also observed in the validation population. It is notable that the effect of the positive alleles of QGh.yaas-4D or QGh.yaas-7D on increasing hardness in the validation population is much greater than that in the RIL population, indicating that the effect of QGh.yaas-4D or QGh.yaas-7D on hardness was inhibited or masked by Pinb-D1.
Additionally, analysis of the effects of QGh.yaas-4D, QGh.yaas-7D, Pina-D1b and Pinb-D1b on hardness showed that the additive effect of QGh.yaas-4D and QGh.yaas-7D are similar with the effect of Pinb-D1b, but significantly lower than that of Pina-D1b.
5 Conclusions
YM4 and YZ1 possessed Pinb-D1b and Pinb-D1p, respectively. QGh.yaas-4B, QGh.yaas-4D and QGh.yaas-7D could be detected for hardness in the YM4/YZ1 population, and QGh.yaas-4D was co-located with Rht-D1. QGh.yaas-4D and QGh.yaas-7D were validated in a panel of 101 wheat cultivars/lines and showed significantly additive effect. The effect of pyramiding positive alleles of QGh.yaas-4D and QGh.yaas-7D was proved to be similar with that of Pinb-D1b and significantly lower than that of Pina-D1b.
Author Contributions
Wenjing Hu: investigation, data curation, writing – original draft, project administration. Zunjie Wang: project administration, data curation, formal analysis, validation. Rui Yong: data curation, formal analysis. Dongshen Li: data curation, formal analysis. Zhifu Gao: data curation. Jizeng Jia: supervision, resources. Chengbin Lu: data curation.
Acknowledgements
This research was funded by the National Natural Science Foundation of China (32341037), Zhong Shan Laboratory (ZSBBL-KY2023-02-2), the National Key Research and Development Program of Jiangsu (BE2021335), the earmarked fund for CARS (CARS-03-8), Core Provenance Project in Jiangsu (JBGS [2021] 047) and Seed Industry Revitalization Project of Jiangsu Province (JBGS2021006).
Conflicts of Interest
The authors declare no conflicts of interest.
Open Research
Data Availability Statement
The data that supports the findings of this study are available in the supplementary material of this article


