Use of satellite imagery to identify southern right whales (Eubalaena australis) on a Southwest Atlantic Ocean breeding ground
Funding information: Coordenação de Aperfeiçoamento de Pessoal de Nível Superior
Abstract
Satellite imagery has been used to improve scientific research worldwide. In this study, the southern right whale (Eubalaena australis) was chosen to test the use of medium, high, and very high resolution (VHR) satellite images, on the Brazilian breeding ground. These images were used to identify the whales and were compared to aerial survey data collected in the same area. The VHR satellite images from the Pleiades-1A satellite, available on Google Earth, displayed the best results when compared to those from Sentinel 2, Landsat 8, Rapid Eye, and Planet Scope. No significant differences were observed (Mann-Whitney U test) between the possible whales recorded in the satellite images and of real whales recorded in situ by aerial surveys, while considering either the number of groups (p = .841, n = 5) or the total number of animals (p = .222, n = 5). Further, when using VHR images, the geographical positions of the whales recorded in situ had a positive correlation with the positions generated from the satellite images (Mantel test: r = 0.52, p = .001, n = 13). This technique may represent an important tool for detecting right whales, especially in countries where research funding is scarce.
1 INTRODUCTION
The waters of the South Atlantic Ocean along the Brazilian coast are an important breeding area for southern right whales (Eubalaena australis). The species is more commonly found in the southern and southeastern regions of Brazil (Lodi & Bergallo, 1984; Santos et al., 2001) during winter and spring, and these areas are used for mating, giving birth, and nursing (Groch et al., 2005; Seyboth et al., 2015). After being extensively hunted for almost 400 years (Palazzo & Carter, 1983), this population of southern right whales has been studied and monitored since 1982 and has shown signs of recovery (Groch et al., 2005; International Whaling Commission [IWC], 2012). Recent population estimates indicate that the population is growing by 12% per year (IWC, 2012). Currently, the Brazilian Right Whale Catalog includes 1,009 photo-identified whales (unpublished data). The species is globally classified in the category of “least concern” (Cooke & Zerbini, 2018); however, southern right whales are included in the Brazilian List of Endangered Fauna Species (Ministério do Meio Ambiente, 2014), the Endangered Brazilian Fauna Red Book (Instituto Chico Mendes de Conservação da Biodiversidade [ICMBio], 2018), and the List of Endangered Species of the State of Santa Catarina (Conselho Estadual do Meio Ambiente, 2011).
To protect the primary region where this population occurs along the Brazilian coast, a protected area was created by a federal decree on September 14, 2000, termed the Right Whale Environmental Protection Area (RWEPA). This decree holds the government responsible for the management of natural resources, coastal occupation, tourist and sporting activities, research, and boat and aircraft traffic during the southern right whale breeding season (ICMBio, 2019). This region is characterized by shallow waters and sheltered bays where mother-calf pairs remain at the surface and individuals can be observed for several days in the same bay or within the range of a few kilometers, while moving slowly from one bay to another (Groch et al., 2005).
In recent decades, studies on cetacean distribution, habitat use, and population estimates have been conducted, mainly from platforms such as helicopters and aircraft (e.g., Kaschner et al., 2012), boats (e.g., Moura et al., 2012), ship-based (Kennedy & Clapham, 2017) or from strategic points on land (e.g., Seyboth et al., 2015). Recently, the use of drones has been incorporated as a method of tracking individuals (Hodgson et al., 2013). Nevertheless, these methods are often expensive, either in terms of financial or human resources, and usually require complicated logistics. The possibility of developing new techniques, especially low-cost options that could provide broader area coverage and more frequent sampling, could greatly expand research horizons.
Recent enhancements in satellite technology have extended the use of remote sensing for environmental monitoring, including identifying and counting the number of animals in a population. Furthermore, this method has proven to be an invaluable tool for research and conservation (LaRue et al., 2017; Leimgruber et al., 2005; Turner et al., 2003). Satellite images have already been used as a tool for detecting large whales, with surveys using commercially available images being conducted for humpback whales (Megaptera novaeangliae) in Australia (Cubaynes et al., 2019), southern right whales in Argentina (Fretwell et al., 2014; Cubaynes et al., 2019) and Antarctica (Bamford et al., 2020), gray whales (Eschrichtius robustus) in Mexico, and fin whales (Balaenoptera physalus) in the Mediterranean Sea (Digital Globe, 2017).
Large cetacean populations are essential for biodiversity conservation and the environmental management of ecosystems, as they are key indicators of health and productivity in these environments (Katona & Whitehead, 1988). The use of satellite images to locate and count southern right whales in their breeding area off Southern Brazil could be another important tool for researching and monitoring the species, as well as for the conservation of its environment and monitoring the aims of the RWEPA.
The research reported here tested the use of medium, high, and very high resolution (VHR) satellite images to locate and count southern right whale individuals at Ribanceira/Ibiraquera Bay. This bay is regarded as a preferred area and has the highest recorded densities of southern right whales off Brazil (Renault-Braga et al., 2018; Seyboth et al., 2015). Mother-calf pairs move more slowly along the coast than adults without calves (Bannister, 1990; Burnell & Bryden, 1997; Rowntree et al., 2001); diving times by whales in the region are usually less than 10 min (Palazzo et al., 2007), and the average swimming speed during the animals' stay in the region is estimated to be 2 km/hr (Bopp, 2014). In light of this, we verified the number of whales detected in satellite imagery by using aerial survey data collected by the Instituto Australis in the same area.
2 MATERIALS AND METHODS
2.1 Study area
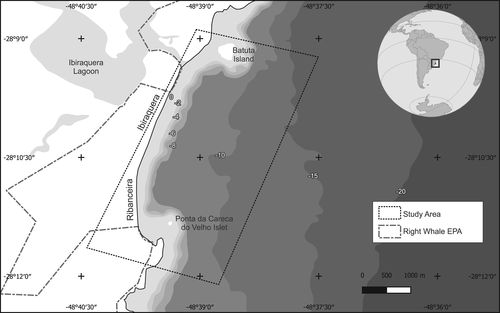
The study area encompassed Ribanceira/Ibiraquera Bay (28°10′S, 48°39′W), located in Imbituba county, on the south-central coast of the state of Santa Catarina, Brazil (Figure 1).
2.2 Image selection
Satellite images selected for this research included the region off Southern Brazil, which is preferred by southern right whales during the breeding season. Images with different characteristics and from different sources were compared to determine the most suitable set of images for the objectives of this study.
A collection of high spatial resolution images from a set of satellites operated by Planet Labs Inc. was obtained. These images are available in full TIFF format, which is, digital image file formats containing all image data captured by each satellite sensor. The Rapid Eye satellite set features images with a spatial resolution of 5 m per pixel for bands in the visible spectral range, while the Planet Scope satellite set features images with a spatial resolution of 3 m per pixel for the same spectral range (Planet Labs Inc., 2019), which we classified as high-resolution (HR). For multispectral and medium spatial resolution satellite imagery, the free imaging service offered by NASA (Landsat 8 satellite) and ESA (Sentinel 2 satellite) were selected because they are frequently used in the natural sciences.
Another possibility for accessing images that allows for supervised detection is using Google Earth software, which generally features high-resolution images but is compressed in JPEG format. This format features a loss in pixel detail but has preserved shape perception, and low temporal resolution. In the present work, we used an image of the study area available on Google Earth, taken on the same day the aerial survey was conducted and when southern right whales were present. The selected image was from the Airbus Defense & Space domain Pleiades-1A satellite and had a spatial resolution of 50 cm per pixel, which is considered as VHR.
Aerial survey data from the Instituto Australis, on the counting and photo-identification of southern right whales, were used to compare and test the efficiency of using satellite images to identify these animals. Aerial surveys were conducted using Bell Jet Ranger helicopters at an average altitude of 300 m, when the environmental conditions were favorable. These conditions included a suitable wind speed and sea state (Beaufort scale 1–3), visibility (good to optimal), and cloud cover (highest possible sun availability). Notably, these are also conditions that influence the detection of whales from satellite images, as described by previous researchers (Abileah, 2002; Cubaynes et al., 2019; Fretwell et al., 2014). During the aerial surveys, the helicopter followed the shoreline and after sighting a whale the helicopter left the shoreline route so that the researchers could photograph the whales and record their geographic positions. After this, it returned to the original shoreline route until the next whale sighting. The data collected included the following information: date, start and end time of approach, geographical coordinates, bay name, and the composition of sighted whale groups. The sighted whales were classified into three categories: mother-calf pairs (groups containing mothers and their calves), adults (groups containing adults only, not accompanied by calves), and subadults (juvenile individuals) (Taber & Thomas, 1982).
The time range for selecting the satellite images was based on a series of aerial survey data from 2009 to 2018 in September, as this is the month of peak abundance for southern right whales in the Brazilian breeding area (Groch et al., 2005; Seyboth et al., 2015). The comparison of the aerial survey data and the available satellite images included images from 2010, 2013, 2016, 2017, and 2018 in the analysis. Among these years, the difference between the aerial survey and the satellite image dates was two days at most (Table 1). For 2018, images of medium, high, and very high spatial resolutions were available for dates close to when right whales were recorded in situ (unpublished data). For the remaining years (2010, 2013, 2016, and 2017), medium and high spatial resolution images were available for dates close to the aerial surveys, and one satellite image was selected from each year for analysis.
| Year | Aerial survey | Satellite | |||
|---|---|---|---|---|---|
| Date | Image date | Satellite name | Resolution | Resolution category | |
| 2010 | September 15 | September 17 | Rapid Eye | 5 m | High |
| 2013 | September 13 | September 14 | Rapid Eye | 5 m | High |
| 2016 | September 15 | September 16 | Planet Scope | 3 m | High |
| 2017 | September 19 | September 20 | Planet Scope | 3 m | High |
| 2018 | September 8 | September 8 | Pleiades-1A | 50 cm | Very High |
| 2018 | September 8 | September 7 | Planet Scope | 3 m | High |
| 2018 | September 8 | September 7 | Landsat 8 | 15–30 m | Medium |
| 2018 | September 8 | September 7 | Sentinel 2 | 10 m | Medium |
2.3 Image interpretation method
Initially, all satellite images were opened with QGIS 3.2.3 (QGIS, 2018) and cropped to an area of 15.8 km2 for specific analysis of the Ribanceira/Ibiraquera Bay area. The images were then adjusted for better visualization using histogram and enhancement balance adjustments. The image obtained from Google Earth was also georeferenced using QGIS.
Without prior knowledge of the data obtained by the aerial surveys, one of the authors (A.A.C.), an experienced whale observer, identified points in the satellite images that could possibly include southern right whales. Each image (15.8 km2) took approximately 2 hr to be examined. After approximately 1 month, these images were independently reviewed by the same observer (A.A.C.) and by a geographer experienced in satellite image analysis (J.H.Q.). The whale detections were then pooled and only after agreement between these two observers were the positions recorded and used for the next step of the analysis.
After receiving the data collected by the aerial surveys, the previously detected points were then classified as definite whales (where it was possible to visualize a whale on the surface, as in the case of the Pleiades-1A images, regardless of having a close sighting by the aerial survey), probable whales (where the recorded points had visual characteristics similar to those of the definite whales, but less clear, increasing uncertainty for classification as a whale, and the positions were close to the ones made by the aerial survey), and possible whales (where the recorded points had visual characteristics similar to those of the probable whales, and did not have a nearby sighting in the aerial survey). This classification was based on the methods described by Cubaynes et al. (2019). Other objects, such as vessels, underwater rocks, and interferences due to image processing, or noise caused by elements in the atmosphere, were also observed in the satellite images. However, they did not present any similarities to the definite, probable, and possible whale points when the size, shape, color, and position of the objects were considered.
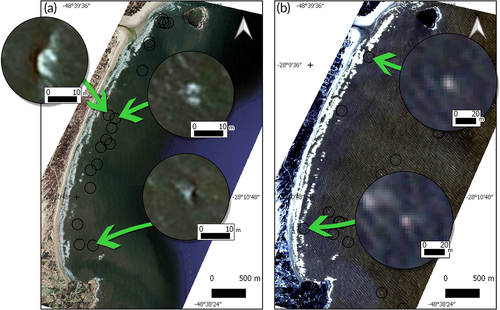
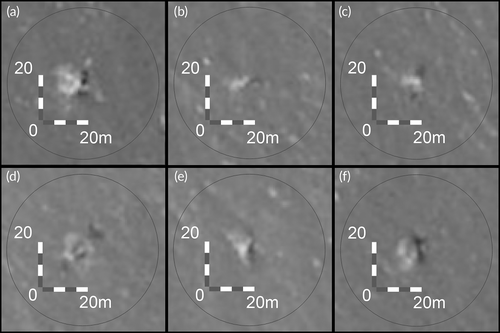
As described in previous work using VHR satellite images (Cubaynes et al., 2019; Fretwell et al., 2014), these images allowed observation of not only the body but also the sea foam created by the movement of the southern right whales (Figure 2A), which causes disturbances on the water surface (Cubaynes et al., 2019). The patterns observed in the VHR images aided the search for similar patterns in the HR images obtained from the Planet Scope and Rapid Eye satellites (Figure 2B). A custom graphical scale, measuring 20 m × 20 m, was created for use in QGIS to serve as a scaling reference for the visual comparison of possible whale detections in each image.
In the HR satellite images, spectral samples were collected from points detected as probable and possible whales for the application of unsupervised classification methods. The tools used for these tests were the Semi-automatic Classification - SCP version 6.2.9 (Congedo, 2020) and Dzetsaka version 3.4 (https://plugins.qgis.org/plugins/dzetsaka/) plug-ins, both in QGIS.
The SCP plug-in enables unsupervised pixel-to-pixel classification of images captured by multiple satellites. The available tools performed image preprocessing, postprocessing classification, and algebraic mapping. With this plug-in, we created sample areas, called “regions of interest” (ROIs), which were saved in a shapefile format. From this, the spectral signatures that could be graphically visualized in the histogram were automatically calculated.
Dzetsaka is a fast-response plug-in that uses a Gaussian blend model to determine classes from a raster file, along with a satellite image and a shapefile containing samples with previously defined classes. Therefore, the algorithms that resulted in another classified raster file were executed. The raster file was transformed into a vector, the size of the area was calculated, and a map showing the distribution of the classes in the study area was generated. In both plug-ins, the selected areas were classified as “whale” and “water.”
2.4 Analysis
To assess the existence of significant differences in the presence of whales detected by different methods, a Mann-Whitney U test was applied using Statistica v. 8.0, (Statsoft, 2007) to compare, in each year, the number of groups and whales identified during the aerial surveys with the points generated by supervised classification.
The correlation between the position of the whales taken during the 2018 aerial survey and the position of points classified as whales based on the same year's VHR satellite images was calculated using the Mantel test. For unsupervised classification, the points that were very close together and the cases where the probability of the points being whales was low were eliminated from the analysis. This was done to balance the data of the overvalued classification with those of the aerial surveys. Dissimilarity matrices were obtained by Euclidean distance, and the significance of the correlation was calculated after 999 randomizations in the Vegan package in R (Oksanen et al., 2016).
3 RESULTS
Using the HR (n = 5) and VHR (n = 1) satellite images selected (Table 1), the identification of 43 whale-like objects (19 definite, 5 probable, and 19 possible whales) were made using the visual scan method. The use of the size scale on the satellite images indicated that all identified points were close to the size of an adult right whale. Only the VHR image clearly showed individuals that were observed to have animal body shapes initially viewed on Google Earth.
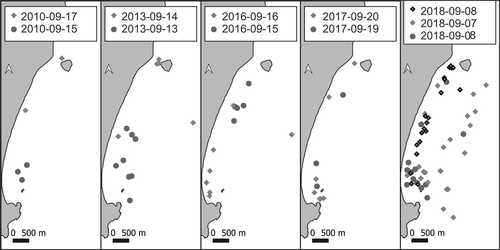
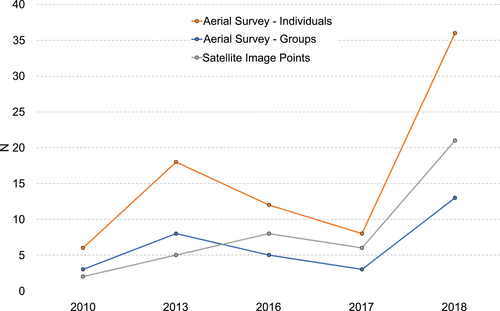
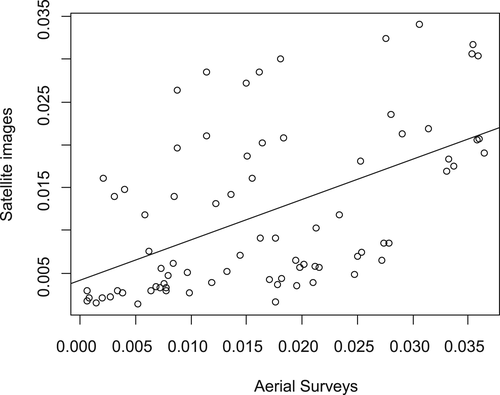
These results were compared to the sightings made during the aerial surveys in September 2010, 2013, 2016, 2017, and 2018 (Figure 3). A total of 32 southern right whale groups containing 80 individuals were recorded in the aerial surveys, along with geographic coordinates and group composition information. As the points detected in the satellite images could be one or more individuals, we compared them to both the number of groups and the number of individuals counted during aerial surveys. Except for 2016, the points detected on the satellite images followed the variation in the number of individual whales and of groups observed in the aerial survey data (Figure 4).
In the VHR image of September 8, 2018, from the Pleiades-1A satellite, 21 objects were classified as 19 definite whales and 2 as possible whales (Figure 5). The images allowed the visualization of body parts that were characteristics of the species, such as a black body and a broad and pointed tail. It was even possible to detect behavioral events, such as jumps and caudal exposures. Notably, because the image was in JPEG format it was not possible to obtain radiance values and there was no need for histogram adjustment.
Despite the relatively low number of records, the results suggest that there was no difference between these methods, indicating that the supervised classification method presented in this study is efficient in detecting southern right whales. The nonparametric Mann-Whitney U test, applied to compare the number of points recorded in the satellite images of different years, revealed that the results were not significantly different between both the number of groups (p = .841, n = 5) and the total number of whales recorded in the aerial surveys (p = .222, n = 5) in the same year. This suggests that the number of animals detected by in situ methods is not significantly different from the number of animals detected in satellite images, even with high-resolution images.
As the 2018 VHR image allowed for the conclusive detection of right whales, this image was used to compare the geographic positions of whales sighted during the aerial surveys, and the position of points classified as probable and possible whales. The similarity between the two data sets was evaluated using the Mantel test. The results of which were statistically significant (permutations = 999; r = 0.52, p = .001, n = 13), where the value of r indicates that there is a positive correlation between the two matrices, suggesting similar patterns of variation. The Mantel test also indicated that the greater the distance between the recorded points in the aerial survey, the greater the distance between them in the VHR image satellite of 2018 (Figure 6).
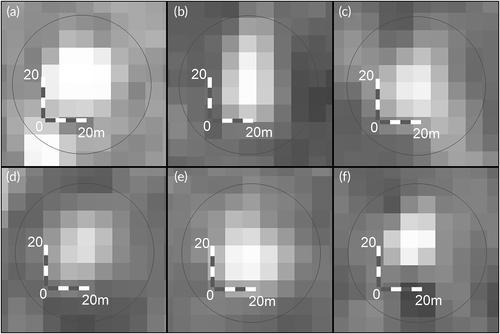
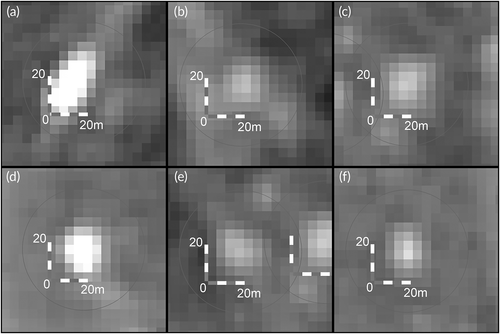
The images classified in this research as high-resolution, from Planet Labs Inc., were saved in a TIFF format and received self-control adjustments. Two of these images from the Rapid Eye satellite set, from September 17, 2010, and September 14, 2013, displayed two objects (one probable whale and one possible whale) and five objects (two probable whales and three possible whales), respectively (Figure 7). The other three images, captured by the Planet Scope satellite, presented six objects (five probable whales and one possible whale) on September 16, 2016, six objects (three probable whales and three possible whales) on September 20, 2017, and 23 objects (13 probable whales and 10 possible whales) on September 7, 2018 (Figure 8).
In addition, the Dzetsaka and SCP plug-ins were tested for unsupervised classification of these images. The spectral responses of points recorded in the images as possible whales, as well as the points designated as water (excluding the surf area), generated classification maps that indicated various points of possible whales, including places where there were only ripples in the water (Figure 9). The SCP plug-in presented more solid maps than Dzetsaka, with answers closer to the supervised classification, but both showed low efficacy for detecting objects as possible whales.
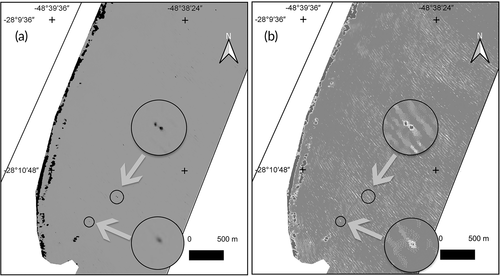
There were 22 matches between the supervised and SCP plug-in classifications representing 95.6% similarity. However, the unsupervised classification considered whales at other points such as ripples and rocks, both at the surf zone and at some distance from shore, where right whales occur less frequently.
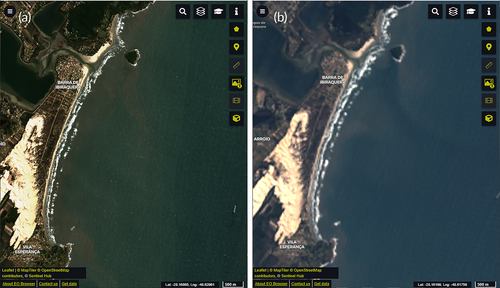
Much of satellite image processing involves downloading images and analyzing them using software, however, many satellite imagery providers now offer services with images already processed in various compositions, thereby reducing postprocessing work. These services include the Sentinel Hub online service, which we used to examine two images from Sentinel 2 and Landsat 8 satellites on September 7 and 6, 2018, respectively. However, by analyzing these images with the composition of bands available through this service, it was not possible to locate probable or possible whales (Figure 10). The outstanding moisture composition evidenced several elements present in the water, such as vessels and rocky outcrops, but no elements that could be classified as whales. Therefore, this type of image did not present satisfactory options for locating and counting whales in the present study. In addition, the images did not display good temporal resolution.
4 DISCUSSION
This is the first time that satellite imagery has been used to identify southern right whales in the breeding area off Southern Brazil. In addition, supervised classification was compared with data collected by field researchers through aerial surveys for the first time to investigate whale detection in satellite images. Earlier studies have recorded southern right whales at the Península Valdés in Argentina (Cubaynes et al., 2019; Fretwell et al., 2014) and different whale species through very high resolution satellite imagery, such as IKONOS 2 (Abileah, 2002), WorldView-2 (Fretwell et al., 2014), and WorldView-3 (Cubaynes et al., 2019).
Available satellite imagery, on dates close to that of the aerial research surveys conducted by the Instituto Australis, allowed the identification of objects classified as definite, probable, and possible whales. This suggests that satellite images can be used to monitor the habitat use of southern right whales over time, as some satellites allow for nearly daily coverage of the RWEPA. However, like every research method, this type of tool has its capabilities and limitations (LaRue et al., 2017).
The period of the images analyzed was at the peak of the breeding season, and the premigratory behaviors of mother-calf pairs, including close body contact (Taber & Thomas, 1982; Thomas & Taber, 1984), were observed. In light of this, it is believed that objects detected in the satellite images were mostly groups containing mother-calf pairs. However, in most cases, it was not possible to identify whale pairs, indicating that further research and tools to analyze such images are necessary to detect the presence of mother-calf pairs in satellite imagery (Guirado et al., 2019).
Previous studies have shown the feasibility of obtaining spectral responses of marine mammals from satellite images (Abileah, 2002; Cubaynes et al., 2019; Fretwell et al., 2014; LeBlanc et al., 2016). In the present study, unsupervised classification responses from plug-ins presented similar results to that obtained from the visual detection of whales, although it was not possible to ensure that these were spectral responses of southern right whales as they can be confused with other features, such as water ripples on the surface. However, the VHR image obtained using Google Earth software proved to be effective in identifying southern right whales in the study area. Although there were a few hours between this image and the 2018 aerial survey data, there was no statistically significant difference in their comparison, which indicates the efficacy of the method.
There was a positive and significant correlation between the geographic coordinates collected during the aerial survey and the supervised classification of 2018. In other words, the distances measured between the points in both methods generated similar responses, suggesting a similar spatial structure. We recognize that the small sample size reduces the robustness of the test, but as the pattern of change between years is similar for both in situ and remote detections, we believe that this method should be further explored. The difference between the two data sets could be simply related to the time difference between the collection of positions by the two methods and because of the whales' constant movement. According to LaRue et al. (2017), the necessary criteria for the use of VHR images in animal species monitoring are landscape openness, color, and body size under specific conditions. In addition, recognizable species characteristics, known concentration areas, aggregation habits, temporal exclusivity, and ground truthing are complementary criteria, all of which have been addressed in the present study.
Cubaynes et al. (2019) found that southern right whales and humpback whales were more difficult to detect in satellite images compared to other species (fin and gray whales) because of the lack of contrast with water in the studied sites. However, unlike humpback whales, which exhibit more active behaviors and longer diving periods, southern right whales, when in areas of reproductive concentration such as Southern Brazil, exhibit short dive intervals and remain on the surface for a long time. This is especially so in shallow areas (Palazzo et al., 2007). This kind of behavior would facilitate their detection through satellite imagery, despite the small spectral difference with respect to water.
The use of high and very high resolution satellite images for distribution and habitat use studies of southern right whales seems to be a good research tool because of the frequency at which images are available, area of coverage, efficacy, and the possibility of improvement of the method. Guirado et al. (2019) used deep convolutional neural networks (CNNs) to analyze Google Earth imagery to detect whales, encouraging the use of open-access satellite imagery for these purposes. World-View satellite images were also recently used through CNNs to classify whether tiles contain whales (Borowicz et al., 2019). However, while Google Earth has the advantage of freely offering very high resolution images in a very intuitive interface, it has a low temporal frequency. Therefore, for most research purposes, it is necessary for researchers to purchase images from commercial companies. Aerial surveys have been shown to be essential for photo identification of southern right whale individuals (e.g., Arias et al., 2018; Renault-Braga et al., 2018), but the use of satellite images can be extremely useful for studying the presence, abundance, and distribution of populations of whales over large areas, by enabling frequent monitoring at significantly lower costs.
4.1 Conclusions
This is the first study to compare the supervised classification of large whales in satellite images with data collected in situ by field researchers through aerial surveys. Very high resolution (VHR) satellite images are considered as an effective tool for the detection of southern right whales in the study area. Furthermore, these images can be incorporated as a complementary method to the study of habitat use by the species, not only in Brazil, but also in other breeding and feeding areas. For medium and high-resolution satellite images, further studies would be required to validate the supervised and unsupervised classification methods.
ACKNOWLEDGMENTS
This study was supported by the Postgraduate Support Program of Communitarian Institutions of Higher Education (PROSUC) from Coordination for the Improvement of Higher Education Personnel (CAPES). We are indebted to Dr. Felipe Rego for his support with the Mantel test analysis. We also thank the Instituto Australis for the aerial survey data collection. We deeply thank Planet Labs Inc. for allowing the access to satellite images used in this research. We are grateful for the contributions by Dr. Liliane Lodi and Dr. Rogério Santos in a previous version of this work. Also, we would like to thank for the invaluable comments of the reviewers. There is no conflict of interest for any of the authors.
AUTHOR CONTRIBUTIONS
Audrey Corrêa: Conceptualization; data curation; formal analysis; investigation; methodology; validation; visualization; writing-original draft; writing-review & editing. João Quoos: Conceptualization; data curation; formal analysis; investigation; methodology; resources; validation; visualization; writing-original draft; writing-review & editing. André Barreto: Conceptualization; data curation; formal analysis; investigation; methodology; supervision; validation; visualization; writing-original draft; writing-review & editing. Karina Groch: Resources; writing-review & editing. Patricia Eichler: Supervision; writing-review & editing.


